Quick overview
There are some important first steps before you start monitoring your network with PRTG. This e-learning module provides a quick overview of the main features of PRTG and a few important PRTG concepts, such as "sensors" and "sensor states", as well as an explanation of PRTG licensing. It then includes a discussion of how to get your IT infrastructure ready to be monitored, and recommendations for your PRTG system hardware and operating system.
Quick overview of PRTG (Video)
Installation and initial configuration with smart setup
Everything you ever wanted to know about administering PRTG: in this module you'll learn how to install PRTG and activate the software. You'll also learn how to update the PRTG software, make backups of your PRTG installation or migrate to a new server.
How to back up PRTG (Knowledge Base)
How to migrate PRTG to a different system (Website)
Access Rights Management (Manual)
PRTG Administration Tool (Manual)
Distributed monitoring with remote probes
What's a core server? What's a remote probe? This module explains the PRTG components and user interfaces, and gives an overview of the layout of the user interface. It then covers remote probes, and scenarios where remote probes are helpful. For those who require high-availability for their monitoring, this module also includes optional details about clustering in PRTG.
Architecture and User Interfaces (Manual)
PRTG apps for iOS or Android (Website)
Remote Probes and Multiple Probes (Manual)
Distributed monitoring with PRTG (Video)
How to install a remote probe (Website)
Cluster in PRTG – This is how it works (Video)
What is the clustering feature in PRTG? (Knowledge Base)
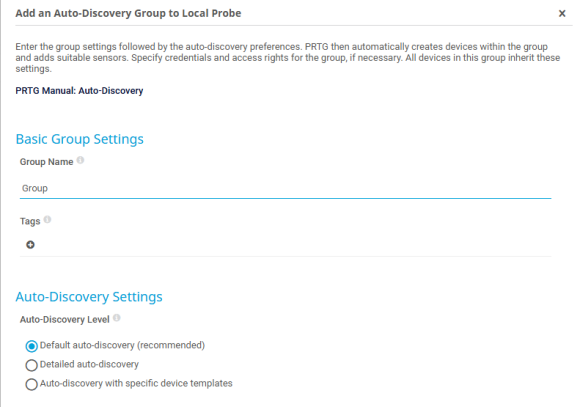
Auto-Discovery (Manual)
In this module, you'll learn how to structure your device tree, to arrange PRTG exactly the way you'd like. You'll learn about the PRTG object hierarchy and inheritance, and how to arrange the device tree to take advantage of inheritance. This e-learning module covers manual changes to the device tree, auto-discovery, libraries (alternative views of the tree), and device templates.
What options do I have to review my monitoring data in detail? (Knowledge Base)
Inheritance of Settings (Manual)
How to edit the device tree (Video)
Device and Sensor Setup (Manual)
How to use libraries in PRTG (Website)
Creating SNMP sensors
Now that you know how to structure your device tree, it's time to learn about sensors. This module covers the most common protocols used by PRTG sensors, and how to configure basic sensors. It covers SNMP sensors and bandwidth sensors in detail, so you'll learn how to set up the most important PRTG sensor types.
List of Available Sensor Types (Manual)
How to add sensor manually (Video)
When does a sensor change state? (Video)
Bandwidth Monitoring Comparison (Manual)
Bandwidth monitoring methods (Video)
Bandwidth monitoring with SNMP and WMI (Video)
Bandwidth monitoring with flow and packet sniffing (Video)
Flow and Packet Sniffer sensors
This module covers some of the more advanced PRTG sensors, such as custom sensors, receiver sensors and aggregate sensors. By the end of this module, you'll be able to set up your own custom SNMP sensors, custom script sensors and flow sensors. This module also includes discussion of how to monitor specific areas of your infrastructure, such as virtualization environments or VoIP.
List of Custom Sensors (Manual)
SNMP Custom and SNMP Library Custom sensors (Video)
Receiver sensors:
Bandwidth monitoring with flow and packet sniffing (Video)
List of Web Server (HTTP) Sensors (Manual)
SNMP Trap receiver and syslog receiver sensors (Video)
Composite sensors:
How can I use the Business Process sensor? (Knowledge Base)
Monitoring specific areas of your
IT infrastructure:
Monitoring Virtual Environments (Manual)
Introduction to notifications
This module shows you how to set up thresholds for your sensors, so you can see immediately when there's a problem in your network. In this module, you'll learn how and where to set up sensor limits, how to set up notifications, and how to trigger those notifications.
When does a sensor change its status? (Video)
How to set channel limits (Video)
Notification Delivery (Manual)
Notification Contacts (Manual)
Notification Templates (Manual)
How to set up notifications via the PRTG web interface (Website)
Notification Triggers Settings (Manual)
Creating maps
This module covers methods to see the results of your monitoring: real-time dashboards, geographical maps, and historical reports. By the end of this module, you'll be able to create your own graphical dashboards, be able to display your devices on a geographical map, and be able to generate custom reports.
Maps and Geo Maps:
Which domains and ports does the Geo Maps feature use? (Knowledge Base)
How to create dashboards in PRTG with the Maps feature (Website)
Reporting in PRTG:

Paessler Knowledge Base
What to do, when you don't know what to do? This e-learning module introduces the most important resources for learning more about PRTG: the manual, the knowledge base, and the video tutorials. It then covers the free tools Paessler offers to help you debug problems, and links to the most common issues with PRTG, including tips on how to fix them.
General resources:
Free network tools from Paessler
Common issues:
My SNMP sensors don't work (Knowledge Base)
My WMI sensors don't work (Knowledge Base)