• Company
    • About Us
    • Case Studies
    • Press Center
    • Events
    • Careers
    • Blog
    • Contact us
  • Contact us
  • Login
 
  • English
    • Deutsch
    • Español
    • Français
    • Italiano
    • Português
Paessler
                    - The Monitoring Experts
  • Products
    • Paessler PRTG
      Paessler PRTGMonitor your whole IT infrastructure
      • PRTG Network Monitor
      • PRTG Enterprise Monitor
      • PRTG Hosted Monitor
      • PRTG extensionsExtensions for Paessler PRTGExtend your monitoring to a new level
    • Icon Features
      FeaturesExplore all monitoring features
      • Maps & dashboards
      • Alerts & notifications
      • Multiple user interfaces
      • Distributed monitoring
      • Customizable reporting
  • Solutions
    • Industries
      IndustriesMonitor various industry sectors
      • Industrial
      • Healthcare
      • Data Center
      • Education
      • Finance
      • Government
    • IT Topics
      IT TopicsMonitor all areas of IT
      • Network Monitoring
      • Bandwidth Monitoring
      • SNMP Monitor
      • Network Mapping
      • WiFi Monitoring
      • Server Monitoring
  • Pricing
  • Resources
    • Getting Started
      Getting StartedModules for self-paced learning
    • How-to Guides
      How-to GuidesGet the most out of PRTG
    • Videos & Webinars
      Videos & WebinarsLearn from Paessler experts
    • IT  Knowledge
      IT KnowledgeExpand your IT knowledge
    • PRTG Manual
      PRTG ManualFull documentation
    • Knowledge Base
      Knowledge BaseShare community knowledge
    • PRTG Sensor Hub
      PRTG Sensor HubGet sensors, scripts & templates
    • Trainings
      PRTG TrainingLearn how to work with PRTG
  • Partners
    • icon star
      New Partners and MSPBecome a new partner or MSP
    • icon partner
      Partner PortalLog in to your partner account
    • Deal Registration
      Deal RegistrationRegister your sales opportunities
    • icon search
      Find a PartnerFind partners selling Paessler products
    • icon technology
      Technology AlliancesSee Paessler technology partnerships
  • Company
    • About Us
    • Case Studies
    • Press Center
    • Events
    • Careers
    • Blog
    • Contact us
  • Contact us
  • Login
  • English
    • Deutsch
    • Español
    • Français
    • Italiano
    • Português
  • Get a quote
  • Free trial
  1. Home>
  2. Resources>
  3. How-to Guides>
  4. How to set up a failover cluster in PRTG in 6 steps
PRTG Logo

How to set up a failover cluster in PRTG in 6 steps

Free download
product overview

Setting up a failover cluster with PRTG: Step-by-Step Guide

Table of content
  • Requirements for the failover cluster
  • Configure the master node
  • Configure the failover node
  • Confirm the failover node
  • Check the cluster connection status
  • Move monitoring objects to the cluster probe
  • Move custom files to the failover node
  • Add further failover nodes (optional)


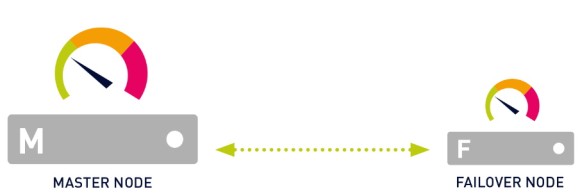
PRTG comes with a built-in failover cluster for high-availability monitoring. A failover cluster consists of two separate PRTG core server installations, where one server acts as the master node and one server as the failover node.

PRTG includes a single failover cluster with each license, no matter if you use the freeware edition or any commercial edition of PRTG Network Monitor. The cluster feature is not available in PRTG Hosted Monitor.

In this how-to guide, we show you how you can set up a single failover cluster in 6 steps.

PRTG Infographic master and failover node

Requirements for the failover cluster

Before you set up your cluster, you need to consider the following requirements:

PRTG core server
  • Make sure that you have two separate PRTG core server installations.
  • The PRTG core server systems can be physical machines or virtual machines.
  • The PRTG core servers must both run on 32-bit Windows systems or on 64-bit Windows systems.
License keyUse the same license key for both PRTG core server installations.
PRTG versionMake sure that both PRTG core servers have exactly the same PRTG version and build number. If necessary, install updates.
Port
  • Communication between the PRTG core servers must be possible in both directions.
  • Make sure that no firewall blocks the communication. If necessary, define Network Access Translation (NAT) rules.
  • The default TCP port is 23570.
Performance
  • The monitoring load doubles with each cluster node.
  • We recommend that you stay below 2,500 sensors in a cluster for best performance. More than 5,000 sensors are not supported.
  • For each additional failover node, divide the number of recommended sensors by two.

For more detailed requirements and in-depth information, see the PRTG Manual: Failover Cluster Configuration.

Bring your monitoring experience to the next level with PRTG

Get full visibility with real-time dashboards, alerts, and customizable sensors

Free download
PRODUCT OVERVIEW

Configure the master node

Choose which of your PRTG core servers will act as the master node of the cluster. If you have a PRTG installation that has been running for some time, make this PRTG core server your master node to keep your monitoring configuration.


  1. On the PRTG core server that acts as your master node, open the Windows Start menu and click All apps.
  2. Scroll down to the PRTG Network Monitor folder and click it.
  3. Double-click PRTG Administration Tool.
  4. Confirm the Windows User Account Control with Yes.
  5. Go to the Cluster tab.
PRTG screenshot create a cluster

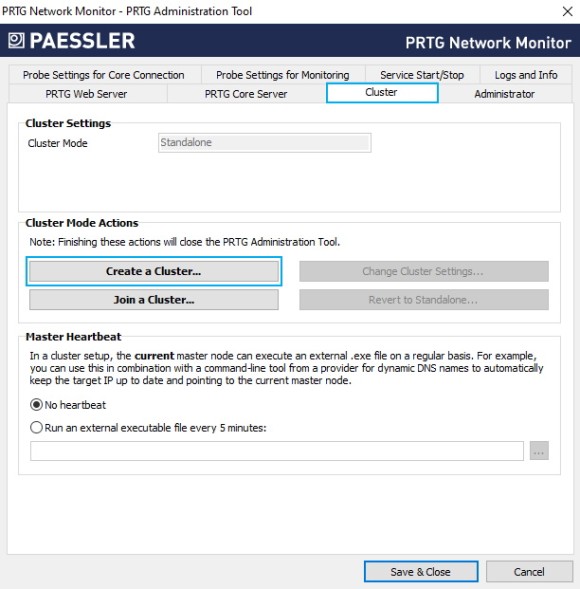
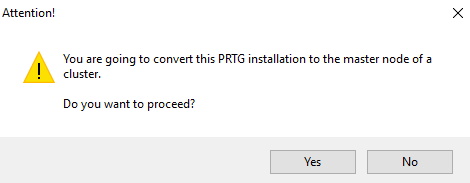
6. Click Create a Cluster and confirm the warning message with Yes.

PRTG screenshot warning message

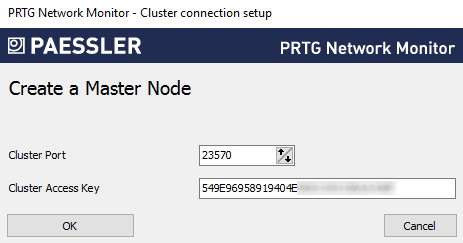
7. Enter a Cluster Port or leave the default value. The port must be open on both the master node and the failover node.

8. Enter a Cluster Access Key or leave the default value. The cluster access key must be unique. Both cluster nodes must use the same cluster access key.

9. Save the cluster access key for later use.

PRTG screenshot create a master node

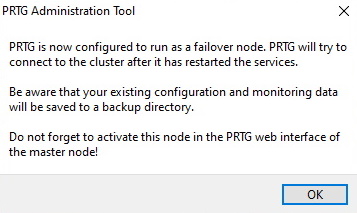
10. Click OK and confirm the message that appears with OK to restart the Windows services and convert the PRTG core server to act as the master node of the cluster.

PRTG screenshot information message

Configure the failover node

After you have configured the master node, you need to configure the failover node as well.

  1. On the PRTG core server that acts as your failover node, open the Windows Start menu and click All apps.
  2. Scroll down to the PRTG Network Monitor folder and click it.
  3. Double-click PRTG Administration Tool.
  4. Confirm the Windows User Account Control with Yes.
  5. Go to the Cluster tab.
PRTG Screenshot joing a cluster

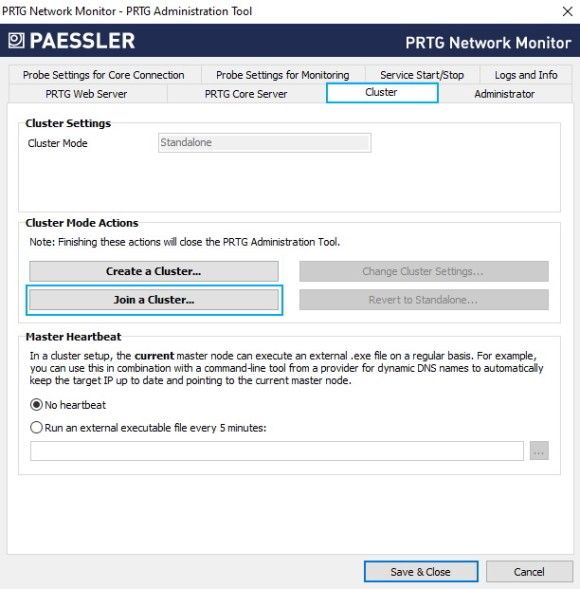
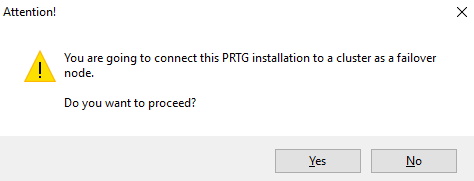
6. Click Join a Cluster and confirm the warning message with Yes.

PRTG Screenshot warning message joining a cluster

7. Under Master Node (IP address/DNS name), enter the IP address or DNS name of the master node that you previously configured.

8. Make sure that the Cluster Port matches the port that you previously configured for the master node.

9. Enter or paste the Cluster Access Key that you previously configured for the master node.

PRTG Screenshot cluster connection setup

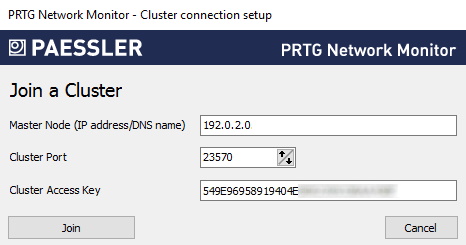
10. Click Join and confirm the message that appears with OK to restart the Windows services and convert the PRTG core server to act as the failover node of the cluster.

PRTG Screenshot message

Confirm the failover node

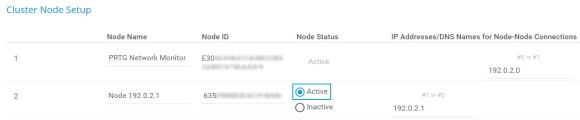
Now that you have configured the master node and the failover node, you need to confirm the failover node by setting it to the Active status in the settings of the master node.

  1. Go back to the PRTG core server that acts as your master node and log in to the PRTG web interface.
  2. From the main menu, select Setup | System Administration | Cluster to open the cluster settings.
  3. In the Cluster Node Setup list, you can see your master node in the first line and your failover node in the second line. Set your failover node to Active.
  4. Click Save for the cluster nodes to connect. It might take a few minutes until the cluster nodes start to exchange configuration data.
PRTG screenshot cluster node setup

Check the cluster connection status

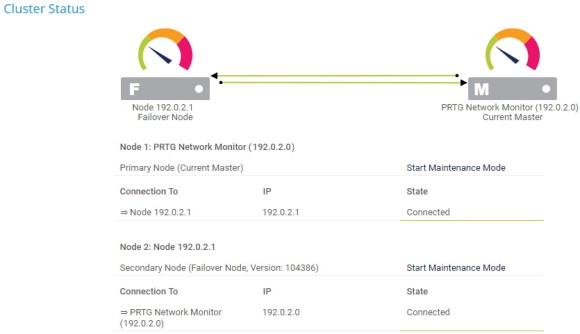
Make sure that the master node and the failover node are connected by checking the cluster status.

  1. From the main menu, select Setup | PRTG Status | Cluster Status.
  2. Check that under State, both cluster nodes show the cluster status Connected.
  3. Go to the PRTG core server that acts as your failover node and log in to the PRTG web interface there.
  4. Repeat steps 1 and 2.
PRTG Screenshot Cluster status

If the two cluster nodes have connection issues, check the following log files for any related error messages:

  • the Cluster Log below the Cluster Status section
  • the PRTG core server log file that you can find in the \Logs\core subfolder of the PRTG data directory

Also make sure that no firewall blocks the connection between the master node and the failover node via the specified cluster port on both sides. If necessary, define NAT rules for your network. See also How to connect PRTG through a firewall in 4 steps.

PRTG Screenshot Basic Device Settings

PRTG makes monitoring as easy as it gets

Custom alerts and data visualization let you quickly identify and prevent all kinds of issues

Free download
PRODUCT OVERVIEW

Move monitoring objects to the cluster probe

PRTG Screenshot move an object to another group

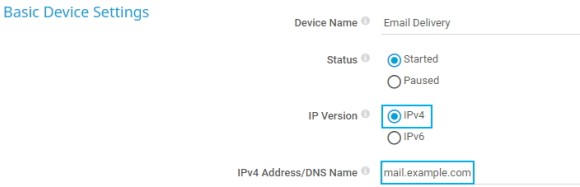
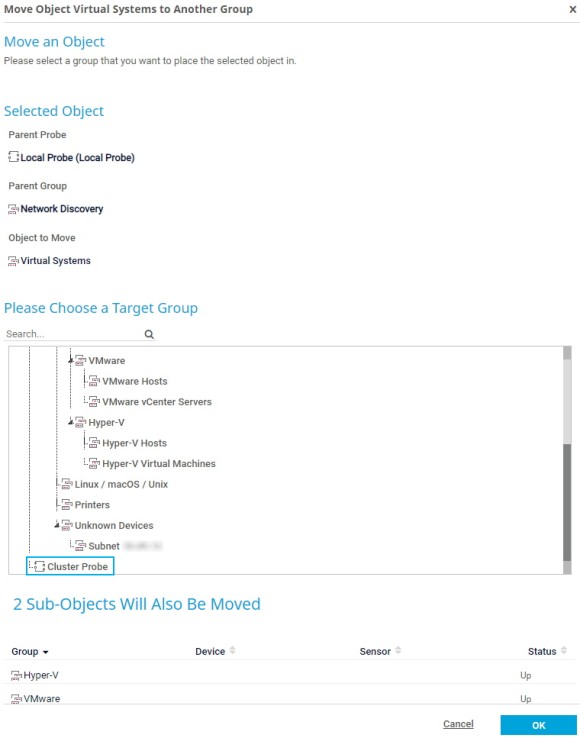
After you set up the failover cluster, you need to move your monitoring objects from the local probe to the cluster probe. This is necessary because PRTG can only monitor objects that are located on the cluster probe via all cluster nodes.

  1. On the PRTG core server that acts as your master node, select Devices from the main menu to open the device tree.
  2. Move all groups, devices, and sensors from the local probe to the cluster probe. The easiest way to do so is to make use of the object hierarchy and move only the groups that are directly underneath the local probe. This way, all subobjects are moved to the cluster probe as well.
    See the following example:
  • To move a group to the cluster probe, right-click the group name and select Move | To Other Group from the context menu.
  • In the dialog that appears, select Cluster Probe as the target group.
  • Click OK to move the group and its subobjects to the cluster probe. PRTG automatically transfers these objects including all settings to the failover node.

Move custom files to the failover node

PRTG automatically transfers maps and custom lookup files to the failover node when the master node starts up. However, you need to manually reload custom lookup files on both the master node and the failover node. See also our guide How to work with lookups in PRTG.

In addition, you must manually copy other custom files from the following subfolders of the PRTG program directory on the master node to the respective subfolders of the PRTG program directory on the failover node:

Custom contentSubfolder of the PRTG program directory
Device templates\devicetemplates
Custom sensors\Custom Sensors
MIB files\MIB
SNMP libraries\snmplibs
Notifications\notifications

Add further failover nodes (optional)

You can add more failover nodes to the cluster at any time. Keep in mind, however, that you need an additional license key if you want to run two or three failover nodes, and two additional license keys if you want to run four failover nodes.

All in all, a failover cluster can consist of a maximum of 5 cluster nodes: one master node and up to four failover nodes.

Also keep in mind the performance considerations mentioned at the beginning of this how-to guide.

This how-to guide only scratches the surface?

Get more deep-dive information here!

Preview video

Video: How to set up a cluster

VIew more
Preview manual

Manual: Failover cluster configuration in detail

READ more
PRTG Logo

Start monitoring your IT infrastructure for free with PRTG and see how it can make your network more reliable and your job easier.

Free download
PRODUCT OVERVIEW

Products

  • Paessler PRTG
    Paessler PRTGMonitor your whole IT infrastructure
    • PRTG Network Monitor
    • PRTG Enterprise Monitor
    • PRTG Hosted Monitor
    • PRTG extensions
      Extensions for Paessler PRTGExtend your monitoring to a new level
  • Icon Features
    FeaturesExplore all monitoring features

Monitoring with PRTG

  • Network monitoring
  • Bandwidth monitoring
  • SNMP monitoring
  • Network mapping
  • Wi-Fi monitoring
  • Server monitoring
  • Network traffic analyzer
  • NetFlow monitoring
  • Syslog server

Useful Links

  • PRTG Manual
  • Knowledge Base
  • Customer Success Stories
  • About Paessler
  • Subscribe to newsletter
  • PRTG Support
  • PRTG Consulting
  • PRTG Feedback & Roadmap

Contact

Paessler GmbH
Thurn-und-Taxis-Str. 14, 
90411 Nuremberg 
Germany

info@paessler.com

+49 911 93775-0

  • Contact us
©2025 Paessler GmbHTerms & ConditionsPrivacy PolicyImprintReport VulnerabilityDownload & InstallSitemap
404 - Page not found 404 - Page not found 404 - Page not found