Use PRTG remote probes to independently monitor an unlimited number of distributed networks, for example, a branch office, a company location abroad, or services in your LAN that are behind a firewall.
Remote probes come in two flavors: the classic remote probe for Windows systems and the multi-platform probe, which runs on Linux/Unix, Docker, and other systems.
The probes run in the background and collect monitoring data autonomously. This way, you can extend your monitoring without exposing your remote infrastructures to the outside world – for maximum security.
The remote probe feature in PRTG allows Managed Service Providers (MSPs) to easily offer Monitoring-as-a Service (MaaS) to their customers.
As an MSP, you own and manage the central PRTG installation and set up remote probes in each customer’s infrastructure. If a customer has several subnetworks, one remote probe is installed in each network.
The probes collect the data directly on site and send them to your central PRTG installation. Here, you can analyze and visualize monitoring data, manage the alerting and notification system, and create customized monitoring reports for each client.
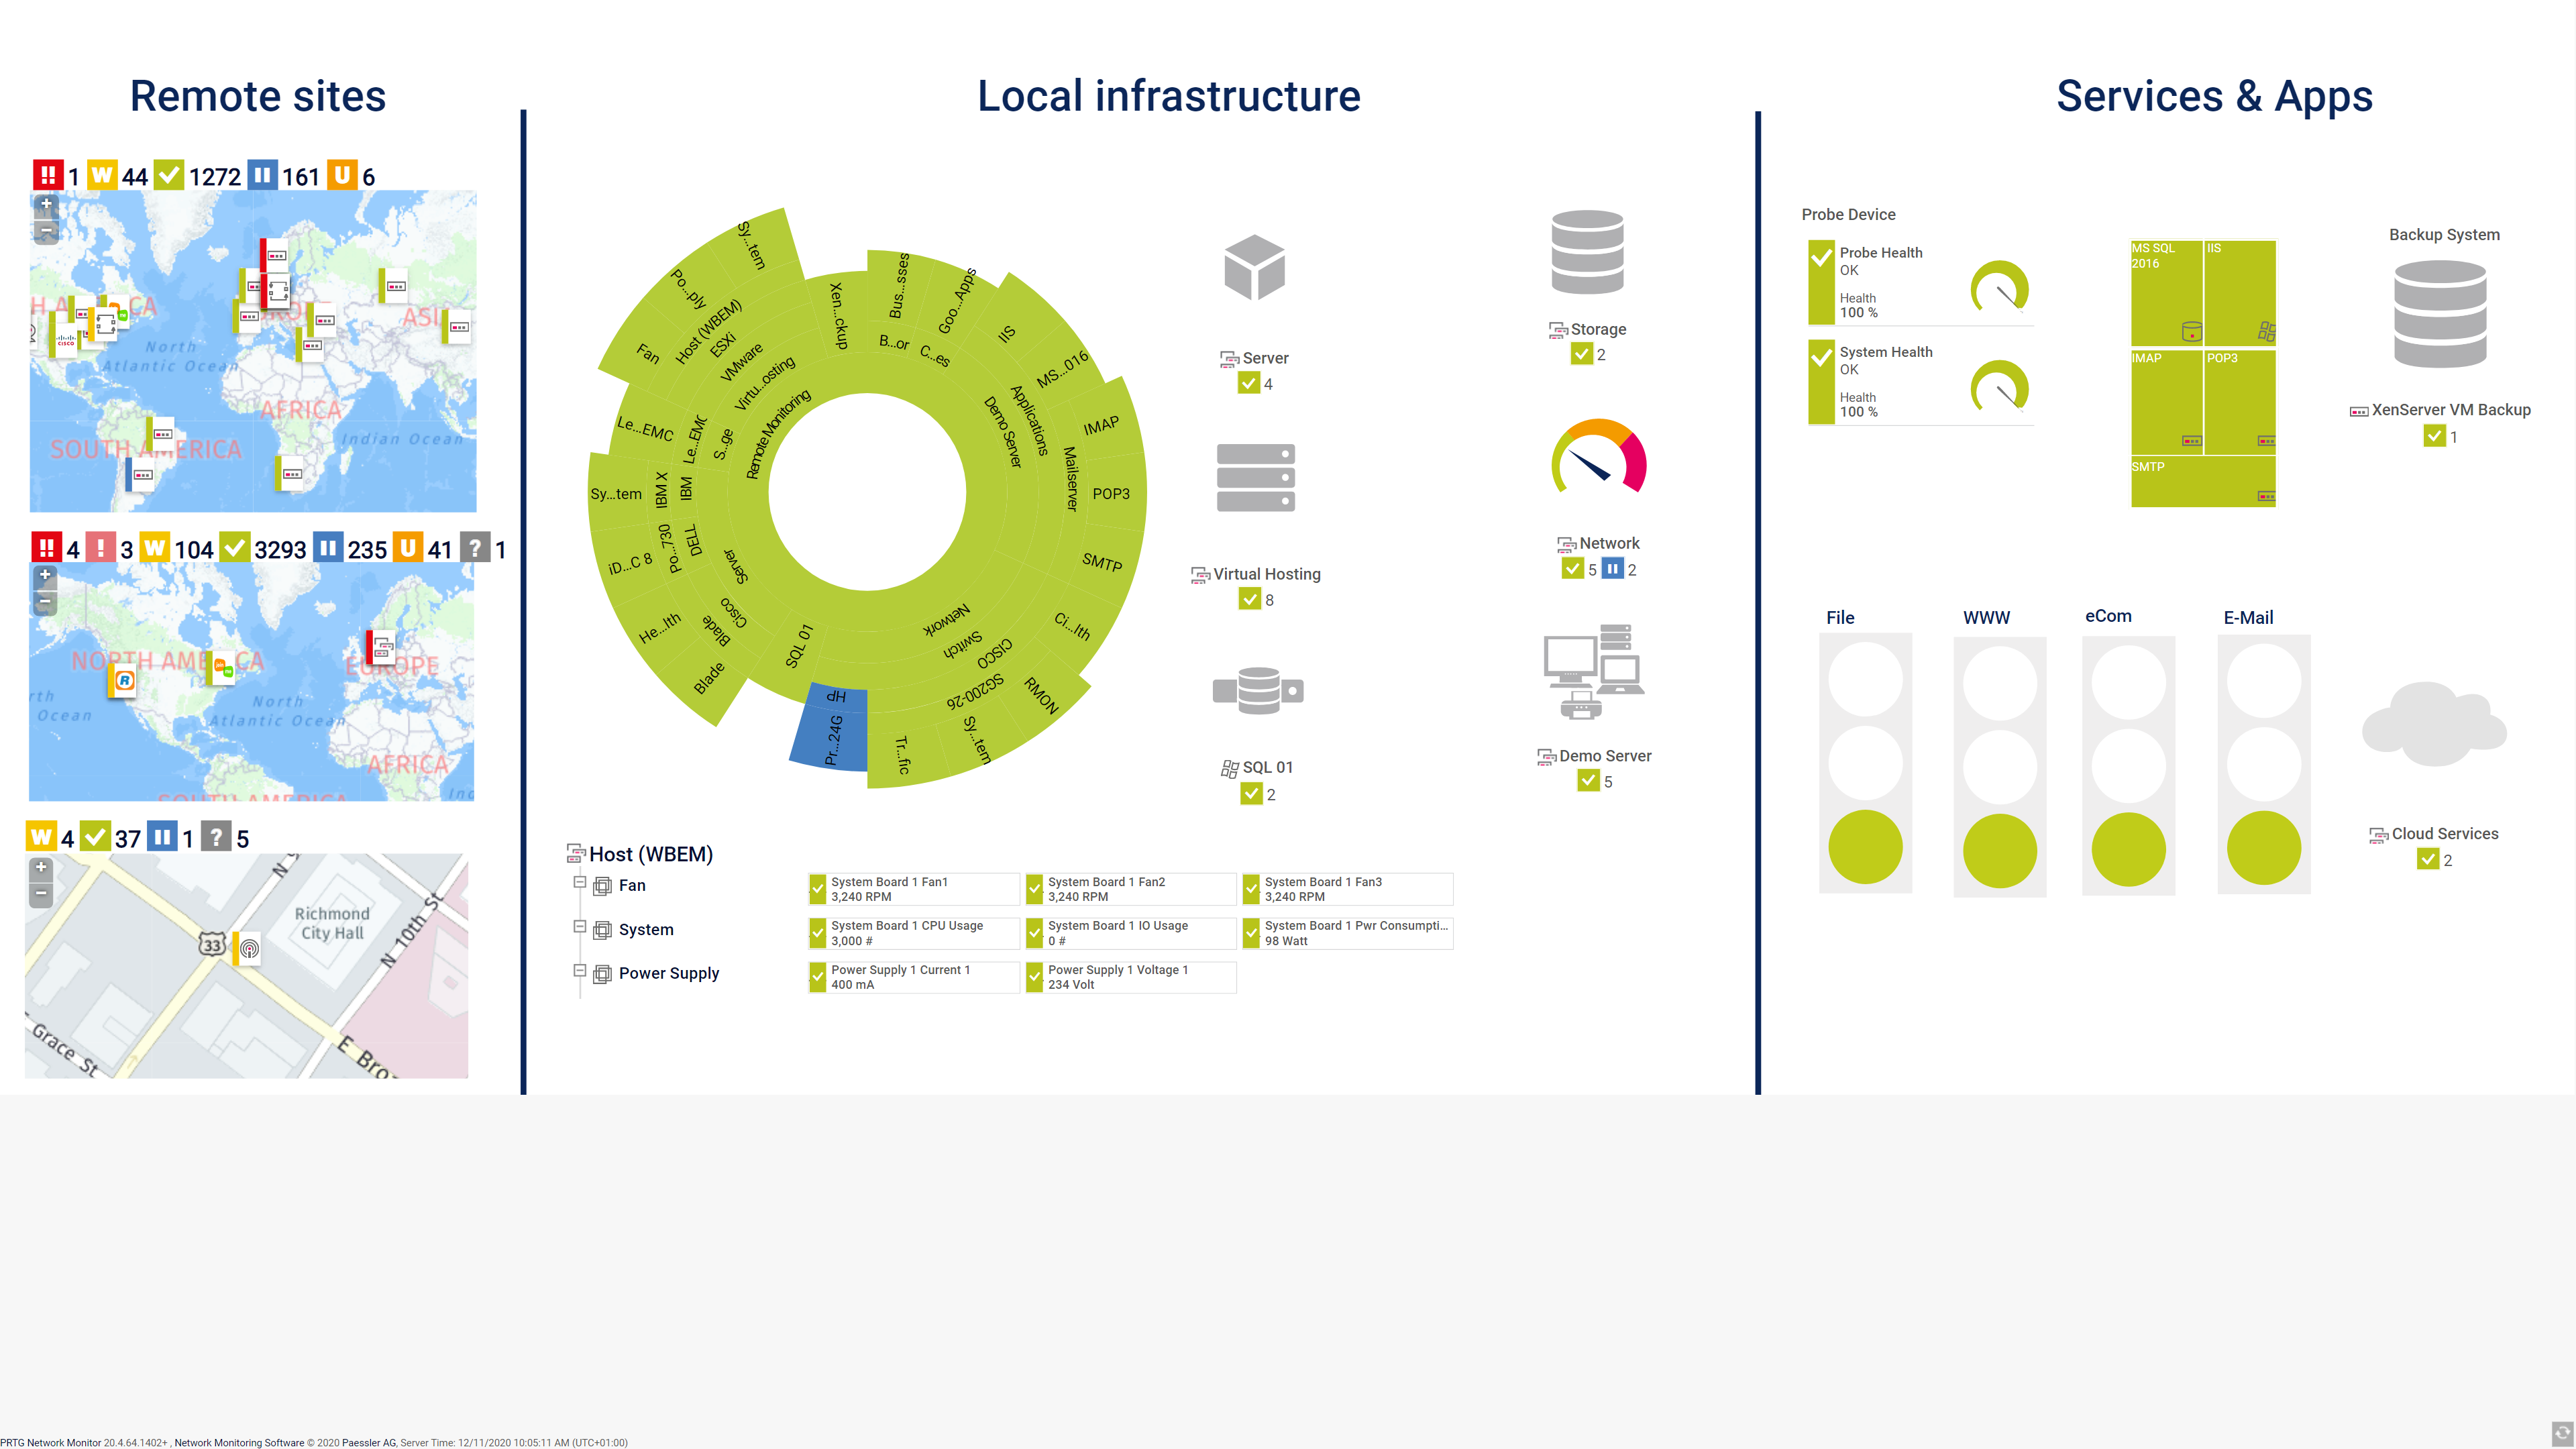
Distributed monitoring dashboard

How push notifications work
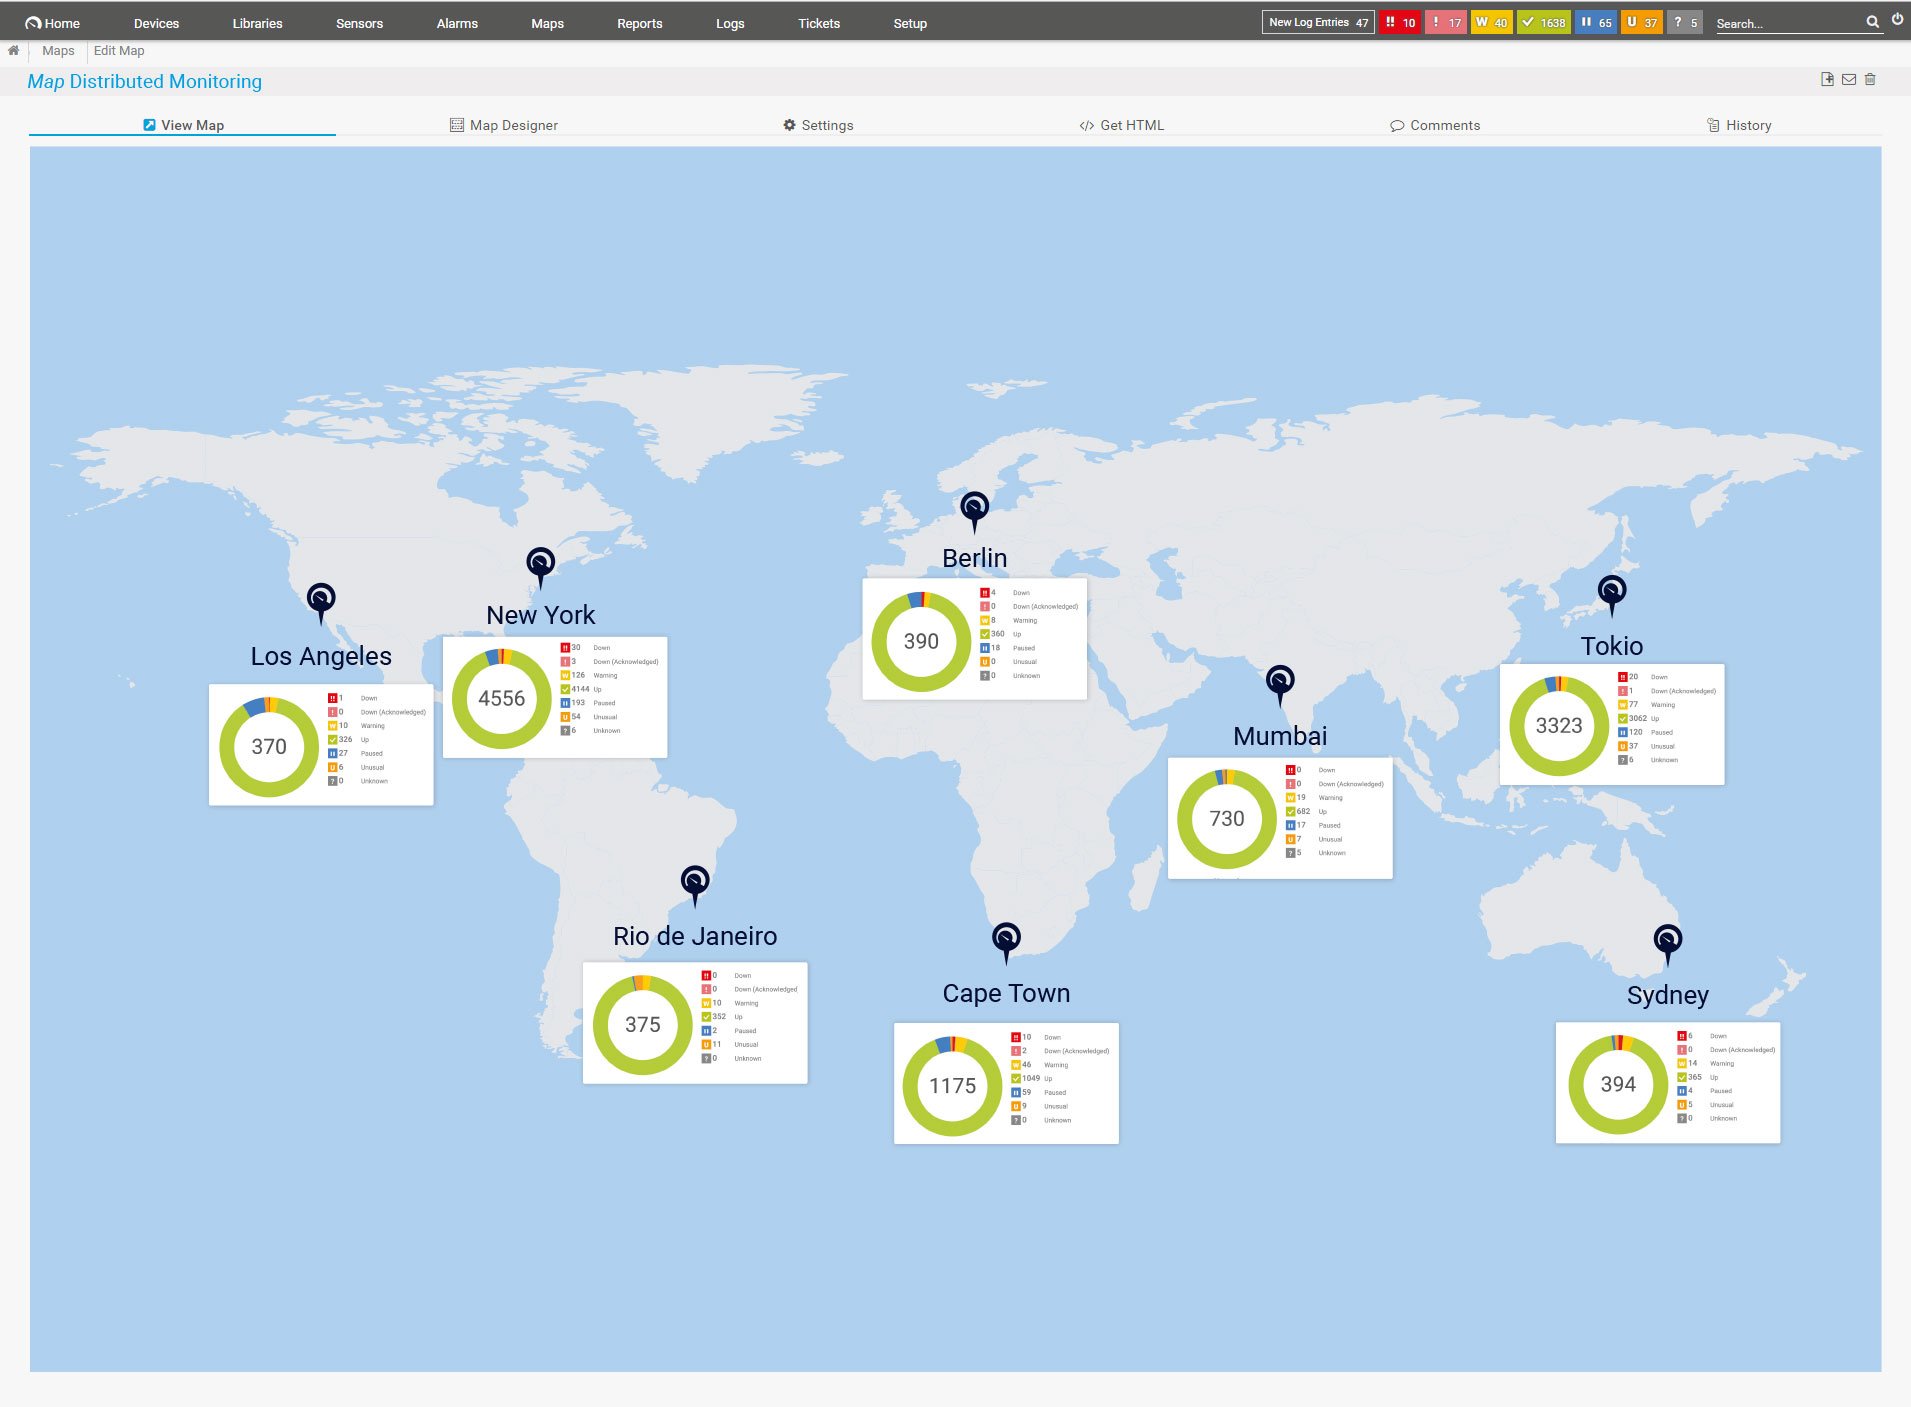
Map for distributed monitoring


