• Company
    • About Us
    • Case Studies
    • Press Center
    • Events
    • Careers
    • Blog
    • Contact us
  • Login
 
  • English
    • Deutsch
    • Español
    • Français
    • Italiano
    • Português
Paessler
                    - The Monitoring Experts
  • Products
    • Paessler PRTG
      Paessler PRTGMonitor your whole IT infrastructure
      • PRTG Network Monitor
      • PRTG Enterprise Monitor
      • PRTG Hosted Monitor
      • PRTG extensionsExtensions for Paessler PRTGExtend your monitoring to a new level
    • Icon Features
      FeaturesExplore all monitoring features
      • Maps & dashboards
      • Alerts & notifications
      • Multiple user interfaces
      • Distributed monitoring
      • Customizable reporting
  • Solutions
    • Industries
      IndustriesMonitor various industry sectors
      • Industrial
      • Healthcare
      • Data Center
      • Education
      • Finance
      • Government
    • IT Topics
      IT TopicsMonitor all areas of IT
      • Network Monitoring
      • Bandwidth Monitoring
      • SNMP Monitor
      • Network Mapping
      • WiFi Monitoring
      • Server Monitoring
  • Pricing
  • Resources
    • Getting Started
      Getting StartedModules for self-paced learning
    • How-to Guides
      How-to GuidesGet the most out of PRTG
    • Videos & Webinars
      Videos & WebinarsLearn from Paessler experts
    • IT  Knowledge
      IT KnowledgeExpand your IT knowledge
    • PRTG Manual
      PRTG ManualFull documentation
    • Knowledge Base
      Knowledge BaseShare community knowledge
    • PRTG Sensor Hub
      PRTG Sensor HubGet sensors, scripts & templates
    • Trainings
      PRTG TrainingLearn how to work with PRTG
  • Partners
    • icon star
      New Partners and MSPBecome a new partner or MSP
    • icon partner
      Partner PortalLog in to your partner account
    • icon search
      Find a PartnerFind partners selling Paessler products
    • icon technology
      Technology AlliancesSee Paessler technology partnerships
  • Company
    • About Us
    • Case Studies
    • Press Center
    • Events
    • Careers
    • Blog
    • Contact us
  • Login
  • English
    • Deutsch
    • Español
    • Français
    • Italiano
    • Português
  • Get a quote
  • Free trial
  1. Home>
  2. IT Topics>
  3. Technology>
  4. Free Syslog Server
PRTG Logo

Free Syslog Server PRTG

A single solution to monitor syslog messages and your entire network

  • Capture and analyze syslog messages
  • Get real-time alerts of errors and incidents
  • Monitor & optimize network performance
Free download
product overview

Our users give top ratings for monitoring with Paessler PRTG

Gartner peer insights
spiceworks
Capterra
G2
Trustpilot

PRTG syslog server: What you will find on this page

Table of content
  • How PRTG works as a syslog server
  • Free server monitoring vs. licensed editions
  • Visualize syslog message data in real time
  • Use cases: Is PRTG the right solution for you?
  • Explore our preconfigured PRTG sensors for syslog server monitoring
  • 3 reports to convince your CTO that PRTG is the right choice
  • Syslog server: FAQ

PRTG makes syslog message monitoring as easy as it gets

Custom alerts and data visualization let you quickly identify and prevent critical events in your network.

Free download
PRODUCT OVERVIEW

How PRTG works as a syslog server

PRTG captures, processes, and analyzes essential data.

Capture & display

As soon as PRTG receives syslog messages, PRTG syslog receiver displays all relevant information: including the IP address that the message was sent from, the time stamp of the message, and the message itself.

Process & analyze

As a syslog server, PRTG analyzes the severity level of receive syslog messages to check for potential emergencies, ranging from 0 (emergency) to 7 (debug). PRTG even reads and processes the facility code so that you can immediately identify the type of message that was sent.

Table of content

Free server monitoring vs. licensed editions

icon money

Server monitoring freeware

  • 100 sensors free for life
  • For each device about 10 sensors required
  • 100 sensors often suffice for basic server monitoring
  • Alarm, mapping, and report features included
  • Freeware edition sufficient for most small networks
icon finance

PRTG licenses

  • Flexible licenses with 500 to 10,000 sensors
  • Monitor 50 to 1,000 devices or more
  • Easily upgrade if more sensors are required
  • Existing monitoring unchanged with upgrade
  • Try full version free for 30 days

What PRTG as a syslog server looks like

Diagnose network issues by continuously tracking syslog message data. Show application availability and performance, resource usage, the syslog entries related to the root cause of the problem, and other key metrics in real time. Visualize monitoring data in clear graphs and dashboards to identify problems more easily. Gain the overview you need to troubleshoot all kinds of issues with network performance.

PRTG Screenshot device tree view

Device tree view of the complete monitoring setup

PRTG screenshot map entire it infrastructure

Custom PRTG dashboard for keeping an eye on the entire IT infrastructure

PRTG screenshot graph live data traffic

Live traffic data graph in PRTG

Start with free syslog server features as part of PRTG and see how it can make your network more reliable and your job easier.

Free download
PRODUCT OVERVIEW

IT experts agree: Paessler PRTG is a great solution for IT infrastructure monitoring

PCMag

“All-around winning
 network monitor”

IT Brief

“The real beauty of PRTG is the endless possibilities it offers”

ITPro

“PRTG Network Monitor 
is very hard to beat”

Use cases: Does PRTG have the right syslog server features for you?

test

I don't need bells and whistles, I just need a free syslog server

If you need a free, easy to set up solution for monitoring, storing, and analyzing syslog messages, then the freeware edition of PRTG is ideal. You'll even have sensors to spare and if your requirements change, you can quickly increase your capabilities at any time.

test

I need a professional network monitoring tool but I don't have the budget

Many sysadmins would like to use a professional network monitoring tool but don't have the budget to do so. Getting management to free up the necessary funds can be time-consuming and stressful. Often it's a lot easier to use a free tool. PRTG makes this possible by including 100 free sensors that never expire.

test

I just want a syslog server for my home network

Have you ever sat at home in front of your computer and wondered how to set up a syslog server for your home network? You're not alone. Many sysadmins also want reliable software for their homes. The syslog server features of PRTG can be useful for any network.

More than a free syslog server: Network monitoring that's lightweight yet powerful

icon ping

Network availability

With the Ping v2 sensor of PRTG, you can monitor the availability of all the hardware assets in your network. Servers, routers, switches, workstations…PRTG keeps an eye on everything. Find out more about uptime monitoring with PRTG.

icon boost

Network bandwidth

How much traffic passes through your network? When and where do spikes in traffic occur? How does your traffic change over time? PRTG tells you all this and more. As a result, you can take all the necessary precautions to ensure that your network is running at optimal capacity. Find out more about bandwidth monitoring with PRTG.

icon document

Logs

PRTG not only helps with syslog monitoring, but also provides comprehensive log monitoring and log management for various systems. This includes collecting and analyzing log messages from event logs, operating system logs, and log files across different platforms like macOs, Linux, or Windows. This capability ensures that network administrators have a complete view of their network infrastructure.

Explore our preconfigured PRTG sensors for syslog server

PRTG comes with more than 250 native sensor types for monitoring your entire on-premises, cloud, and hybrid cloud environment out of the box. Check out some examples below!

Syslog Receiver

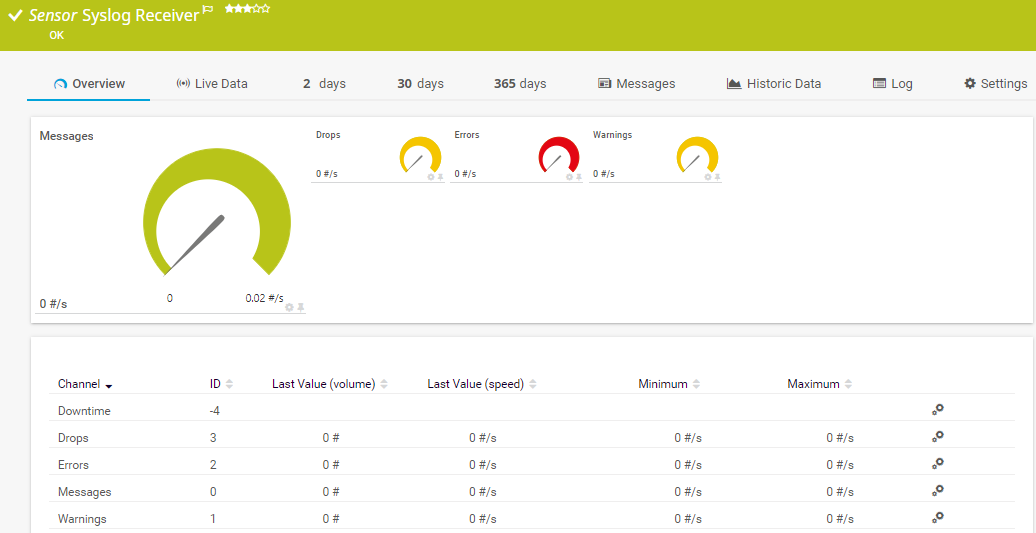
The Syslog Receiver sensor receives and analyzes Syslog messages. It can show the following:

  • Number of dropped packets on the syslog port
  • Number of messages categorized as "error" and “warning”
  • Number of received Syslog messages
Syslog Receiver
Syslog Receiver

SNMP Trap Receiver

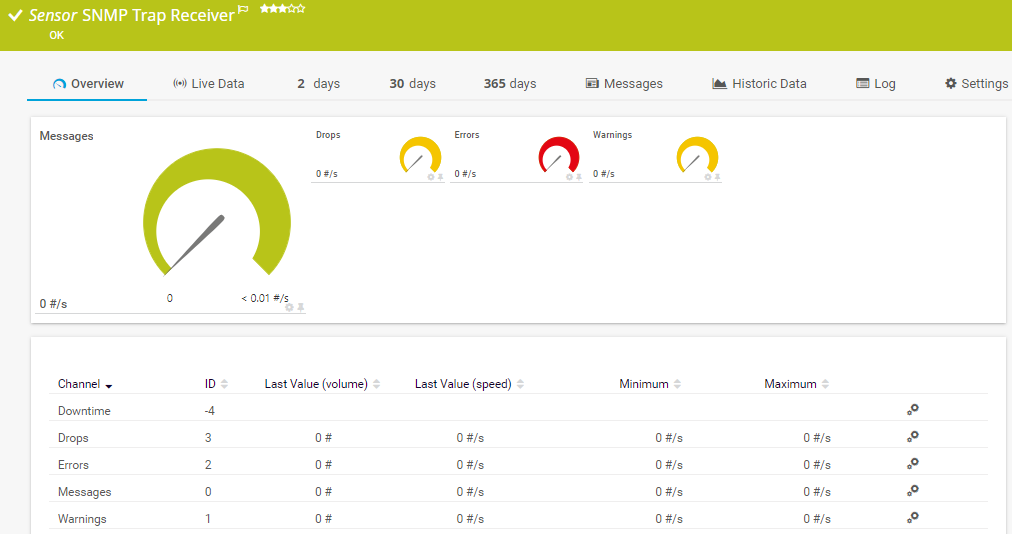
The SNMP Trap Receiver sensor receives and analyzes Simple Network Management Protocol (SNMP) traps. . It can show the following:

  • Number of dropped packets on the SNMP trap collector port
  • Number of messages categorized as "error" and “warning”
  • Overall number of received traps
SNMP Trap Receiver
SNMP Trap Receiver

WMI Event Log

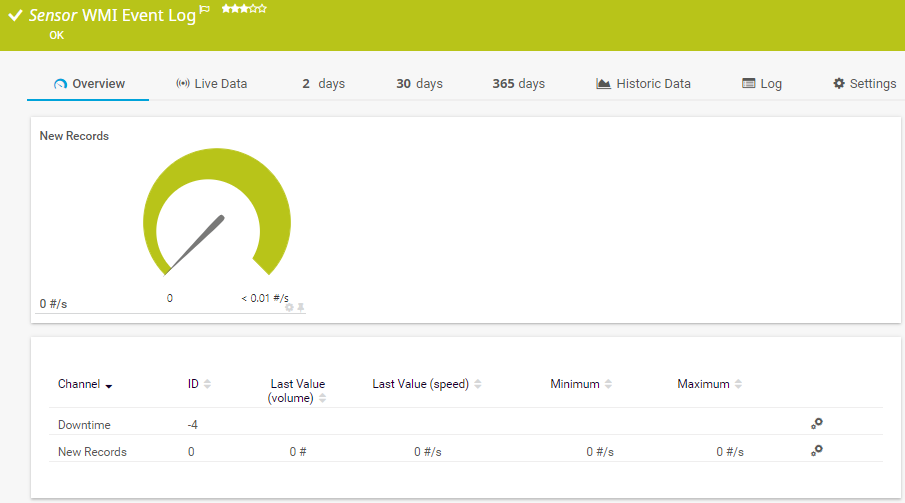
The WMI Event Log sensor monitors a Windows log file. It can show the following:

  • Downtime
  • Number of new records
WMI Event Log
WMI Event Log

See the PRTG Manual for a list of all available sensor types.

Find the root cause of the problem with our PRTG syslog server solution

Real-time notifications mean faster troubleshooting so that you can act before more serious issues occur.

Free download
PRODUCT OVERVIEW

PRTG is compatible with all major vendors, products, and systems

compatible with all major vendors, products, and systems

Need a full network monitor? Run these reports to convince your CTO

icon gauge

Downtime report

Is your network more up or down in the fight against downtime? This report is absolutely business critical, because whenever your network is down, productivity and sales decrease. Find out more about with uptime monitoring PRTG.

icon lock

Ports report

PRTG monitors both open and closed ports. Port monitoring plays a vital role in ensuring that malware does not infiltrate your network. Without monitoring software, it’s next to impossible to keep an eye on all your open ports.

icon answer

Top 10 Talkers report

What’s going on with the traffic in your network? To find out, simply generate the Top 10 Talkers report. PRTG provides real-time updates on what's up with your network – and notifies you immediately if there are sudden and drastic changes.

PRTG makes syslog message monitoring as easy as it gets

Custom alerts and data visualization let you quickly identify and prevent critical events in your network.

Free download
PRODUCT OVERVIEW

“We strive to equip our systems with state-of-the-art technology to safeguard our educational practices for the future. Part of this includes ensuring that all our systems run smoothly at all times. On any given day, we rarely have time to keep an eye on all our systems. We therefore decided to monitor our school’s IT environment with a centralized network monitoring tool.”

Stefan Roschewitz, IT administrator
BBS Holzminden

“We want to include the tool in our set of solutions in order to solve problems more proactively in our technology infrastructure. PRTG has exceeded all our expectations because it is a reliable, extremely easy-to-use solution. There is no doubt that it lives up to the renowned quality of German technology.”

Esbin Saúl Lázaro García, IT Infrastructure and Security Engineer
Hospital El Pilar

“The reactivity, know-how, and technical solutions of Paessler are outstanding in every situation. For me, no monitoring tool compares to PRTG.”

Andreas Reimann, Senior Networking Communication Architect
Zurich Airport

Your syslog server stats at a glance – even while on the go

Set up PRTG in minutes and use it on almost any mobile device.

device overview
Gartner peer insights

“Excellent tool for detailed monitoring. Alarms and notifications work greatly. Equipment addition is straight forward and server initial setup is very easy. ...feel safe to purchase it if you intend to monitor a large networking landscape.”

Read the complete review at Gartner Peer Insights

Create innovative solutions with Paessler’s IT partners

Partnering with innovative IT vendors, Paessler unleashes synergies to create
new and additional benefits for joined customers.

IP Fabric

IP Fabric

Combining PRTG’s broad monitoring feature set with IP Fabric’s automated network assurance creates a new level of network visibility and reliability.

Read more
Rhebo

Rhebo

Rhebo and PRTG offer a comprehensive monitoring solution for IT and OT environments: from condition monitoring through to anomaly and threat detection.

Read more
UVnetworks

UVnetworks

UVexplorer integrates tightly with PRTG to bring fast and accurate network discovery, detailed device inventory, and automatic network mapping to the PRTG platform.

Read more

Find the root cause of the problem with our PRTG free syslog server

Real-time notifications mean faster troubleshooting so that you can act before more serious issues occur.

Free download
PRODUCT OVERVIEW
Paessler PRTG

Paessler PRTG

Network Monitoring Software – Version 24.4.102.1351 (November 12th, 2024)

Hosting icon

Hosting

Download for Windows and cloud-based version PRTG Hosted Monitor available

Languages icon

Languages

English, German, Spanish, French, Portuguese, Dutch, Russian, Japanese, and Simplified Chinese

test

Monitor everything

Network devices, bandwidth, servers, applications, virtual environments, remote systems, IoT, and more

test

Pricing

Choose the PRTG Network Monitor subscription that's best for you

Discover beyond syslog server

Resources Solution

Solutions for all your monitoring needs

  • Syslog monitoring
  • How to: Free network monitoring
  • The monitoring solution for all areas of IT!
Resources Content

Powerful stories from the monitoring world

  • Improve Your Network Monitoring with Our Free Syslog & SNMP Trap Receiver
  • Video: SNMP Trap and syslog receiver
  • Sneak Peek into Our Labs: Introducing the New High Performance Syslog and SNMP Trap Receiver Sensors
Resources Solutions

Resources to master your monitoring challenges

  • Syslog Receiver Probe Disconnected
  • How to setup syslog server to receive logs from all devices
  • PRTG Syslog - Log retrieval

Free Syslog Server: FAQ


What is syslog?

Syslog stands for System Logging Protocol and is a standard protocol used to send system log or event messages to a specific server, called a syslog server.

It is primarily used to collect various device logs from several different machines in a central location for monitoring and review.

The protocol is enabled on most network equipment such as routers, switches, firewalls, and even some printers and scanners. In addition, syslog is available on Unix- and Linux-based systems and many web servers including Apache.

What is a syslog server in the context of PRTG?

Syslog servers are also known as syslog collectors or syslog receivers.

Devices that are accordingly configured send syslog messages to the syslog receiver. For example, the IP address of the destination syslog server must be configured on the sending device. There is no mechanism within the syslog protocol that allows a server other than the one you configured to request syslog data.

While most Unix implementations and network vendors like Cisco have their own barebones syslog collectors, there are several others available, too.

Via the Syslog Receiver sensor, PRTG can be used as a basic syslog receiver that monitors, collects, and analyzes incoming syslog messages.

How do I use the syslog receiver functionality of PRTG?

PRTG offers a preconfigured Syslog Receiver sensor. You can add this sensor either to the probe device of your PRTG installation to collect all syslog messages sent from your entire system. Or you can add the sensor to a specific device in PRTG to collect only syslogs sent from this device.

The sensor shows the following metrics:

  • The number of received syslog messages
  • The number of messages categorized as “warning”
  • The number of messages categorized as “error”
  • The number of dropped packets

You can set specific filter rules to only collect and analyze syslog messages that are business critical for you. This way, you will only be notified about alerts that you really want to know about.

What is a sensor in PRTG?

In PRTG, “sensors” are the basic monitoring elements. One sensor usually monitors one measured value in your network, for example the traffic of a switch port, the CPU load of a server, or the free space on a disk drive. On average, you need about 5-10 sensors per device or one sensor per switch port.

We asked: would you recommend PRTG? Over 95% of our customers say yes!

Paessler conducted trials in over 600 IT departments worldwide to tune its network monitoring software closer to the needs of sysadmins. The result of the survey: over 95% of the participants would recommend PRTG – or already have.

recommendation

Still not convinced?

Love

More than 500,000 sysadmins love PRTG

Paessler PRTG is used by companies of all sizes. Sysadmins love PRTG because it makes their job a whole lot easier.

PRTG

Monitor your entire IT infrastructure

Bandwidth, servers, virtual environments, websites, VoIP services – PRTG keeps an eye on your entire network.

test

Try Paessler PRTG for free

Everyone has different monitoring needs. That’s why we let you try PRTG for free.

PRTG Logo

Start with free syslog server features as part of PRTG and see how it can make your network more reliable and your job easier.

Free download
PRODUCT OVERVIEW

Products

  • Paessler PRTG
    Paessler PRTGMonitor your whole IT infrastructure
    • PRTG Network Monitor
    • PRTG Enterprise Monitor
    • PRTG Hosted Monitor
    • PRTG extensions
      Extensions for Paessler PRTGExtend your monitoring to a new level
  • Icon Features
    FeaturesExplore all monitoring features

Monitoring with PRTG

  • Network monitoring
  • Bandwidth monitoring
  • SNMP monitoring
  • Network mapping
  • Wi-Fi monitoring
  • Server monitoring
  • Network traffic analyzer
  • NetFlow monitoring
  • Syslog server

Useful Links

  • PRTG Manual
  • Knowledge Base
  • Customer Success Stories
  • About Paessler
  • Subscribe to newsletter
  • PRTG Support
  • PRTG Consulting

Contact

Paessler GmbH
Thurn-und-Taxis-Str. 14, 
90411 Nuremberg 
Germany

info@paessler.com

+49 911 93775-0

  • Contact us
©2025 Paessler GmbHTerms & ConditionsPrivacy PolicyImprintReport VulnerabilityDownload & InstallSitemap
404 - Page not found 404 - Page not found 404 - Page not found