• Company
    • About Us
    • Case Studies
    • Press Center
    • Events
    • Careers
    • Blog
    • Contact us
  • Contact us
  • Login
 
  • English
    • Deutsch
    • Español
    • Français
    • Italiano
    • Português
Paessler
                    - The Monitoring Experts
  • Products
    • Paessler PRTG
      Paessler PRTGMonitor your whole IT infrastructure
      • PRTG Network Monitor
      • PRTG Enterprise Monitor
      • PRTG Hosted Monitor
      • PRTG extensionsExtensions for Paessler PRTGExtend your monitoring to a new level
    • Icon Features
      FeaturesExplore all monitoring features
      • Maps & dashboards
      • Alerts & notifications
      • Multiple user interfaces
      • Distributed monitoring
      • Customizable reporting
  • Solutions
    • Industries
      IndustriesMonitor various industry sectors
      • Industrial
      • Healthcare
      • Data Center
      • Education
      • Finance
      • Government
    • IT Topics
      IT TopicsMonitor all areas of IT
      • Network Monitoring
      • Bandwidth Monitoring
      • SNMP Monitor
      • Network Mapping
      • WiFi Monitoring
      • Server Monitoring
  • Pricing
  • Resources
    • Getting Started
      Getting StartedModules for self-paced learning
    • How-to Guides
      How-to GuidesGet the most out of PRTG
    • Videos & Webinars
      Videos & WebinarsLearn from Paessler experts
    • IT  Knowledge
      IT KnowledgeExpand your IT knowledge
    • PRTG Manual
      PRTG ManualFull documentation
    • Knowledge Base
      Knowledge BaseShare community knowledge
    • PRTG Sensor Hub
      PRTG Sensor HubGet sensors, scripts & templates
    • Trainings
      PRTG TrainingLearn how to work with PRTG
  • Partners
    • icon star
      New Partners and MSPBecome a new partner or MSP
    • icon partner
      Partner PortalLog in to your partner account
    • Deal Registration
      Deal RegistrationRegister your sales opportunities
    • icon search
      Find a PartnerFind partners selling Paessler products
    • icon technology
      Technology AlliancesSee Paessler technology partnerships
  • Company
    • About Us
    • Case Studies
    • Press Center
    • Events
    • Careers
    • Blog
    • Contact us
  • Contact us
  • Login
  • English
    • Deutsch
    • Español
    • Français
    • Italiano
    • Português
  • Get a quote
  • Free trial
  1. Home>
  2. Resources>
  3. How-to Guides>
  4. How to set up reports in PRTG in 5 easy steps
PRTG Logo

How to set up reports in PRTG in 5 easy steps

Free download
product overview

Setting up reports in PRTG: Step-by-Step Guide

Table of content
  • Define basic report settings
  • Include sensors and set a report schedule
  • Define a report period and additional settings
  • Check and adjust the included sensors
  • Run the report

What's the benefit of reporting?

Your PRTG installation is up and running. You built and configured the device tree and organized all monitoring objects in accordance with your network infrastructure. You set up email, SMS, and push notifications and configured the respective notification triggers so that PRTG alerts you if there are issues.

Now the CIO also wants regular reports about the uptime and availability of a critical application or service that you provide to end users. The CIO plans to share these reports with the rest of the executive team as well, so that you need to keep the reports high level. Where do you start?

  • PRTG can create reports for selected sensors for a specific day or date range.
  • You can configure PRTG to only generate and store reports on your system, or to send you the reports via email as well.
  • Reports are available in PDF format and as .csv and .xml data files. Additionally, you can directly view a report in HTML format in a web browser.
  • You can also generate reports on a schedule, for example every Monday.
  • There are various report templates available that include different sets of data tables and graphs.

Bring your monitoring experience to the next level with PRTG

Get full visibility with real-time dashboards, alerts, and customizable sensors

Free download
PRODUCT OVERVIEW

Define basic report settings


Take the following steps to create a new report:

  1. Select Reports | Add Reports from the main menu.
  2. Enter a meaningful Report Name, for example, Uptime Report.
  3. Select a Report Template from the dropdown list. For the scenario described in the introduction, a Graph only template or a List of sensors template is a good choice because these templates include no data files and provide a simpler view that is easier to read and interpret.
  4. Optionally, enter Tags for the new report and define the Security Context, your Time Zone for all dates in the report, as well as the Page Format and the Page Orientation if you want to generate PDF files.
PRTG Screenshot Basic Report Settings

Include sensors and set a report schedule

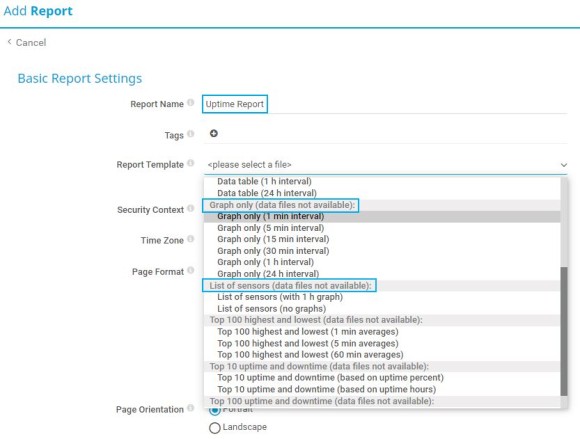
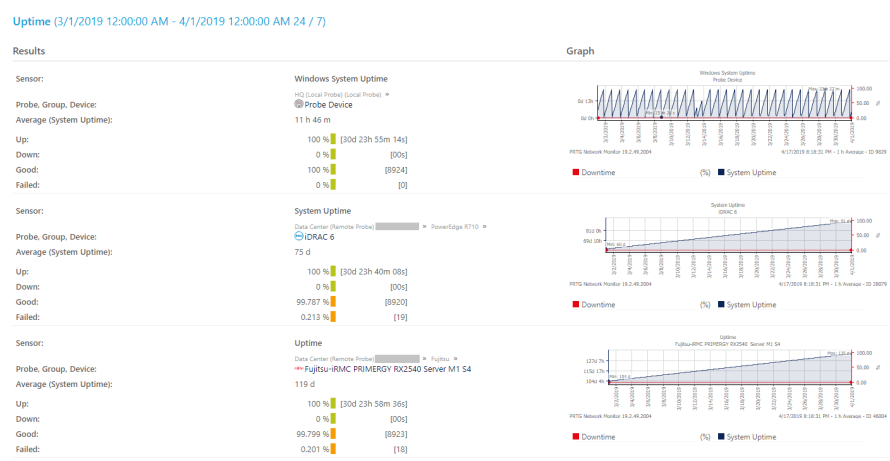
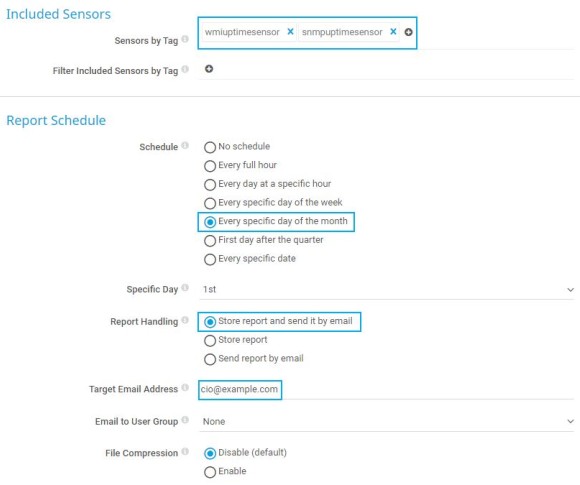
Reports show monitoring results based on sensor data that PRTG collected during a specific time span. Take the following steps to include sensors in the report by tag and to define the report period:

  1. In the Included Sensors section, enter one or more tags separated by a comma or space in the Sensors by Tag field to include all sensors that have at least one of these tags in the report. In this scenario, we use the tags wmiuptimesensor and snmpuptimesensor that are predefined in PRTG for any Windows System Uptime or SNMP System Uptime sensor.
  2. In the Report Schedule section, select No schedule if you only want to run the report on demand, or choose a schedule if you want to automatically run the report on a regular basis. For our example, we selected the automatic report creation on the first day of every month.
  3. Select Store report and send it by email as the Report Handling setting.
  4. Enter the recipient of the email with the generated report in the Target Email Address field.
PRTG Screenshot report schedule

Define a report period and additional settings

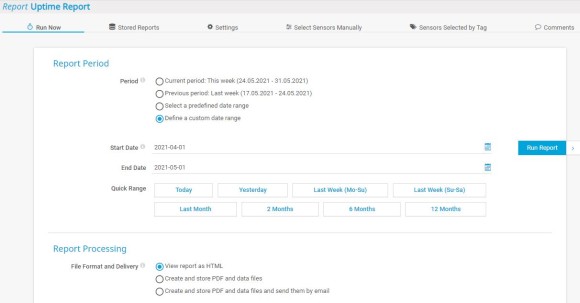
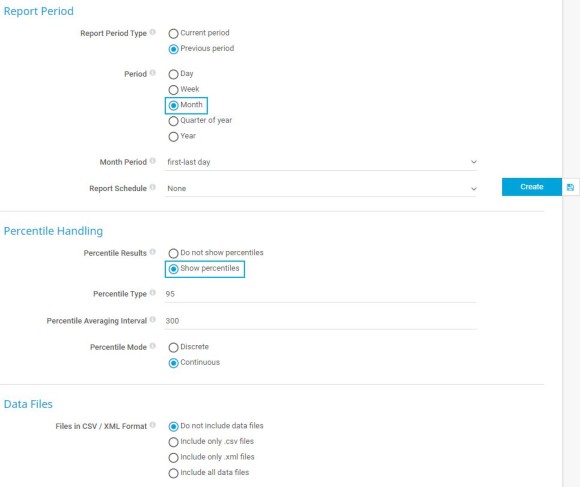
Next, define the time span that the report covers as well as additional settings, for example, define if you want to include percentiles and data files in your report.

  1. Select a Report Period Type, for example, Month.
  2. In section Include Percentiles, define if you want to Show percentiles in your report. The main advantage of using percentiles is that PRTG does not include unusually high values in the averaging calculations. This means that statistics include more relevant data. In the example of the 95th percentile, PRTG discards 5% of the highest measured values for the statistical report.
  3. In section Data Files, select if you want to include .csv and .xml data files in the report in addition to a .pdf file. You can only generate data files for report templates that include data tables.
  4. Optionally, add custom Report Comments for the beginning and the end of your report and define individual Access Rights for your user groups. These access rights specify which user groups can view or edit the report.
  5. Click Create to save the settings.
PRTG Screenshot report period

PRTG makes monitoring as easy as it gets

Custom alerts and data visualization let you quickly identify and prevent all kinds of issues

Free download
PRODUCT OVERVIEW

Check and adjust the included sensors

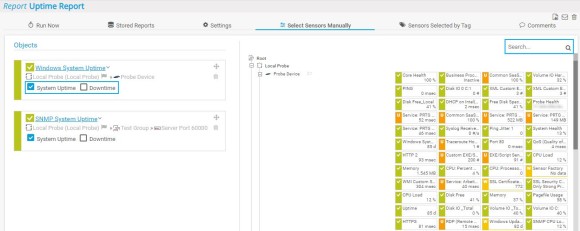
After you created the report, the Select Sensors Manually tab opens where you can manually add or remove entire probes, groups, devices, or individual sensors in addition to the sensors that you selected by tag.

You can search for specific sensors or keywords in the search box on the top-right corner of the device tree. Use drag-and-drop to add sensors to your report on the left.

If you select sensors manually, you have the option to focus only on specific channels of a selected sensor. Enable or disable the check box in front of a channel name to include or exclude the channel.

Go to the Sensors Selected by Tag tab to see a list of all sensors that you added by tag. To change tags, go back to the Settings tab.

PRTG Screenshot uptime report

Run the report

Now you can directly run the actual report. Take the following steps:

  1. Go to the Run Now tab.
  2. Select a Period that the report covers, for example, define a custom date range or use a predefined Quick Range.
  3. Choose a File Format and Delivery If you select View report as HTML, PRTG generates the report in a new browser window or tab. Depending on the number of selected sensors and the used report template, it might take a few minutes until you see the report. Select a PDF option if you want PRTG to generate the report in the background and inform you via a ToDo ticket or email once it is finished.
  4. Click Run Report and wait until PRTG created your report.
PRTG Screenshot report period

The result could be a monthly uptime report that looks something like this:

PRTG Screenshot final report output

This how-to guide only scratches the surface?

Get more deep-dive information here!

Preview video

This video explains the reporting basics

view more
Preview blog

Read more about c-level reporting in our blog

Read more
Preview Manual

Find more about reporting in our Manual

READ more
PRTG Logo

Start monitoring your IT infrastructure for free with PRTG and see how it can make your network more reliable and your job easier.

Free download
PRODUCT OVERVIEW

Products

  • Paessler PRTG
    Paessler PRTGMonitor your whole IT infrastructure
    • PRTG Network Monitor
    • PRTG Enterprise Monitor
    • PRTG Hosted Monitor
    • PRTG extensions
      Extensions for Paessler PRTGExtend your monitoring to a new level
  • Icon Features
    FeaturesExplore all monitoring features

Monitoring with PRTG

  • Network monitoring
  • Bandwidth monitoring
  • SNMP monitoring
  • Network mapping
  • Wi-Fi monitoring
  • Server monitoring
  • Network traffic analyzer
  • NetFlow monitoring
  • Syslog server

Useful Links

  • PRTG Manual
  • Knowledge Base
  • Customer Success Stories
  • About Paessler
  • Subscribe to newsletter
  • PRTG Support
  • PRTG Consulting
  • PRTG Feedback & Roadmap

Contact

Paessler GmbH
Thurn-und-Taxis-Str. 14, 
90411 Nuremberg 
Germany

info@paessler.com

+49 911 93775-0

  • Contact us
©2025 Paessler GmbHTerms & ConditionsPrivacy PolicyImprintReport VulnerabilityDownload & InstallSitemap
404 - Page not found 404 - Page not found 404 - Page not found