- English
- Deutsch
- Español
- Français
- Italiano
- Português
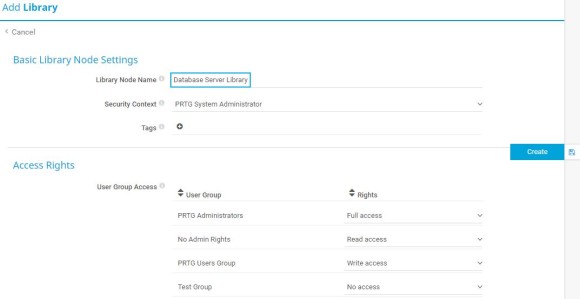
Take the following steps to create a new library:
Get full visibility with real-time dashboards, alerts, and customizable sensors
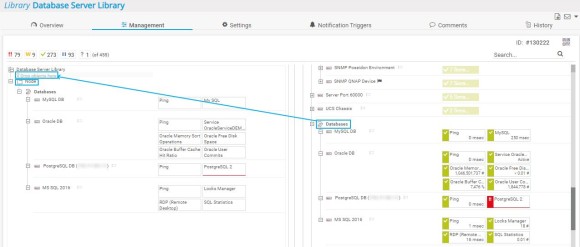
The new library opens to the Management tab. You can see a split screen. On the left side, you see your new library that is empty in the beginning. On the right side, you see the device tree. Take the following steps:
After you filled your new library with content and added library nodes, you can edit the library nodes’ display settings. Take the following steps:

Custom alerts and data visualization let you quickly identify and prevent all kinds of issues
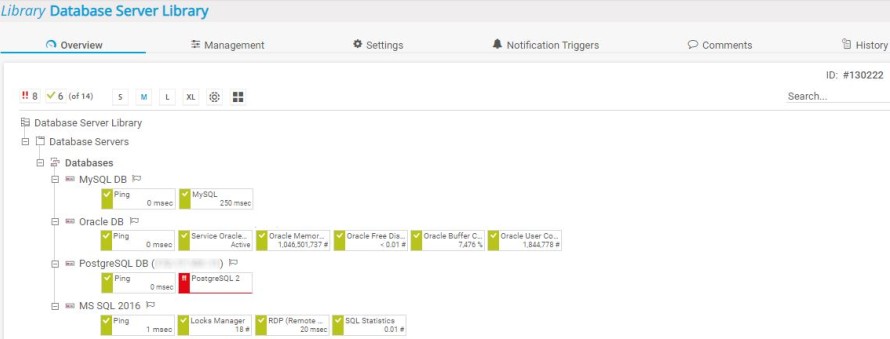
You can always click the Overview tab to view the appearance of your new library. If you previously selected Show a subtree of the device tree as Library Node View, the library might look like this:
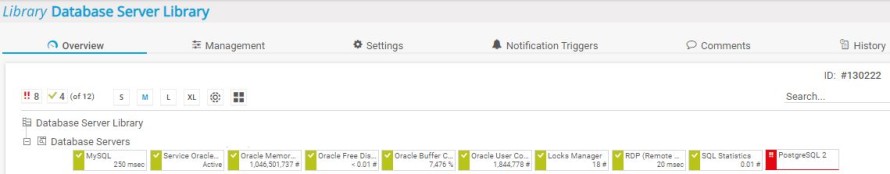
If you selected Show a collection of filtered sensors, the library might look like this:
You can perform further actions, for example:
And that’s it! In just 4 steps, you created a customized overview of a subset of your configuration – either for yourself or for a team in your organization.


