• Company
    • About Us
    • Case Studies
    • Press Center
    • Events
    • Careers
    • Blog
    • Contact us
  • Login
 
  • English
    • Deutsch
    • Español
    • Français
    • Italiano
    • Português
Paessler
                    - The Monitoring Experts
  • Products
    • Paessler PRTG
      Paessler PRTGMonitor your whole IT infrastructure
      • PRTG Network Monitor
      • PRTG Enterprise Monitor
      • PRTG Hosted Monitor
      • PRTG extensionsExtensions for Paessler PRTGExtend your monitoring to a new level
    • Icon Features
      FeaturesExplore all monitoring features
      • Maps & dashboards
      • Alerts & notifications
      • Multiple user interfaces
      • Distributed monitoring
      • Customizable reporting
  • Solutions
    • Industries
      IndustriesMonitor various industry sectors
      • Industrial
      • Healthcare
      • Data Center
      • Education
      • Finance
      • Government
    • IT Topics
      IT TopicsMonitor all areas of IT
      • Network Monitoring
      • Bandwidth Monitoring
      • SNMP Monitor
      • Network Mapping
      • WiFi Monitoring
      • Server Monitoring
  • Pricing
  • Resources
    • Getting Started
      Getting StartedModules for self-paced learning
    • How-to Guides
      How-to GuidesGet the most out of PRTG
    • Videos & Webinars
      Videos & WebinarsLearn from Paessler experts
    • IT  Knowledge
      IT KnowledgeExpand your IT knowledge
    • PRTG Manual
      PRTG ManualFull documentation
    • Knowledge Base
      Knowledge BaseShare community knowledge
    • PRTG Sensor Hub
      PRTG Sensor HubGet sensors, scripts & templates
    • Trainings
      PRTG TrainingLearn how to work with PRTG
  • Partners
    • icon star
      New Partners and MSPBecome a new partner or MSP
    • icon partner
      Partner PortalLog in to your partner account
    • icon search
      Find a PartnerFind partners selling Paessler products
    • icon technology
      Technology AlliancesSee Paessler technology partnerships
  • Company
    • About Us
    • Case Studies
    • Press Center
    • Events
    • Careers
    • Blog
    • Contact us
  • Login
  • English
    • Deutsch
    • Español
    • Français
    • Italiano
    • Português
  • Get a quote
  • Free trial
  1. Home>
  2. IT Topics>
  3. Technology>
  4. Network Protocol Analyzer
PRTG Logo

Network Protocol Analyzer with PRTG

Navigate and analyze your flow traffic with ease

  • Gain unparalleled visibility into network traffic patterns
  • Enhance your network's efficiency by using different protocols for analysis
  • Detect & mitigate network intrusions with detailed analysis of packet data
Free download
product overview

Our users give top ratings for monitoring with Paessler PRTG

Gartner peer insights
spiceworks
Capterra
G2
Trustpilot

PRTG network protocol analyzer: What you will find on this page

Table of content
  • Monitor, measure, and master network complexity
  • What network protocol analyzer looks like in PRTG
  • Benefit from advanced protocol analysis with PRTG
  • 5 reasons why PRTG is the network protocol analyzer tool of your choice
  • Explore our preconfigured PRTG sensors for network protocol analysis
  • Network Protocol Analyzer: FAQ

PRTG makes analyzing network protocols as easy as it gets

Custom alerts and data visualization let you quickly identify and prevent health, performance, and network security issues.

Free download
PRODUCT OVERVIEW

Monitor, measure, and master network complexity

In the intricate web of modern networks, having a detailed understanding of your traffic is crucial for both performance and security. Paessler PRTG stands out as a protocol analyzer by offering comprehensive visibility and control over your network traffic, ensuring your infrastructure operates seamlessly and securely while maintaining your sanity.

icon search

Deep dive into protocol analysis

PRTG goes beyond surface-level monitoring by offering deep packet inspection and flow monitoring capabilities. This advanced protocol analysis lets you peel the layers back on your network traffic in real time, providing insights into bandwidth usage, traffic sources, and potential security threats.
It takes very few clicks to get to the center of your traffic stops. With support for popular flow protocols such as NetFlow, sFlow, jFlow, and IPFIX, PRTG makes it easy to capture and analyze data packets across your network, ensuring no detail goes unnoticed.

icon adapt

Customize monitoring to fit your needs

Flexibility is key in network management, and PRTG offers unparalleled customization for protocol analysis. Tailor your monitoring setup like a new suit, with specific sensors for the protocols you use most, and adjust alert thresholds to match your network’s traffic patterns.

This customization ensures you're always the first to know about potential issues, allowing swift responses to maintain network integrity and performance.

Icon protection

Simplify and secure your entire network

PRTG simplifies the complex task of network protocol analysis by providing a single, unified endpoint for all your monitoring needs. Eliminate the need for multiple tools with PRTG's all-encompassing approach, reducing compatibility issues and security vulnerabilities.

Moreover, PRTG's secure architecture, including encrypted communications, ensures your network data remains safe and confidential.

icon statistics

Empower network traffic analysis


With PRTG, empower your network with the ability to monitor using a wide range of protocols, ensuring comprehensive coverage and deep insights.

From HTTP to SNMP, and from WMI to TCP/UDP to SSH, our packet sniffer and protocol analyzer software shines by providing detailed analytics that help you optimize performance, troubleshoot issues, and secure your network against threats.

What network protocol analyzer looks like in PRTG

Diagnose network issues by continuously tracking network traffic in your ethernet-based LAN or wireless network using different protocols. Show traffic data patterns, bandwidth usage, captured data packets, and other key performance metrics in real time. Visualize monitoring data in clear graphs and dashboards to identify problems more easily. Gain the overview you need to troubleshoot and debug issues with network packet capture, irregular traffic behavior, and bandwidth bottlenecks.

PRTG Screenshot device tree view

Device tree view of the complete monitoring setup

PRTG screenshot map entire it infrastructure

Custom PRTG dashboard for keeping an eye on the entire IT infrastructure

PRTG screenshot graph live data traffic

Live traffic data graph in PRTG

Start network protocol analysis with PRTG and see how it can make your network more reliable and your job easier.

Free download
PRODUCT OVERVIEW

IT experts agree: Paessler PRTG is a great solution for IT infrastructure monitoring

PCMag

“All-around winning
 network monitor”

IT Brief

“The real beauty of PRTG is the endless possibilities it offers”

ITPro

“PRTG Network Monitor 
is very hard to beat”

Benefit from advanced protocol analysis with PRTG

Detect peak loads

Analyze the bandwidth usage of applications and directly detect changes or irregularities in network performance. With PRTG as a protocol analysis tool, load peaks are quickly and efficiently identified and fluctuations in accessing applications or websites are revealed.

Increase network stability

Thanks to PRTG’s recorded flow data, you can scale capacities much better and thus achieve greater network stability. When bandwidth usage is optimized, the productivity of business processes and applications also increases.

Create detailed reports

Generate custom reports on demand or using schedules, and export them through various channels. This also allows other people such as the management level to be conveniently informed about the status of the network.

Identify network bottlenecks

Specific applications that use far too much bandwidth can cause bottlenecks. Overloaded Wi-Fi networks, routers, and switches also put a strain on networks. Large online backups can slow down the network, too. PRTG helps you detect bottlenecks in a targeted manner.

Keep the network up to date

Comprehensive protocol analysis with PRTG ensures that you know about bandwidth capacity and network speed in detail. Get valuable long-term information about your entire IT infrastructure to keep it up to date in a more cost-efficient and systematic manner.

5 reasons why PRTG is the network protocol analyzer tool of your choice

Comprehensive traffic insights

Gain a holistic view of your network traffic, with detailed analysis of all major protocols and bandwidth metrics.

Real-time anomaly detection

Leverage flow monitoring and packet sniffing to identify and react to network anomalies in real time.

Customizable dashboards

Create tailored dashboards that highlight the most relevant protocol analytics, keeping you informed and focused.

Scalable monitoring solution

Whether you're managing a small enterprise network or a large data center, PRTG scales to meet your protocol analysis needs.

Easy to deploy, set up, and use

With an intuitive interface and easy setup, PRTG makes advanced protocol analysis accessible to network administrators of all skill levels.

Explore our preconfigured PRTG sensors for network protocol analysis

PRTG comes with more than 250 native sensor types for monitoring your entire on-premises, cloud, and hybrid cloud environment out of the box. Check out some examples below!

SNMP Hardware Status

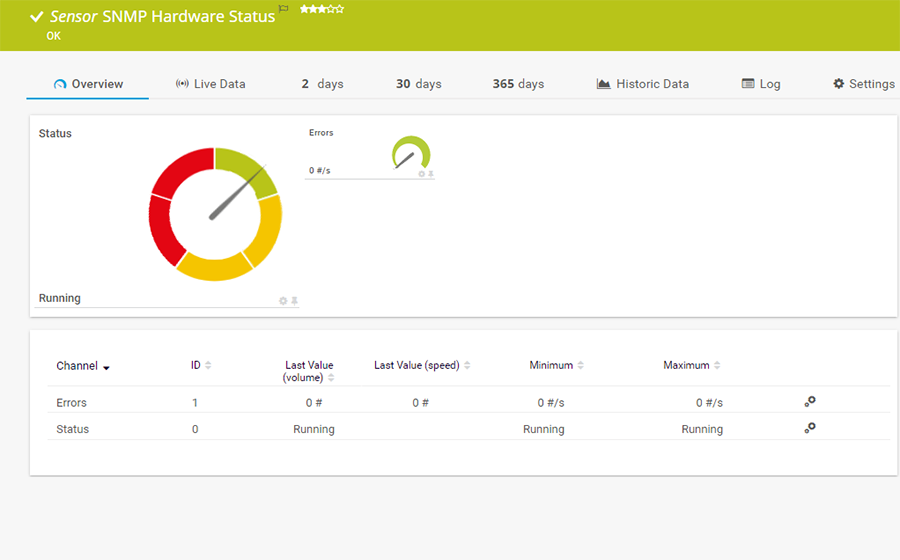
The SNMP Hardware Status sensor monitors the status of a server's hardware component. It can show the following:

  • Number of errors
  • Hardware component status
SNMP Hardware Status

WMI Disk Health

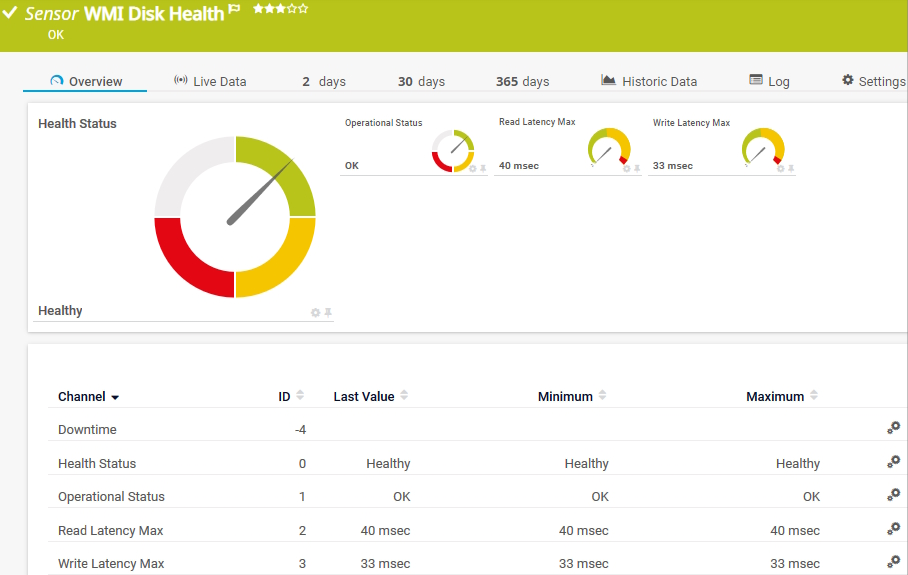
The WMI Disk Health sensor monitors the health of a physical disk on a Windows system. It can show the following:

  • Maximum flush latency
  • Health status
  • Operational status
  • Maximum read and write latency
WMI Disk Health
WMI Disk Health

SSH Meminfo

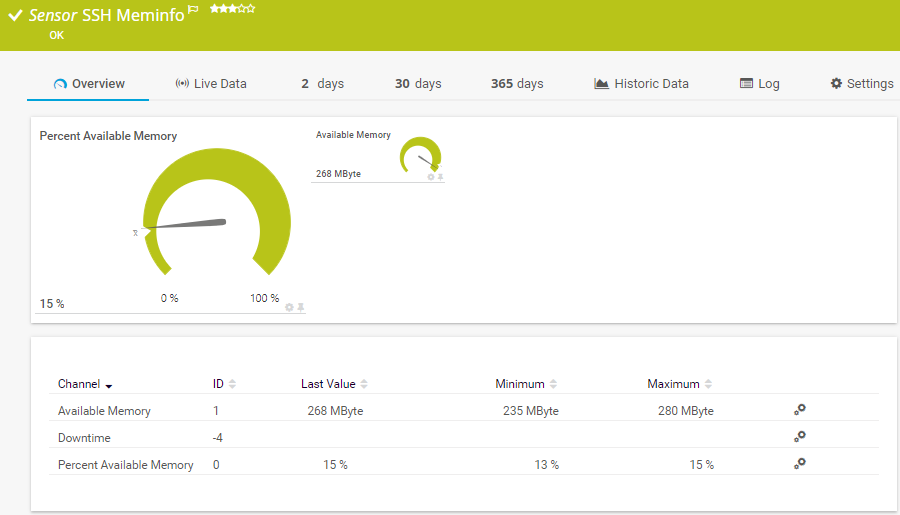
The SSH Meminfo sensor monitors the memory usage of a Linux/Unix system using Secure Shell (SSH). It can show the following:

  • Available memory
  • Downtime
SSH Meminfo
SSH Meminfo

HTTP Full Web Page

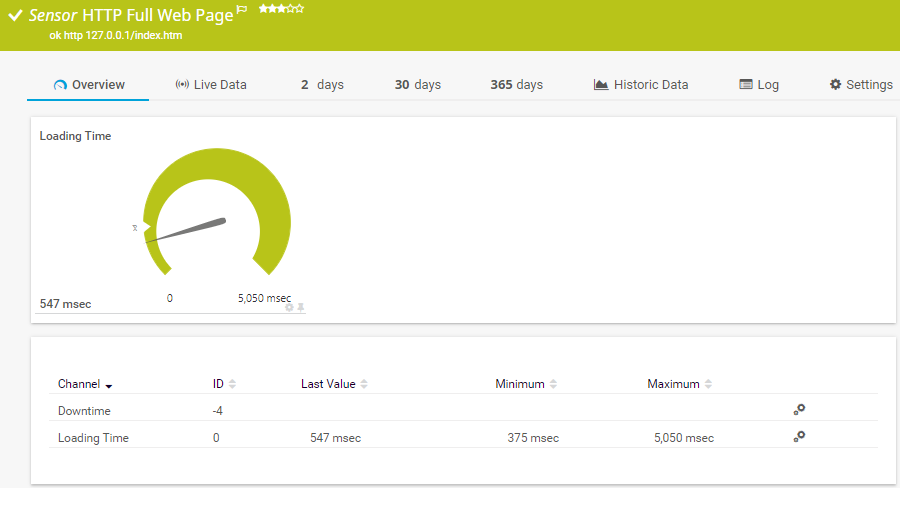
The HTTP Full Web Page sensor monitors the full download time of a web page including assets such as images. In the background, it opens the web page in a browser instance to perform the measurement. It can show the following:

  • Downtime
  • Loading time of the full web page
HTTP Full Web Page
HTTP Full Web Page

See the PRTG Manual for a list of all available sensor types.

PRTG is compatible with all major vendors, products, and systems

compatible with all major vendors, products, and systems

PRTG makes analyzing network protocols as easy as it gets

Custom alerts and data visualization let you quickly identify and prevent health, performance, and network security issues.

Free download
PRODUCT OVERVIEW

“We strive to equip our systems with state-of-the-art technology to safeguard our educational practices for the future. Part of this includes ensuring that all our systems run smoothly at all times. On any given day, we rarely have time to keep an eye on all our systems. We therefore decided to monitor our school’s IT environment with a centralized network monitoring tool.”

Stefan Roschewitz, IT administrator
BBS Holzminden

“We want to include the tool in our set of solutions in order to solve problems more proactively in our technology infrastructure. PRTG has exceeded all our expectations because it is a reliable, extremely easy-to-use solution. There is no doubt that it lives up to the renowned quality of German technology.”

Esbin Saúl Lázaro García, IT Infrastructure and Security Engineer
Hospital El Pilar

“The reactivity, know-how, and technical solutions of Paessler are outstanding in every situation. For me, no monitoring tool compares to PRTG.”

Andreas Reimann, Senior Networking Communication Architect
Zurich Airport

Your protocol analyzer at a glance – even on the go

Set up PRTG in minutes and use it on almost any mobile device.

device overview
Gartner peer insights

“Excellent tool for detailed monitoring. Alarms and notifications work greatly. Equipment addition is straight forward and server initial setup is very easy. ...feel safe to purchase it if you intend to monitor a large networking landscape.”

Read the complete review at Gartner Peer Insights

Create innovative solutions with Paessler’s IT partners

Partnering with innovative IT vendors, Paessler unleashes synergies to create
new and additional benefits for joined customers.

NetBrain

NetBrain

Integrating monitoring results from PRTG into NetBrain maps makes the foundation for network automation.

Read more
Plixer

Plixer

Paessler and Plixer provide a complete solution adding flow and metadata analysis to a powerful network monitoring tool.

Read more
UVnetworks

UVnetworks

UVexplorer integrates tightly with PRTG to bring fast and accurate network discovery, detailed device inventory, and automatic network mapping to the PRTG platform.

Read more

Find the root cause of the problem with our PRTG network protocol analyzer

Real-time notifications mean faster troubleshooting so that you can act before more serious issues occur.

Free download
PRODUCT OVERVIEW
Paessler PRTG

Paessler PRTG

Network Monitoring Software – Version 24.4.102.1351 (November 12th, 2024)

Hosting icon

Hosting

Download for Windows and cloud-based version PRTG Hosted Monitor available

Languages icon

Languages

English, German, Spanish, French, Portuguese, Dutch, Russian, Japanese, and Simplified Chinese

test

Monitor everything

Network devices, bandwidth, servers, applications, virtual environments, remote systems, IoT, and more

test

Pricing

Choose the PRTG Network Monitor subscription that's best for you

Discover more monitoring insights and stories

Resources Solution

Solutions for all your monitoring needs

  • Network Analyzer
  • Packet Analyzer
  • Free NetFlow Monitoring
Resources Content

Powerful stories from the monitoring world

  • Rhebo Industrial Protector – keeping the lights on
  • Syslog - Definition and Details
  • SNMP Doesn’t Work! Can Somebody Out There Please Help?!
Resources Solutions

Resources to master your monitoring challenges

  • How can we monitor specific type of traffic like, HTTP,FTP,SMTP etc
  • SIP and IM HTML links in PRTG Maps
  • Netflow Various channel

Network Protocol Analyzer: FAQ


What is a network protocol analyzer tool?

A protocol analyzer (also protocol analysis tool, traffic analyzer, packet analyzer, or packet analysis tool) is software that you can use to record and analyze data traffic in a network. In concrete terms, this means that the network traffic is broken down according to various parameters. The data flows are then displayed in diagrams and tables for analysis.

PRTG includes protocol analysis functionalities to track and analyze using packet sniffing, as well as different flow protocols. Network traffic is categorized by connection, IP address, and by protocol.

How is network traffic recorded with flow monitoring?

In the context of flow monitoring, the term “flow” refers to the flow of data packets between two endpoints, such as devices or applications. Recording the data flow is mostly done by exporting the flow data of a device (for example a router, firewall, or switch). In addition, a data collector is required. Its task is to log the data so that it can be analyzed later.

PRTG offers several preconfigured sensors for collecting, analyzing, and monitoring flow data.

How does PRTG use flow monitoring in protocol analysis?

PRTG incorporates flow monitoring technologies like NetFlow, sFlow, and jFlow in its protocol analysis toolkit. This allows for the in-depth examination of network traffic patterns, helping to identify the types of traffic and protocols being used, as well as pinpointing sources of high bandwidth consumption. Flow monitoring is essential for understanding how data moves through your network and for identifying potential security threats or inefficiencies.

Can PRTG analyze encrypted traffic within flow data?

Yes, while PRTG respects encryption by not decrypting content, it analyzes encrypted traffic flow data to provide insights on bandwidth usage, communication patterns, and source/destination metrics. This level of analysis is critical for managing network performance and security, even when the traffic content remains private.

How customizable is PRTG's protocol and flow analysis?

PRTG offers extensive customization options for protocol and flow analysis, including the ability to set specific sensors and filters for monitoring particular protocols or traffic types. This flexibility ensures that network administrators can focus on the traffic that matters most to their organization's security and performance goals.

How does PRTG identify network anomalies through protocol and flow analysis?

Leveraging protocol analysis and flow data, PRTG can detect anomalies by comparing current traffic patterns against historical baselines. This capability allows for the early detection of unusual activities, such as spikes in bandwidth usage or the emergence of unfamiliar protocols, which could indicate security concerns or network issues.

Can PRTG monitor both internal and external network traffic through flow analysis?

Indeed, PRTG's flow monitoring capabilities extend to both internal network traffic and external Internet-bound traffic. This ensures comprehensive visibility into all data flows, enabling effective management and security oversight across the entire network infrastructure.

What is a sensor in PRTG?

In PRTG, “sensors” are the basic monitoring elements. One sensor usually monitors one measured value in your network, for example the traffic of a switch port, the CPU load of a server, or the free space on a disk drive. On average, you need about 5-10 sensors per device or one sensor per switch port.

We asked: would you recommend PRTG? Over 95% of our customers say yes!

Paessler conducted trials in over 600 IT departments worldwide to tune its network monitoring software closer to the needs of sysadmins. The result of the survey: over 95% of the participants would recommend PRTG – or already have.

recommendation

Still not convinced?

Love

More than 500,000 sysadmins love PRTG

Paessler PRTG is used by companies of all sizes. Sysadmins love PRTG because it makes their job a whole lot easier.

PRTG

Monitor your entire IT infrastructure

Bandwidth, servers, virtual environments, websites, VoIP services – PRTG keeps an eye on your entire network.

test

Try Paessler PRTG for free

Everyone has different monitoring needs. That’s why we let you try PRTG for free.

PRTG Logo

Start network protocol analysis with PRTG and see how it can make your network more reliable and your job easier.

Free download
PRODUCT OVERVIEW

Products

  • Paessler PRTG
    Paessler PRTGMonitor your whole IT infrastructure
    • PRTG Network Monitor
    • PRTG Enterprise Monitor
    • PRTG Hosted Monitor
    • PRTG extensions
      Extensions for Paessler PRTGExtend your monitoring to a new level
  • Icon Features
    FeaturesExplore all monitoring features

Monitoring with PRTG

  • Network monitoring
  • Bandwidth monitoring
  • SNMP monitoring
  • Network mapping
  • Wi-Fi monitoring
  • Server monitoring
  • Network traffic analyzer
  • NetFlow monitoring
  • Syslog server

Useful Links

  • PRTG Manual
  • Knowledge Base
  • Customer Success Stories
  • About Paessler
  • Subscribe to newsletter
  • PRTG Support
  • PRTG Consulting

Contact

Paessler GmbH
Thurn-und-Taxis-Str. 14, 
90411 Nuremberg 
Germany

info@paessler.com

+49 911 93775-0

  • Contact us
©2025 Paessler GmbHTerms & ConditionsPrivacy PolicyImprintReport VulnerabilityDownload & InstallSitemap
404 - Page not found 404 - Page not found 404 - Page not found