Custom alerts and data visualization let you quickly identify and prevent network overload and potential bottlenecks.
By filtering and analyzing your network traffic using jFlow, Paessler PRTG helps you in the following ways:

jFlow monitoring with PRTG is characterized by minimal bandwidth usage as well as a high degree of detail, and is especially suitable for high traffic networks.
Diagnose network issues by continuously tracking bandwidth utilization on your routers and switches, as well as your entire IT infrastructure. Show flow-based traffic data filtered by IP address, port, and application, and other key metrics in real time. Visualize monitoring data in clear graphs and dashboards to identify problems more easily. Gain the overview you need to troubleshoot issues with the performance of your network.

Device tree view of the complete monitoring setup

Custom PRTG dashboard for keeping an eye on the entire IT infrastructure

Live traffic data graph in PRTG
“All-around winning
network monitor”
“The real beauty of PRTG is the endless possibilities it offers”
“PRTG Network Monitor
is very hard to beat”
During bandwidth monitoring via the jFlow protocol, the router or switch collects data packets and groups them to flows. This information about the flows is sent to PRTG via UDP.
You can sort the flow automatically by traffic type (mail, FTP, or WWW) and use it for statistical processing and visualization. This allows you to immediately see which applications and devices use your bandwidth within your network.
You can also minimize your bandwidth and CPU usage by turning on sampling (if your router supports it) so only every n-th data packet is sent to PRTG.
You detect the originators of the data traffic within your network sorted by sender/target IP, sender/target port, IP protocol, and service type.
The visual presentation of the monitoring data in so-called toplists provides additional optimal analysis conditions. PRTG will immediately alert you to sudden increases of bandwidth usage of a certain network address or application.
PRTG comes with more than 250 native sensor types for monitoring your entire on-premises, cloud, and hybrid cloud environment out of the box. Check out some examples below!
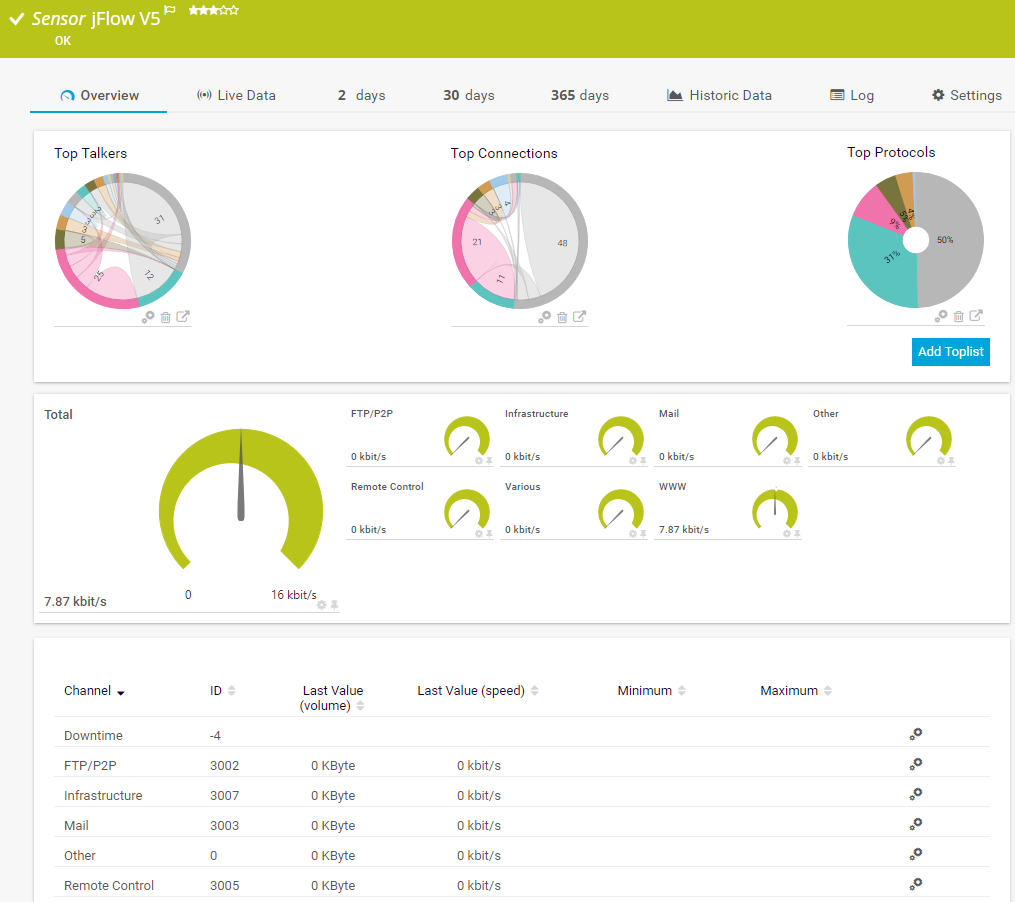
The jFlow v5 sensor receives traffic data from a jFlow v5-compatible device and shows the traffic by type. It can show the following and more:
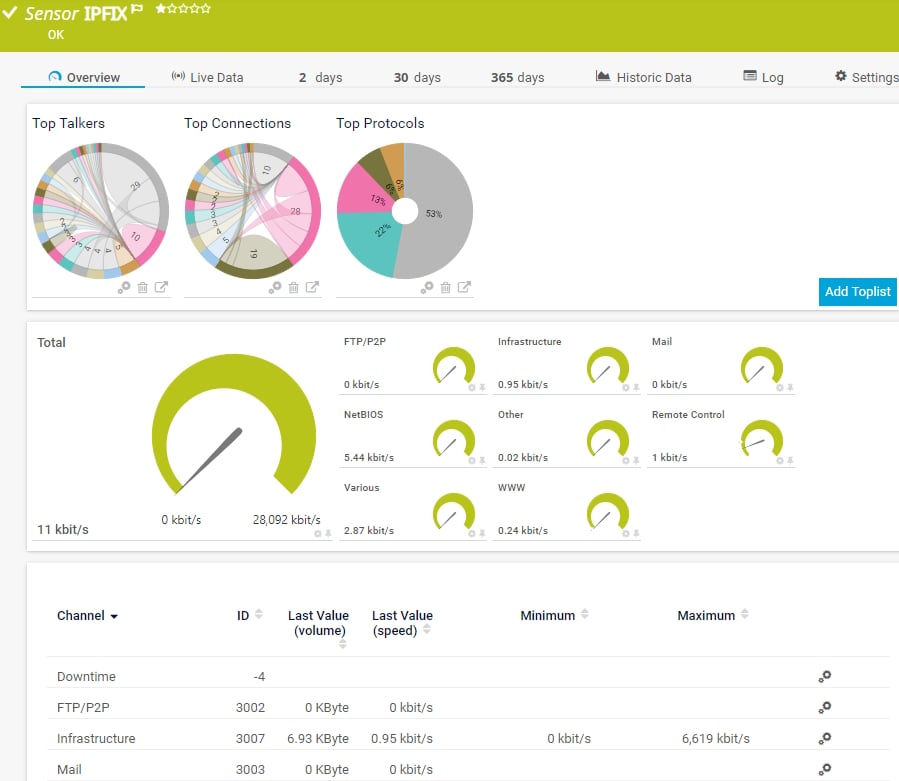
The IPFIX sensor receives traffic data from an Internet Protocol Flow Information Export (IPFIX) compatible device and shows traffic by type. It can show the following and more:
The SNMP Traffic v2 sensor monitors bandwidth and traffic on a device. It can show the following:
See the PRTG Manual for a list of all available sensor types.

Custom alerts and data visualization let you quickly identify and prevent network overload and potential bottlenecks.
PRTG is set up in a matter of minutes and can be used on a wide variety of mobile devices.


“Excellent tool for detailed monitoring. Alarms and notifications work greatly. Equipment addition is straight forward and server initial setup is very easy. ...feel safe to purchase it if you intend to monitor a large networking landscape.”
Partnering with innovative IT vendors, Paessler unleashes synergies to create
new and additional benefits for joined customers.
Paessler and Plixer provide a complete solution adding flow and metadata analysis to a powerful network monitoring tool.
IT that works constitutes a business-critical basis for a company's success. Availability and security must be defined for the respective purpose and closely monitored – by OT and IT alike.
Siemon and Paessler bring together intelligent building technology and advanced monitoring and make your vision of intelligent buildings and data centers become reality.
Real-time notifications mean faster troubleshooting so that you can act before more serious issues occur.
Network Monitoring Software – Version 25.3.110.1313 (August 27, 2025)
Download for Windows and cloud-based version PRTG Hosted Monitor available
English, German, Spanish, French, Portuguese, Dutch, Russian, Japanese, and Simplified Chinese
Network devices, bandwidth, servers, applications, virtual environments, remote systems, IoT, and more
Choose the PRTG Network Monitor subscription that's best for you


jFlow is a flow monitoring protocol developed by Juniper Networks. It is used to collect and analyze network traffic by monitoring flows passing through a network device, such as a router or switch. A "flow" refers to a series of packets with shared attributes, such as source/destination IPs, port numbers, and protocol types. Features include:
The primary difference between jFlow, sFlow, and NetFlow lies in their origins, implementation methods, and the way they collect and analyze network flow data.
NetFlow and jFlow work by capturing full flow data for traffic flows (e.g., source/destination IPs, ports, protocols). They are typically not sample-based, meaning they can provide detailed insights but may consume more resources. sFlow uses statistical sampling, capturing only a fraction of the packets or flows. This means it provides less detailed but resource-efficient insights, making it scalable for high-speed networks.
jFlow monitoring refers to the process of observing and analyzing network traffic using the jFlow protocol, which is Juniper Networks' flow monitoring technology. It allows network administrators to gain insights into network activity by collecting and analyzing data about the flows of packets passing through Juniper devices such as routers and switches.
Flow collectors and analysis tools like PRTG analyze the data to generate reports and visualizations, providing insights into traffic patterns, bandwidth usage, application performance, and potential security threats.
PRTG collects and shows the following data when using jFlow for monitoring:
In PRTG, “sensors” are the basic monitoring elements. One sensor usually monitors one measured value in your network, for example the traffic of a switch port, the CPU load of a server, or the free space on a disk drive. On average, you need about 5-10 sensors per device or one sensor per switch port.
Paessler conducted trials in over 600 IT departments worldwide to tune its network monitoring software closer to the needs of sysadmins. The result of the survey: over 95% of the participants would recommend PRTG – or already have.

Paessler PRTG is used by companies of all sizes. Sysadmins love PRTG because it makes their job a whole lot easier.
Bandwidth, servers, virtual environments, websites, VoIP services – PRTG keeps an eye on your entire network.
Everyone has different monitoring needs. That’s why we let you try PRTG for free.