Custom alerts and data visualization let you quickly identify and prevent business-critical network issues.
Network traffic management with Paessler PRTG uses network monitoring tools and in-depth bandwidth monitoring and network traffic analysis to ensure the continuous optimization of your network operations. Maximize the performance and security of existing networks, and identify network-intensive activities that can be incorporated into network planning and growth strategies.
Monitor network devices such as routers, switches, or firewalls that are not configured properly, as well as application performance, which can quickly compromise your entire network.
This usually results in slow data transmission or network resources being no longer accessible. PRTG helps prevent downtime and enhance end-user experience.
Prevent poor network performance, which not only affects data traffic within a network, but also the access to resources on the Internet.
In fact, this can cause cloud-based applications to react very slowly or to be no longer accessible. Use PRTG to ensure uninterrupted Internet access and maximum productivity.
Avoid problems in the local network of your company – and possibly remote locations linked through your WAN which can also be impacted.
It helps you avoid loss of access to centrally stored data or databases and collaboration platforms. This helps ensure the smooth workflow of employees who work on the road or in their home office.
Diagnose network issues by continuously tracking traffic flows in your IT infrastructure. Show bandwidth usage, latency, VoIP and quality of service (QoS) stats, unusual traffic patterns, and other key metrics in real time. Visualize monitoring data in clear graphs and dashboards to identify problems more easily. Gain the overview you need to troubleshoot network congestion and other performance issues.

Device tree view of the complete monitoring setup

Custom PRTG dashboard for keeping an eye on the entire IT infrastructure

Live traffic data graph in PRTG
“All-around winning
network monitor”
“The real beauty of PRTG is the endless possibilities it offers”
“PRTG Network Monitor
is very hard to beat”
By monitoring your network and its individual devices, you can quickly get an overview of the data traffic and also analyze it in more detail, as required.
Break traffic down, for example, by IP address, port, and protocol to get the insights you need. To do so, PRTG uses common technologies such as SNMP, flow (NetFlow, jFlow, sFlow, IPFIX), or packet sniffing.
PRTG also provides you with reports according to your needs. This allows you to view and analyze your network traffic over a longer period of time.
This is especially helpful when there is a high volume of data traffic outside of working hours that would otherwise have gone unnoticed.
PRTG helps you make better, more informed decisions with data generated by the sensors and analyzed reports.
For example, if increased traffic occurs at certain times, you can now define the cause and take appropriate action. This also empowers you to make better long-term resource planning decisions.
PRTG comes with more than 250 native sensor types for monitoring your entire on-premises, cloud, and hybrid cloud environment out of the box. Check out some examples below!
The SNMP Traffic v2 sensor monitors bandwidth and traffic on a device. It can show the following:
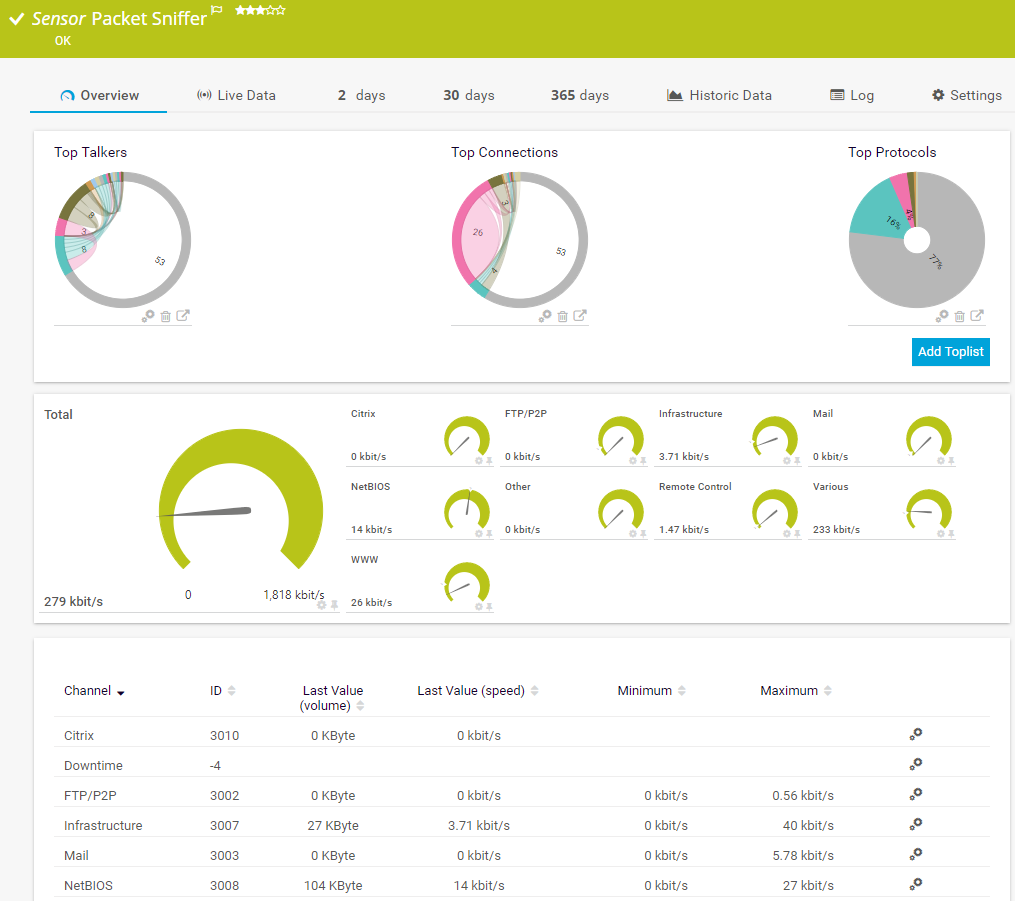
The Packet Sniffer sensor monitors the headers of data packets that pass a local network card using a built-in packet sniffer. You can choose from predefined channels. It can show the following and more:
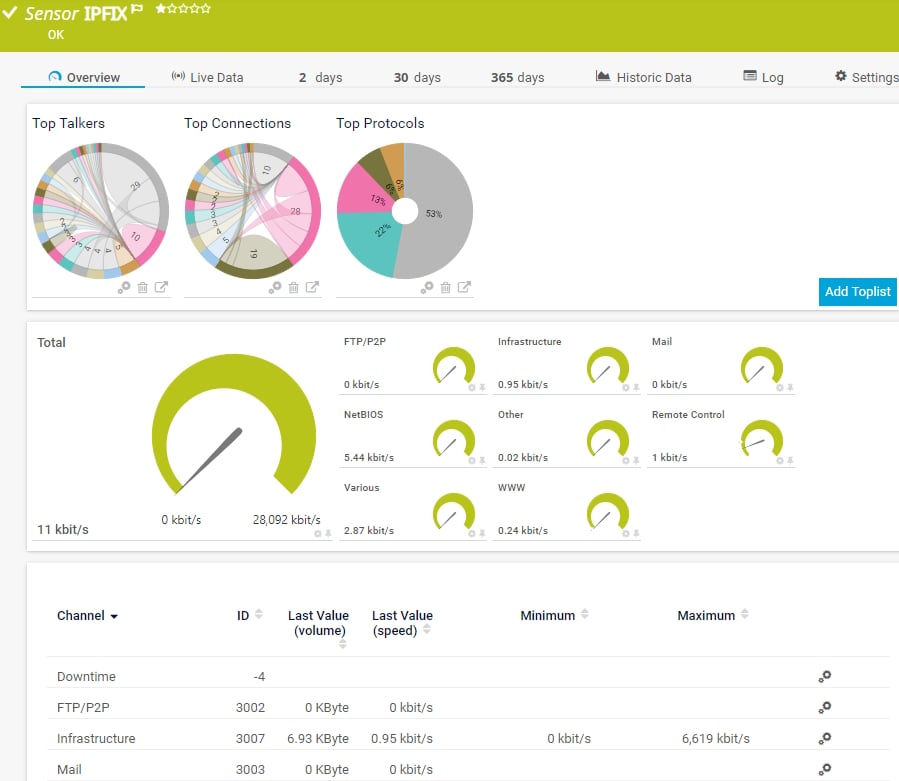
The IPFIX sensor receives traffic data from an Internet Protocol Flow Information Export (IPFIX) compatible device and shows traffic by type. It can show the following and more:
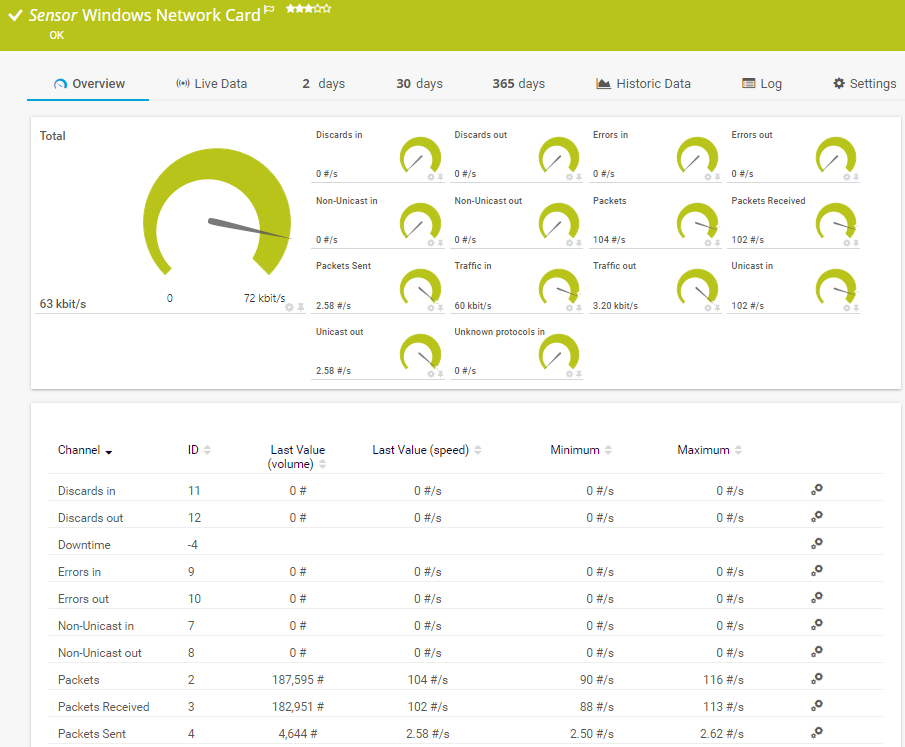
The Windows Network Card sensor monitors the bandwidth usage and traffic of a network interface via Windows Management Instrumentation (WMI) or Windows performance counters. It can show the following:
See the PRTG Manual for a list of all available sensor types.
Real-time notifications mean faster troubleshooting so that you can act before more serious issues occur.

PRTG not only informs you about traffic spikes and bandwidth bottlenecks in your network, but also shows you unusually high network utilization. This way, you can act early to prevent crashes and costly downtime – or even a cybersecurity threat.
With PRTG, you can set up customized alerts and notifications via email, SMS, push, and other methods. You will be promptly alerted if a warning or error threshold is reached, so you can take action before real problems occur.
PRTG comes with predefined sensors for many manufacturers you can use out of the box, as well as an alarm system and technical support. If you opt for a license, you’ll get access to its full range of monitoring features for your entire IT infrastructure.
Set up PRTG in minutes and use it on almost any mobile device.


“Excellent tool for detailed monitoring. Alarms and notifications work greatly. Equipment addition is straight forward and server initial setup is very easy. ...feel safe to purchase it if you intend to monitor a large networking landscape.”
Partnering with innovative IT vendors, Paessler unleashes synergies to create
new and additional benefits for joined customers.
IT that works constitutes a business-critical basis for a company's success. Availability and security must be defined for the respective purpose and closely monitored – by OT and IT alike.
Integrating monitoring results from PRTG into NetBrain maps makes the foundation for network automation.
With ScriptRunner Paessler integrates a powerful event automation platform into PRTG Network Monitor.
Custom alerts and data visualization let you quickly identify and prevent business-critical network issues.
Network Monitoring Software – Version 25.3.110.1313 (August 27, 2025)
Download for Windows and cloud-based version PRTG Hosted Monitor available
English, German, Spanish, French, Portuguese, Dutch, Russian, Japanese, and Simplified Chinese
Network devices, bandwidth, servers, applications, virtual environments, remote systems, IoT, and more
Choose the PRTG Network Monitor subscription that's best for you


Network traffic management refers to the techniques, processes, and tools used to monitor, control, and optimize the flow of data across a network. Its goal is to ensure efficient data transmission, prevent congestion, maintain security, and provide a high quality of service (QoS) for all users and critical applications.
Key aspects of network traffic management include:
Network traffic management offers several key benefits that help improve the performance, security, and reliability of a network. These benefits are crucial for businesses, service providers, and individuals who rely on stable and efficient network connectivity.
While PRTG isn't a classic network traffic management tool, it provides comprehensive support for effective network traffic management through detailed monitoring and traffic classification. This data enables informed traffic shaping, rate limiting, and prioritization decisions.
Our network traffic management capabilities help identify bandwidth hogs, detect unusual traffic patterns, and provide the insights needed to optimize network performance across your infrastructure, ensuring critical applications receive the necessary resources.
PRTG leverages multiple protocols to support robust network traffic management, including SNMP for device monitoring and flow technologies (NetFlow v5/v9, jFlow, sFlow, IPFIX) for detailed traffic analysis. Packet sniffing capabilities complement these protocols by capturing granular data when needed. This multi-protocol approach to network traffic management ensures complete visibility into traffic patterns, application usage, and potential bottlenecks, allowing administrators to make data-driven decisions about network optimization and resource allocation.
Proper network traffic management directly impacts business productivity by ensuring critical applications receive sufficient bandwidth. When organizations implement comprehensive network traffic management, they experience fewer service disruptions, improved application response times, and enhanced user satisfaction.
Additionally, effective network traffic management provides valuable insights for capacity planning, helping IT teams anticipate future needs and budget appropriately for infrastructure upgrades, ultimately supporting business growth while controlling operational costs.
In PRTG, “sensors” are the basic monitoring elements. One sensor usually monitors one measured value in your network, for example the traffic of a switch port, the CPU load of a server, or the free space on a disk drive. On average, you need about 5-10 sensors per device or one sensor per switch port.
Paessler conducted trials in over 600 IT departments worldwide to tune its network monitoring software closer to the needs of sysadmins. The result of the survey: over 95% of the participants would recommend PRTG – or already have.

Paessler PRTG is used by companies of all sizes. Sysadmins love PRTG because it makes their job a whole lot easier.
Bandwidth, servers, virtual environments, websites, VoIP services – PRTG keeps an eye on your entire network.
Everyone has different monitoring needs. That’s why we let you try PRTG for free.