Custom alerts and data visualization let you quickly identify and prevent Linux server availability and performance issues.
It's hard to beat SSH for security.
But if your organization's network uses various Windows Server versions as well as macOS and Linux systems, and other Unix network devices – and, let's face it, that's the case in most organizations – the number of different monitoring tools you'll need to have in place can quickly reach a hair-tearing level of complexity.
The whole point of network monitoring tools is that they should make your life easier, not harder. Which is why we've designed Paessler PRTG to be as simple and intuitive as it gets.
Whether your devices support SSH, SNMP, or another protocol, our monitoring environment brings together all your data in one place, giving you a single, unified view of your network's health, and taking the effort out of ensuring it stays fast, stable, and reliable.
Diagnose network issues by continuously tracking FTP servers, storage area networks (SAN), and Linux network components. Show response time, disk space, system health, and other key metrics in real time. Visualize monitoring data in clear graphs and dashboards to identify problems more easily. Gain the overview you need to troubleshoot low availability, high memory load, lack of disk space, and more.
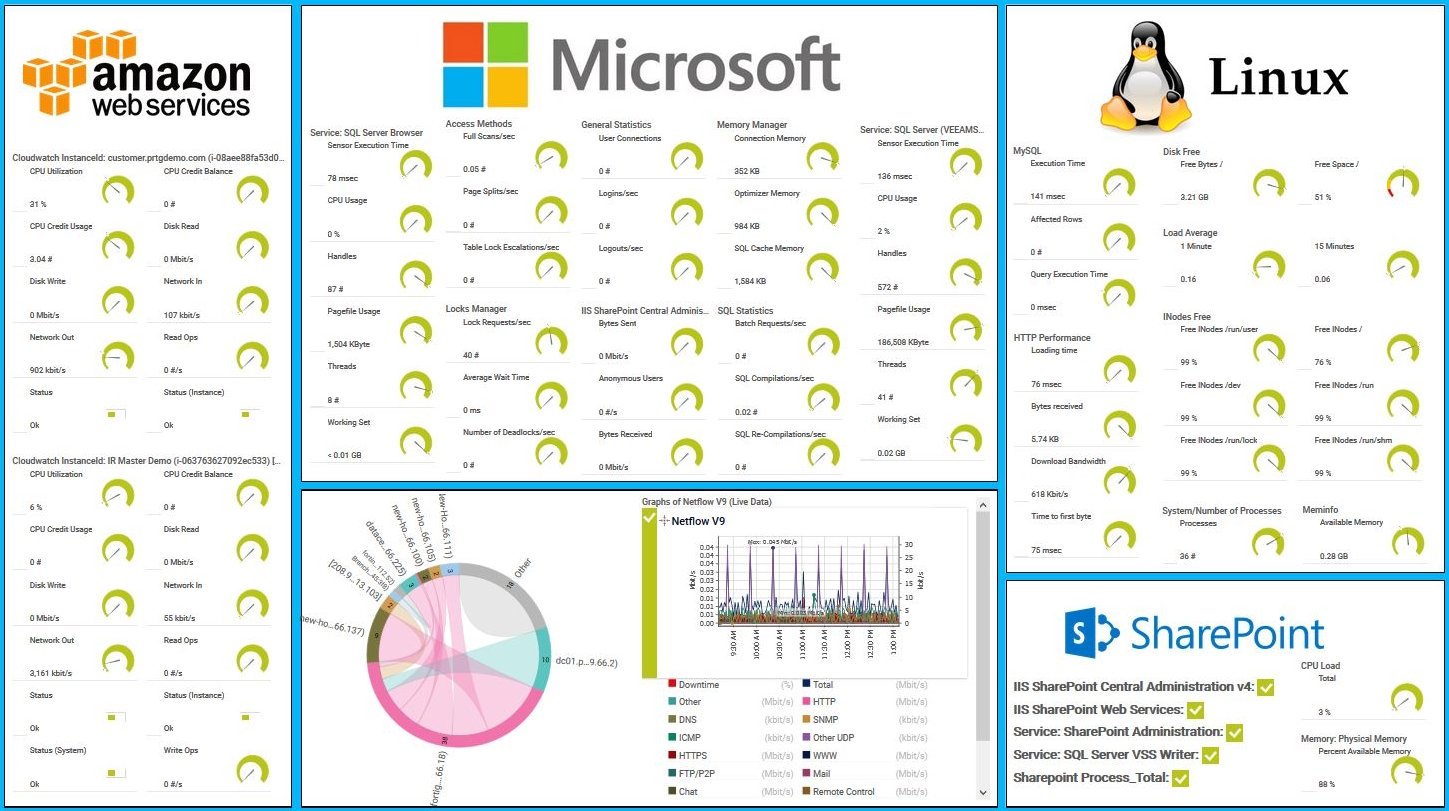
PRTG map of AWS, Linux and Windows services

Device tree view of the complete monitoring setup

Custom PRTG dashboard for keeping an eye on the entire IT infrastructure
AWS, Microsoft & Linux Map in PRTG
“All-around winning
network monitor”
“The real beauty of PRTG is the endless possibilities it offers”
“PRTG Network Monitor
is very hard to beat”
No need to fiddle about with device settings. Or, worse, install software on every device you want to monitor. Our agentless monitoring software comes with an automatic network discovery that will detect the devices, establish your SSH connection, and even set up the appropriate sensors for you.
Availability. Performance. Operating system status. Memory. Server load. With a range of SSH-native sensors and the ability to create your own, PRTG can track every variable you can think of, and present the data in a format anyone can understand.
Zoom in on problems promptly, before they spiral out of control. Once you pick your preferred thresholds, PRTG watches them like a hawk and alerts you using customizable notification templates if your device risks going under or over. Which means fewer disruptions and a shorter to-do list.
Keep track of important health stats, without putting your organization at risk. PRTG's SSH sensors support all major encryption algorithms and authentication cyphers, so unauthorized individuals won't be able to make sense of your data, even if they manage to intercept it.
PRTG comes with more than 250 native sensor types for monitoring your entire on-premises, cloud, and hybrid cloud environment out of the box. Check out some examples below!
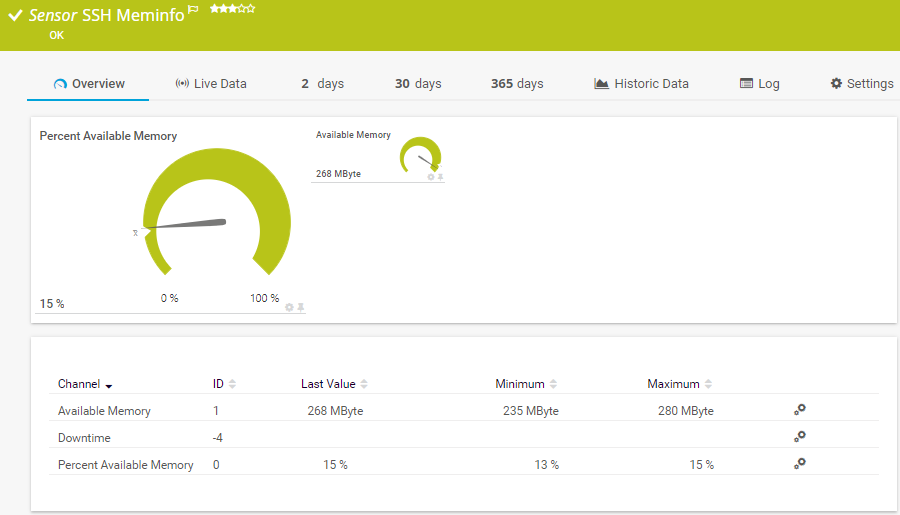
The SSH Meminfo sensor monitors the memory usage of a Linux/Unix system using Secure Shell (SSH). It can show the following:
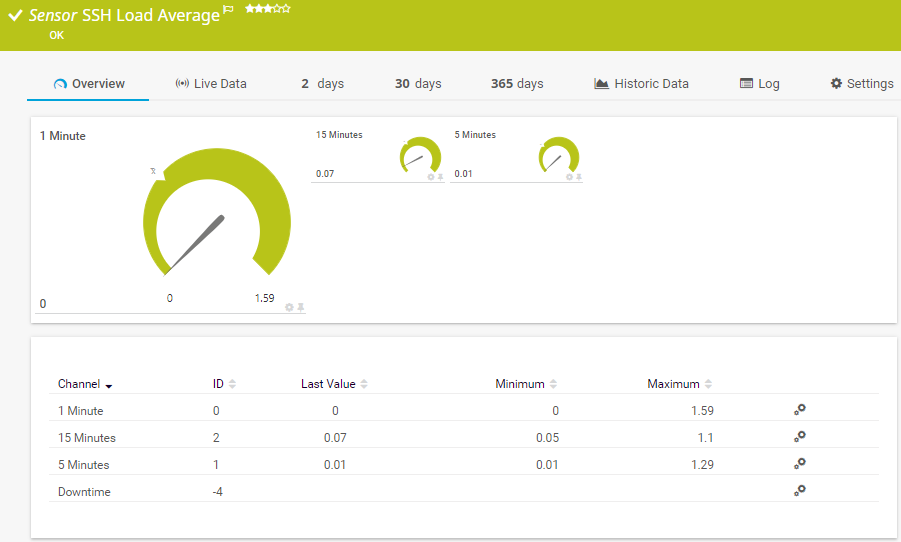
The SSH Load Average sensor monitors the load average of a Linux/Unix system using Secure Shell (SSH). It can show the following:
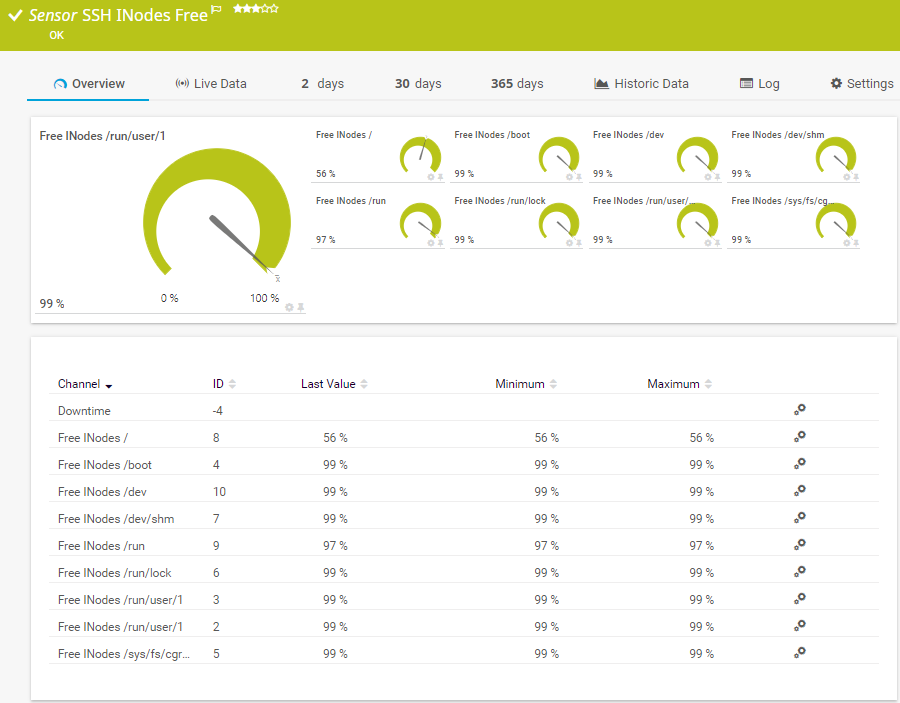
The SSH INodes Free sensor the free index nodes on disks of Linux/Unix and macOS systems via Secure Shell (SSH). It can show the following:
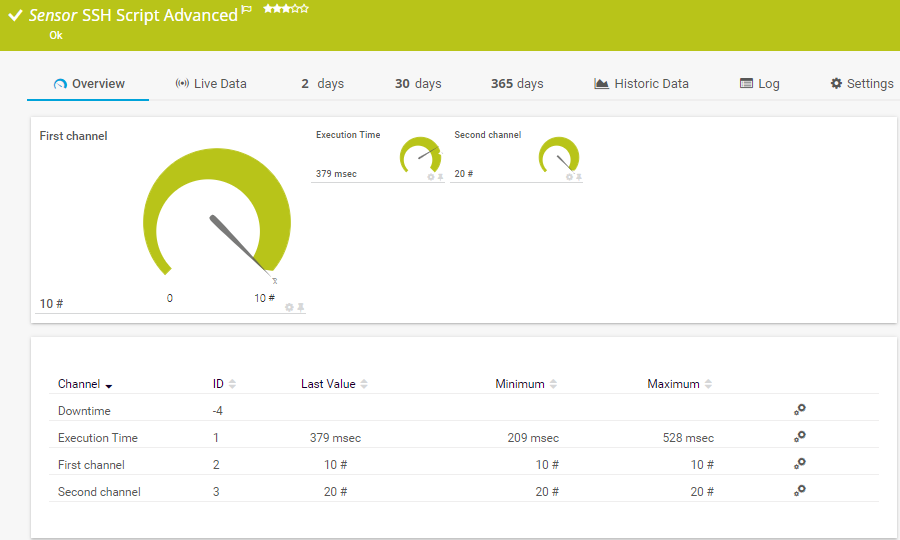
The SSH Script Advanced sensor connects to a Linux/Unix system via Secure Shell (SSH) and executes a script file that is located on the target system. This option is available as part of the PRTG API. It can show the following:
See the PRTG Manual for a list of all available sensor types.

Custom alerts and data visualization let you quickly identify and prevent Linux server availability and performance issues.
PRTG is set up in a matter of minutes and can be used on a wide variety of mobile devices.


“Excellent tool for detailed monitoring. Alarms and notifications work greatly. Equipment addition is straight forward and server initial setup is very easy. ...feel safe to purchase it if you intend to monitor a large networking landscape.”
Partnering with innovative IT vendors, Paessler unleashes synergies to create
new and additional benefits for joined customers.
Integrating monitoring results from PRTG into NetBrain maps makes the foundation for network automation.
Paessler and Plixer provide a complete solution adding flow and metadata analysis to a powerful network monitoring tool.
UVexplorer integrates tightly with PRTG to bring fast and accurate network discovery, detailed device inventory, and automatic network mapping to the PRTG platform.
Real-time notifications mean faster troubleshooting so that you can act before more serious issues occur.
Network Monitoring Software – Version 25.3.110.1313 (August 27, 2025)
Download for Windows and cloud-based version PRTG Hosted Monitor available
English, German, Spanish, French, Portuguese, Dutch, Russian, Japanese, and Simplified Chinese
Network devices, bandwidth, servers, applications, virtual environments, remote systems, IoT, and more
Choose the PRTG Network Monitor subscription that's best for you


SSH (Secure Shell) is a protocol that creates an encrypted connection between two systems, enabling them to exchange data securely over unsecured connections.
Think of it as sending a padlocked box made of bulletproof steel through the post. While somebody might be able to get their hands on the box without permission, doing so would be useless, because the tough material and padlock mean they wouldn't be able to open it and find out what's inside.
Similarly, while somebody might be able to intercept data transferred over SSH, they wouldn't be able to make sense of it without the encryption key.
The SSH client initiates a connection to the SSH server on a specific port (default is port 22).
The SSH server responds with its public key and a list of supported encryption and hashing algorithms.
The client and server negotiate to select a mutually supported encryption, hashing, and SSH key exchange algorithm.
The client and server use the chosen key exchange algorithm (e.g., Diffie-Hellman) to securely generate a shared secret key. This key is used to encrypt the session.
The client uses the server's public key to verify the server’s identity. If the server’s public key matches a known and trusted key stored on the client, the server is authenticated.
The client must authenticate itself to the server using one or more methods such as:
Once both the server and client are authenticated, an encrypted session is established using the shared secret key.
All data sent between the client and server is encrypted, ensuring confidentiality and integrity. SSH can be used for various purposes such as remote command execution, file transfer (using SCP or SFTP), and tunneling other protocols.
SSH (Secure Shell) monitoring refers to the process of overseeing and tracking activities and connections related to SSH, a protocol used for securely accessing remote computers. Main aspects include:
PRTG can collect health and performance data and system information from any device that supports SSH access. This includes macOS, Linux, and UNIX-based hardware or software. SSH's security, encryption, and remote access and command execution capabilities also make it a good choice for monitoring storage area networks.
In PRTG's device settings, key in the login details for the system you want to monitor, ideally with root access. That's it. PRTG will connect to it and establish the connection. You can log in with a password or OpenSSH-RSA private key, and set it up so any new devices are added to your monitoring environment automatically.
PRTG supports ciphers, MACs, key exchange algorithms, and host key algorithms. Here's a list of the specific values we support.
In PRTG, “sensors” are the basic monitoring elements. One sensor usually monitors one measured value in your network, for example the traffic of a switch port, the CPU load of a server, or the free space on a disk drive. On average, you need about 5-10 sensors per device or one sensor per switch port.
Paessler conducted trials in over 600 IT departments worldwide to tune its network monitoring software closer to the needs of sysadmins. The result of the survey: over 95% of the participants would recommend PRTG – or already have.

Paessler PRTG is used by companies of all sizes. Sysadmins love PRTG because it makes their job a whole lot easier.
Bandwidth, servers, virtual environments, websites, VoIP services – PRTG keeps an eye on your entire network.
Everyone has different monitoring needs. That’s why we let you try PRTG for free.