• Company
    • About Us
    • Case Studies
    • Press Center
    • Events
    • Careers
    • Blog
    • Contact us
  • Login
 
  • English
    • Deutsch
    • Español
    • Français
    • Italiano
    • Português
Paessler
                    - The Monitoring Experts
  • Products
    • Paessler PRTG
      Paessler PRTGMonitor your whole IT infrastructure
      • PRTG Network Monitor
      • PRTG Enterprise Monitor
      • PRTG Hosted Monitor
      • PRTG extensionsExtensions for Paessler PRTGExtend your monitoring to a new level
    • Icon Features
      FeaturesExplore all monitoring features
      • Maps & dashboards
      • Alerts & notifications
      • Multiple user interfaces
      • Distributed monitoring
      • Customizable reporting
  • Solutions
    • Industries
      IndustriesMonitor various industry sectors
      • Industrial
      • Healthcare
      • Data Center
      • Education
      • Finance
      • Government
    • IT Topics
      IT TopicsMonitor all areas of IT
      • Network Monitoring
      • Bandwidth Monitoring
      • SNMP Monitor
      • Network Mapping
      • WiFi Monitoring
      • Server Monitoring
  • Pricing
  • Resources
    • Getting Started
      Getting StartedModules for self-paced learning
    • How-to Guides
      How-to GuidesGet the most out of PRTG
    • Videos & Webinars
      Videos & WebinarsLearn from Paessler experts
    • IT  Knowledge
      IT KnowledgeExpand your IT knowledge
    • PRTG Manual
      PRTG ManualFull documentation
    • Knowledge Base
      Knowledge BaseShare community knowledge
    • PRTG Sensor Hub
      PRTG Sensor HubGet sensors, scripts & templates
    • Trainings
      PRTG TrainingLearn how to work with PRTG
  • Partners
    • icon star
      New Partners and MSPBecome a new partner or MSP
    • icon partner
      Partner PortalLog in to your partner account
    • icon search
      Find a PartnerFind partners selling Paessler products
    • icon technology
      Technology AlliancesSee Paessler technology partnerships
  • Company
    • About Us
    • Case Studies
    • Press Center
    • Events
    • Careers
    • Blog
    • Contact us
  • Login
  • English
    • Deutsch
    • Español
    • Français
    • Italiano
    • Português
  • Get a quote
  • Free trial
  1. Home>
  2. IT Topics>
  3. Hardware>
  4. Endpoint Monitoring Tool
PRTG Logo

Endpoint Monitoring with PRTG

Keep an eye on your endpoint data to enhance security and performance

  • Detect potential issues before they become major disruptions
  • Set up alerts that fit the specific needs of your IT environment
  • Get a clear picture of all your endpoint devices with easy-to-use dashboards
Free download
product overview

Our users give top ratings for monitoring with Paessler PRTG

Gartner peer insights
spiceworks
Capterra
G2
Trustpilot

PRTG endpoint monitoring: What you will find on this page

Table of content
  • Why endpoint monitoring with PRTG is important
  • 3 reasons why to choose PRTG as your endpoint monitoring tool
  • What endpoint monitoring looks like in PRTG
  • PRTG’s endpoint monitoring system in action
  • Preconfigured PRTG sensors for endpoint monitoring
  • Endpoint monitoring: FAQ

PRTG makes endpoint monitoring as easy as it gets

Custom alerts and data visualization let you quickly identify and prevent bandwidth bottlenecks and security risks.

Free download
PRODUCT OVERVIEW

Why endpoint monitoring with PRTG is important 

Endpoint monitoring is all about keeping an eye on the performance and security of connected devices, such as laptops, smartphones, mobile devices, and IoT systems.

With a growing number of hybrid and remote workplaces, vulnerabilities are increasing, too, and effective endpoint monitoring is more important than ever if you want to keep smooth operations and security.

Paessler PRTG is a great endpoint monitoring solution for this. It tracks important metrics like CPU usage, memory, and network traffic, preventing small issues from becoming bigger problems. And it supports multiple operating systems, including Microsoft Windows and Linux, so you’ve got complete coverage.

Table of content

3 reasons why to choose PRTG as your endpoint monitoring tool

Endpoint failures can cause significant downtime, which lead to security threats and loss of productivity. With employees handling sensitive data over unsecured networks, there are even more security vulnerabilities. PRTG’s proactive endpoint monitoring ensures that emerging threats are detected early, preventing large-scale network disruptions.

sensors

Predefined or custom sensors

PRTG provides your IT team with preconfigured sensors to keep an eye on key metrics like CPU usage, network traffic, and memory.

Or you build your own sensors using external APIs or custom scripts. Set your preferred warning or error thresholds so you can monitor different endpoint environments the way you need, no matter the hardware, applications, services, or processes; on-premises, virtualized, or in the cloud.

security

Enhanced security posture

PRTG works hand-in-hand with your current cybersecurity tools, spotting vulnerabilities, unauthorized access, and malware. It uses anomaly detection algorithms to keep an eye on unusual traffic patterns, giving you a strong, multi-layered defense for endpoint protection.

This layered approach means that even sophisticated cyberattacks are dealt with quickly, keeping the network safe.

reporting

Comprehensive reporting

Create automated reports that give you a good understanding of performance and endpoint security. IT teams can adapt these reports to make managing endpoints more efficient, analyze historical data, and meet compliance requirements.

PRTG’s reports are flexible enough to cater to both technical evaluations and executive summaries. You can schedule reports to be delivered to the stakeholders at the right time.

What endpoint monitoring looks like in PRTG

Diagnose network issues by continuously tracking the availability, health, and performance of IT assets, network devices, and other endpoints. Show disk space, memory consumption, data traffic, bandwidth utilization, and other key metrics in real time. Visualize monitoring data in clear graphs and dashboards to identify problems more easily. Gain the overview you need to troubleshoot hardware health issues and system inefficiencies.

PRTG Screenshot device tree view

Device tree view of the complete monitoring setup

PRTG screenshot map entire it infrastructure

Custom PRTG dashboard for keeping an eye on the entire IT infrastructure

PRTG screenshot graph live data traffic

Live traffic data graph in PRTG

Start monitoring endpoints with PRTG and see how it can make your network more reliable and your job easier.

Free download
PRODUCT OVERVIEW

IT experts agree: Paessler PRTG is a great solution for IT infrastructure monitoring

PCMag

“All-around winning
 network monitor”

IT Brief

“The real beauty of PRTG is the endless possibilities it offers”

ITPro

“PRTG Network Monitor 
is very hard to beat”

PRTG’s endpoint monitoring system in action

versatile integration

Versatile integration

PRTG monitors all kinds of endpoints, like laptops, smartphones, and IoT systems. It uses SNMP, WMI, HTTP, REST API integrations, and other technologies.

Its scalable design means you can keep an eye on large networks without any performance issues. It also works well with Microsoft Windows and other environments. This scalable approach ensures consistent performance even as the network grows.

alerts

Customizable alerts

PRTG sends you alerts based on predefined warning and error thresholds as soon as they are breached. Get notifications via email, SMS, in-app push notifications, and other methods, so you can respond quickly to any issues.

What’s more: you can also set custom thresholds to suit your network’s requirements and send automated alerts to different recipients, so you don't miss anything important.

data visualization

Data visualization

PRTG's dashboards show you real-time and historical data in graphs, heatmaps, and charts. You can use these dashboards to spot problems before they happen and share them with other teams so everyone's on the same page.

Focus on the data that matters most by easily creating your own dashboards via drag and drop, so you can make decisions quickly.

Explore our preconfigured PRTG sensors for endpoint monitoring

PRTG comes with more than 250 native sensor types for monitoring your entire on-premises, cloud, and hybrid cloud environment out of the box. Check out some examples below!

REST Custom v2

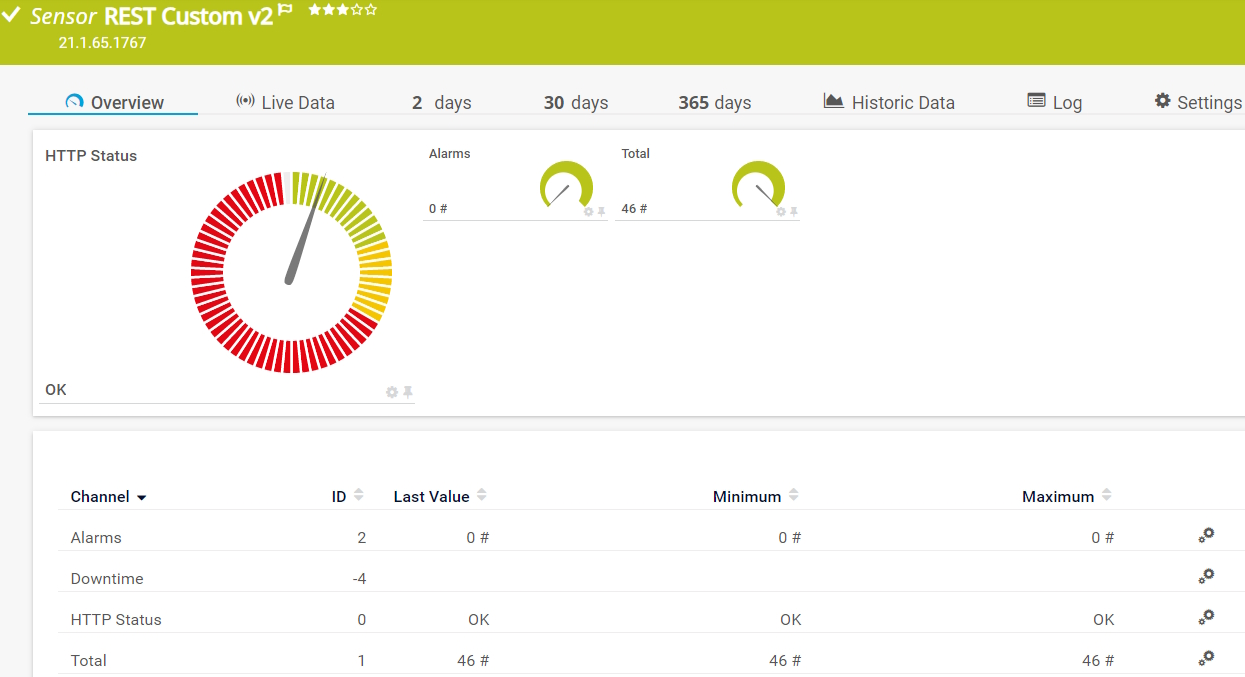
The REST Custom v2 sensor queries a REST API endpoint and maps the JSON or XML result to sensor values. It can show the following:

  • HTTP status that the requested URL returns
  • Values that the REST API returns in several channels
REST Custom v2
REST Custom v2

VMware Virtual Machine (SOAP)

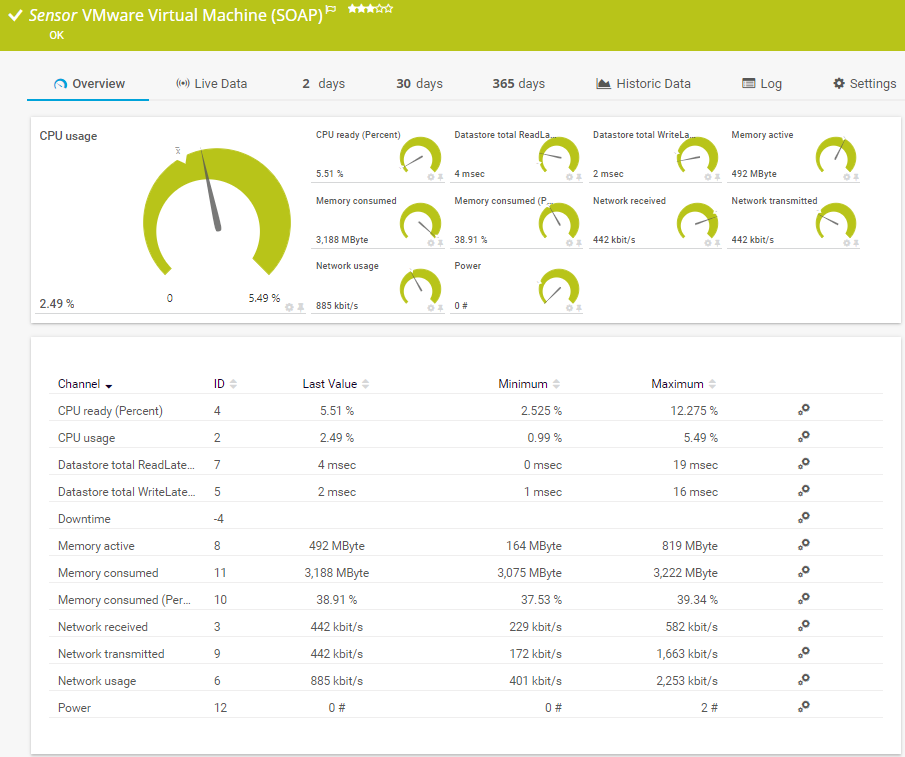
The VMware Virtual Machine (SOAP) sensor monitors a virtual machine (VM) on a VMware host server using the Simple Object Access Protocol (SOAP). It can show the following and more:

CPU readiness and usage

  • Datastore total read and write latency
  • Disk usage and read and write speed
  • Active and consumed memory
  • Received and transmitted bytes
VMware Virtual Machine (SOAP)

SNMP Printer

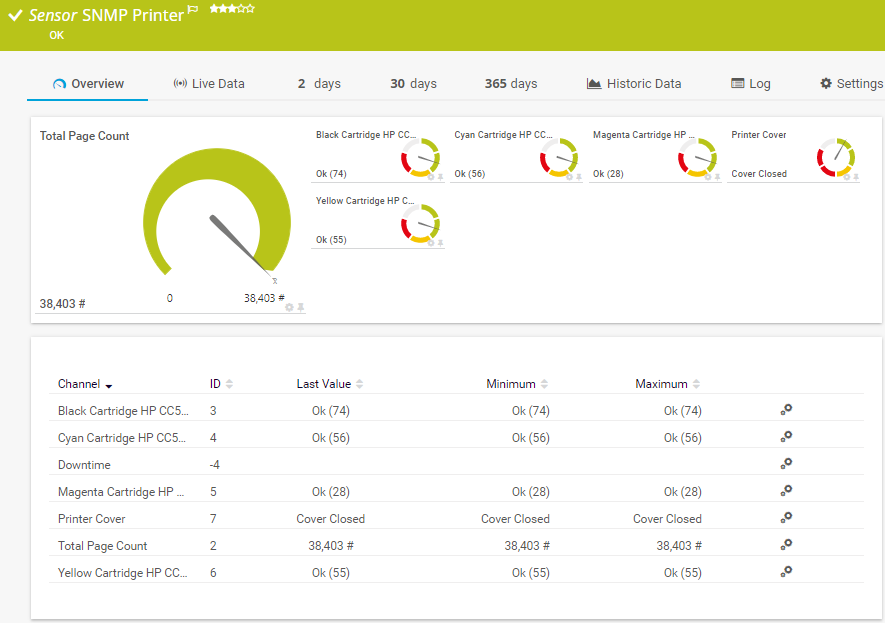
The SNMP Printer sensor monitors various types of printers. It can show the following:

  • Cartridges fill levels
  • Printer cover status
  • Total number of printed pages
SNMP Printer
SNMP Printer

Microsoft SQL v2

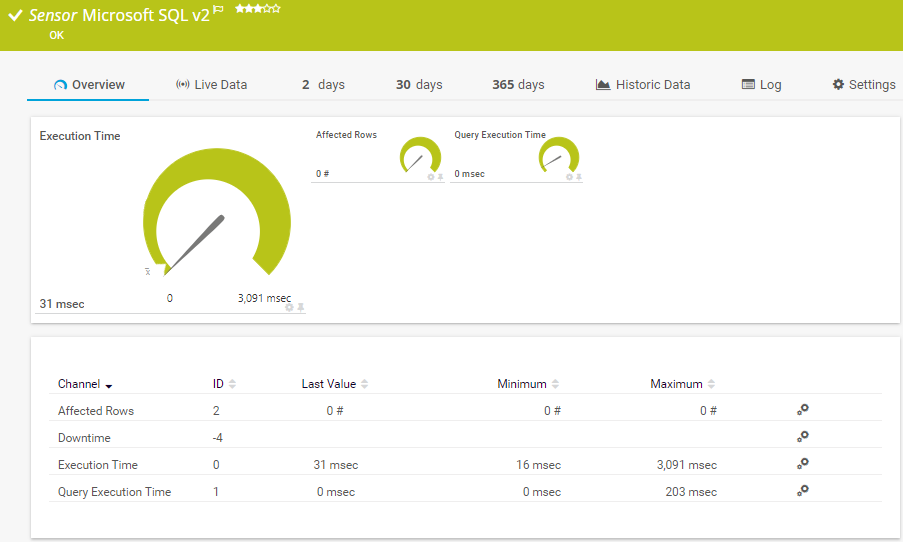
The Microsoft SQL v2 sensor monitors a database on a Microsoft SQL server and executes a query. It can show the following:

  • Number of rows addressed by the query
  • Execution time of the entire request
  • Execution time of the specified query
Microsoft SQL v2
Microsoft SQL v2

See the PRTG Manual for a list of all available sensor types.

PRTG is compatible with all major vendors, products, and systems

compatible with all major vendors, products, and systems

PRTG makes endpoint monitoring as easy as it gets

Custom alerts and data visualization let you quickly identify and prevent bandwidth bottlenecks and security risks.

Free download
PRODUCT OVERVIEW

“From a server perspective, we're monitoring all of the key components of our service such as CPU usage, RAM disk space, the Windows services that it's running, and network connectivity of that server. In terms of networks, we’re monitoring all of our switches, firewalls, and access points. It’s really useful to be able to easily pull performance metrics from the PRTG dashboard.”

Ollie Kerslake, Infrastructure Lead
Riverford Organic Farmers

“The tool has given us greater control over all types of devices connected to the network (switches, IP telephony, security cameras, IoT, WiFi) that previously remained opaque when dealing with service incidents. This has improved our ability to diagnose and resolve problems, which has translated into greater efficiency and a better user experience in both internal and public services.”

Jordi Tolosà Bel, New Technologies Technician
Vinaroz City Council

“Our objective was to be able to monitor the health of our most critical servers containing data and applications, but also the flows and bandwidth between headquarters, our 50 servers in the cloud and the 15 servers at our production sites. For us, it is essential to have a proactive approach to understand where the weaknesses of the IT system are to be able to improve them.”

Marc Boullier, CIO
Carambar & Co

Your endpoint monitor at a glance – even on the go

PRTG is set up in a matter of minutes and can be used on a wide variety of mobile devices.

device overview

Create innovative solutions with Paessler’s IT partners

Partnering with innovative IT vendors, Paessler unleashes synergies to create
new and additional benefits for joined customers.

baramundi

baramundi

baramundi and PRTG create a secure, reliable and powerful IT infrastructure where you have everything under control - from the traffic in your firewall to the configuration of your clients.

Read more
Rittal

Rittal

IT that works constitutes a business-critical basis for a company's success. Availability and security must be defined for the respective purpose and closely monitored – by OT and IT alike.

Read more
Wago

Wago

Paessler PRTG integrates Wago systems into the higher-level monitoring of IT, security and production systems, thus creating a central overview.

Read more

Find the root cause of the problem with our PRTG endpoint monitoring solution

Real-time notifications mean faster troubleshooting so that you can act before more serious issues occur.

Free download
PRODUCT OVERVIEW
Paessler PRTG

Paessler PRTG

Network Monitoring Software – Version 24.4.102.1351 (November 12th, 2024)

Hosting icon

Hosting

Download for Windows and cloud-based version PRTG Hosted Monitor available

Languages icon

Languages

English, German, Spanish, French, Portuguese, Dutch, Russian, Japanese, and Simplified Chinese

test

Monitor everything

Network devices, bandwidth, servers, applications, virtual environments, remote systems, IoT, and more

test

Pricing

Choose the PRTG Network Monitor subscription that's best for you

Endpoint Monitoring: FAQ


What types of endpoints does PRTG monitor?

PRTG monitors various endpoints, including laptops, desktops, smartphones, mobile devices, servers, and IoT devices. It supports legacy systems, cloud-based environments, and virtual machines, offering extensive coverage across operating systems. This versatility ensures all devices, regardless of type, are monitored efficiently.

How does PRTG enhance endpoint security?

PRTG identifies vulnerabilities by monitoring traffic patterns and detecting unauthorized access. Real-time alerts help prevent security breaches, and its integration with antivirus and external security tools enhances endpoint protection. The multi-layered security approach addresses both current and emerging threats.

Can PRTG handle remote endpoints?

Yes, PRTG offers secure remote access monitoring, enabling IT teams to manage and monitor endpoints from any location. It is ideal for hybrid or remote environments, ensuring security and performance across distributed devices.

Can PRTG help detect security incidents and support end user management?

Yes, PRTG detects real-time security incidents and helps safeguard end users by identifying threats across the network. It ensures secure device operations and enhances network protection through continuous monitoring. The system’s customizable alerts allow teams to respond to incidents before they affect users.

What is a sensor in PRTG?

In PRTG, “sensors” are the basic monitoring elements. One sensor usually monitors one measured value in your network, for example the traffic of a switch port, the CPU load of a server, or the free space on a disk drive. On average, you need about 5-10 sensors per device or one sensor per switch port.

We asked: would you recommend PRTG? Over 95% of our customers say yes!

Paessler conducted trials in over 600 IT departments worldwide to tune its network monitoring software closer to the needs of sysadmins. The result of the survey: over 95% of the participants would recommend PRTG – or already have.

recommendation

Still not convinced?

Love

More than 500,000 sysadmins love PRTG

Paessler PRTG is used by companies of all sizes. Sysadmins love PRTG because it makes their job a whole lot easier.

PRTG

Monitor your entire IT infrastructure

Bandwidth, servers, virtual environments, websites, VoIP services – PRTG keeps an eye on your entire network.

test

Try Paessler PRTG for free

Everyone has different monitoring needs. That’s why we let you try PRTG for free.

PRTG Logo

Start monitoring endpoints with PRTG and see how it can make your network more reliable and your job easier.

Free download
PRODUCT OVERVIEW

Products

  • Paessler PRTG
    Paessler PRTGMonitor your whole IT infrastructure
    • PRTG Network Monitor
    • PRTG Enterprise Monitor
    • PRTG Hosted Monitor
    • PRTG extensions
      Extensions for Paessler PRTGExtend your monitoring to a new level
  • Icon Features
    FeaturesExplore all monitoring features

Monitoring with PRTG

  • Network monitoring
  • Bandwidth monitoring
  • SNMP monitoring
  • Network mapping
  • Wi-Fi monitoring
  • Server monitoring
  • Network traffic analyzer
  • NetFlow monitoring
  • Syslog server

Useful Links

  • PRTG Manual
  • Knowledge Base
  • Customer Success Stories
  • About Paessler
  • Subscribe to newsletter
  • PRTG Support
  • PRTG Consulting

Contact

Paessler GmbH
Thurn-und-Taxis-Str. 14, 
90411 Nuremberg 
Germany

info@paessler.com

+49 911 93775-0

  • Contact us
©2025 Paessler GmbHTerms & ConditionsPrivacy PolicyImprintReport VulnerabilityDownload & InstallSitemap
404 - Page not found 404 - Page not found 404 - Page not found