• Company
    • About Us
    • Case Studies
    • Press Center
    • Events
    • Careers
    • Blog
    • Contact us
  • Contact us
  • Login
 
  • English
    • Deutsch
    • Español
    • Français
    • Italiano
    • Português
Paessler
                    - The Monitoring Experts
  • Products
    • Paessler PRTG
      Paessler PRTGMonitor your whole IT infrastructure
      • PRTG Network Monitor
      • PRTG Enterprise Monitor
      • PRTG Hosted Monitor
      • PRTG extensionsExtensions for Paessler PRTGExtend your monitoring to a new level
    • Icon Features
      FeaturesExplore all monitoring features
      • Maps & dashboards
      • Alerts & notifications
      • Multiple user interfaces
      • Distributed monitoring
      • Customizable reporting
  • Solutions
    • Industries
      IndustriesMonitor various industry sectors
      • Industrial
      • Healthcare
      • Data Center
      • Education
      • Finance
      • Government
    • IT Topics
      IT TopicsMonitor all areas of IT
      • Network Monitoring
      • Bandwidth Monitoring
      • SNMP Monitor
      • Network Mapping
      • WiFi Monitoring
      • Server Monitoring
  • Pricing
  • Resources
    • Getting Started
      Getting StartedModules for self-paced learning
    • How-to Guides
      How-to GuidesGet the most out of PRTG
    • Videos & Webinars
      Videos & WebinarsLearn from Paessler experts
    • IT  Knowledge
      IT KnowledgeExpand your IT knowledge
    • PRTG Manual
      PRTG ManualFull documentation
    • Knowledge Base
      Knowledge BaseShare community knowledge
    • PRTG Sensor Hub
      PRTG Sensor HubGet sensors, scripts & templates
    • Trainings
      PRTG TrainingLearn how to work with PRTG
  • Partners
    • icon star
      New Partners and MSPBecome a new partner or MSP
    • icon partner
      Partner PortalLog in to your partner account
    • icon search
      Find a PartnerFind partners selling Paessler products
    • icon technology
      Technology AlliancesSee Paessler technology partnerships
  • Company
    • About Us
    • Case Studies
    • Press Center
    • Events
    • Careers
    • Blog
    • Contact us
  • Contact us
  • Login
  • English
    • Deutsch
    • Español
    • Français
    • Italiano
    • Português
  • Get a quote
  • Free trial
  1. Home>
  2. IT Topics>
  3. Industrial IT>
  4. IoT Monitoring Tool
PRTG Logo

IoT Monitoring with PRTG

Ensure seamless connectivity across all IoT devices, minimizing disruptions in your network

  • Enhance operational efficiency by quickly identifying and resolving connectivity issues
  • Customize alerts to stay informed about critical metrics and prevent unexpected downtime
  • Get real-time visibility into your IoT ecosystem to ensure all devices are performing optimally
Free download
product overview

Paessler PRTG is trusted by 500,000 users worldwide

Siemens
Truma
Bosch
rexroth
SMS group

PRTG IoT monitoring: What you will find on this page

Table of content
  • Unlock the potential of IoT monitoring
  • What IoT monitoring looks like in PRTG
  • 4 reasons why PRTG is the IoT monitoring tool of your choice
  • Explore our preconfigured PRTG sensors for IoT monitoring
  • IoT monitoring: FAQ

PRTG makes IoT monitoring as easy as it gets

Custom alerts and data visualization let you quickly identify and prevent IoT performance issues.

Free download
PRODUCT OVERVIEW

Unlock the potential of IoT monitoring

Imagine a world where your IoT devices communicate seamlessly, giving you real-time insights and reducing downtime. With PRTG, you can achieve this level of connectivity and visibility, ensuring that your network runs smoothly and efficiently. Experience the power of intuitive dashboards that help you visualize complex data, making it easier to identify and resolve potential problems. When you integrate PRTG into your IoT ecosystem, you will find that managing and optimizing your network becomes a simple task. Our IoT monitoring solution allows you to take control and increase the reliability of your IoT infrastructure.

Icon insights

Real-time insights

Get real-time visibility into your IoT network so you can make informed decisions quickly. This visibility helps you prevent problems before they impact your operations. You can be confident in the accuracy and timeliness of the data you receive.

Icon alerts

Customizable alerts

Customize alerts to stay on top of critical metrics, ensuring you never miss important updates. These alerts are tailored to your needs and provide relevant information. You can act quickly to maintain optimal performance.

Icon dashboard

Intuitive dashboards

Create dashboards that simplify data visualization and help you understand complex information at a glance. Designed for ease of use, these dashboards improve your ability to monitor your network. Gain clarity and confidence in your data.

Icon reports

Comprehensive reports

Generate reports to analyze and document your network performance. These reports provide valuable insight into trends and areas for improvement. Use this information to effectively optimize your IoT strategy.

What IoT monitoring looks like in PRTG

Diagnose network issues by continuously tracking IoT device health. Show sensor data, device status, and other key metrics in real time. Visualize monitoring data in clear graphs and dashboards to identify problems more easily. Gain the overview you need to troubleshoot IoT system interruptions.

PRTG screenshot graph live data traffic

Live traffic data graph in PRTG

PRTG Screenshot device tree view

Device tree view of the complete monitoring setup

PRTG screenshot production line

Custom PRTG dashboard for keeping an eye on the production line

PRTG screenshot graph live data traffic

Live traffic data graph in PRTG

PRTG Screenshot device tree view

Device tree view of the complete monitoring setup

Start monitoring IoT devices with PRTG and see how it can make your network more reliable and your job easier.

Free download
PRODUCT OVERVIEW

An award-winning extension for Paessler PRTG to bridge IT and OT, as voted by readers

computer automation

Awarded 3rd place in the 
Software & IT category

ned innovation award

Winner in the Software & 
Computers category

4 reasons why PRTG is the IoT monitoring tool of your choice

Are you experiencing unexpected downtime and data inconsistencies in your IoT environment? These issues can disrupt your operations and cause costly delays. PRTG provides you with the tools you need to maintain smooth functionality and prevent these problems from affecting your business.

Icon subscription

Easy subscription

Enjoy a simple subscription process that gets you up and running quickly. Choose the plan that best fits your needs with no hidden fees. Start monitoring your IoT ecosystem with minimal effort.

Icon support

Reliable support

Access expert support whenever you need it to keep your monitoring setup running smoothly. Talk to knowledgeable professionals who understand your challenges. You can count on our support team to resolve issues efficiently.

Icon integration

Seamless integration

Integrate PRTG easily into your existing IoT infrastructure and enhance your current systems. Connect to various devices and platforms without complicated configurations. Achieve a unified monitoring experience across your network.

Icon customization

Flexible customization

Customize PRTG to your specific monitoring needs and preferences. Adjust settings and create custom dashboards that highlight the most important data. Configure PRTG to match your operational goals.

Explore our preconfigured PRTG sensors for IoT monitoring

PRTG comes with more than 250 native sensor types for monitoring your entire on-premises, cloud, and hybrid cloud environment out of the box. Check out some examples below!

HTTP IoT Push Data Advanced

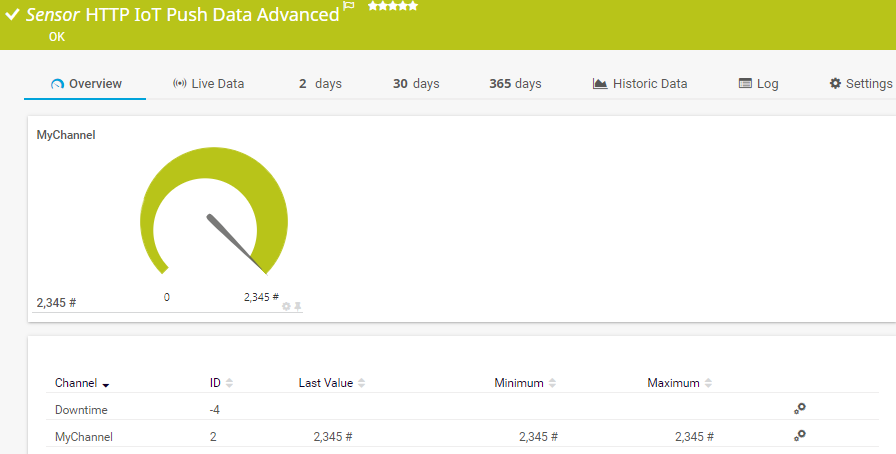
The HTTP IoT Push Data Advanced sensor displays data from messages that are received from Internet of Things (IoT) capable devices and that are pushed via an HTTPS request to PRTG. It can show the following:

  • Downtime
  • Data received from the message encoded in valid XML or JSON in several channels
HTTP IoT Push Data Advanced

MQTT Statistics

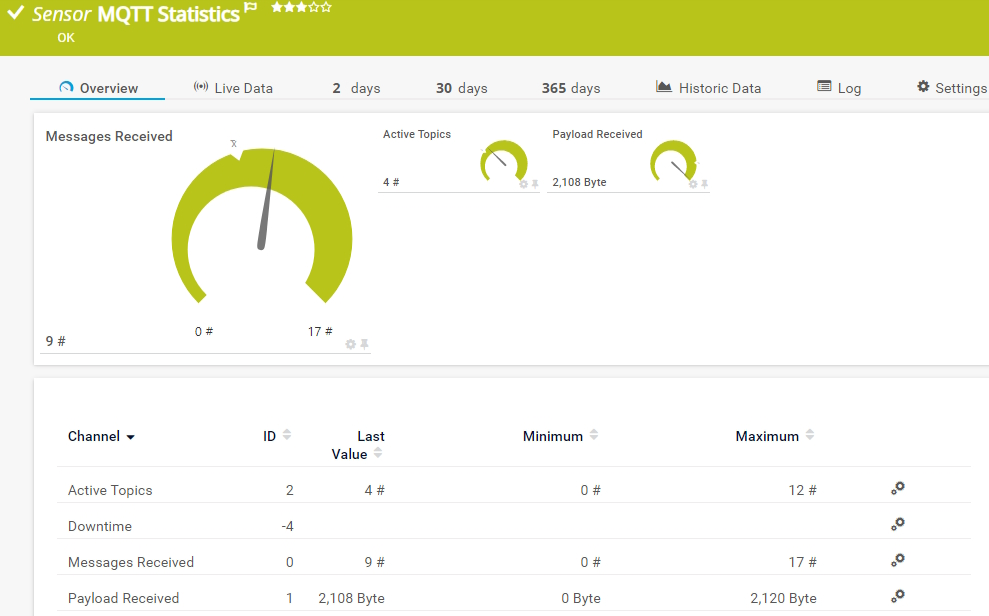
The MQTT Statistics sensor monitors a Message Queue Telemetry Transport (MQTT) topic. It can show the following:

  • Number of active MQTT topics
  • Number of messages received since the last scan
  • Payload received
MQTT Statistics
MQTT Statistics

Modbus TCP Custom

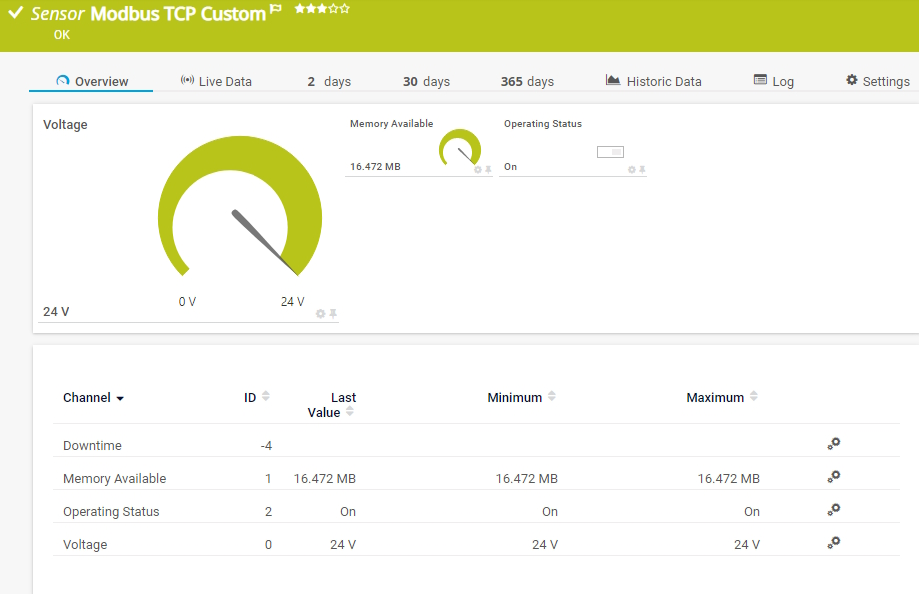
The Modbus TCP Custom sensor connects to a Modbus Transmission Control Protocol (TCP) server and monitors up to ten returned numeric values. It can show the following:

  • Downtime
  • Custom numeric values
Modbus TCP Custom
Modbus TCP Custom

OPC UA Server Status

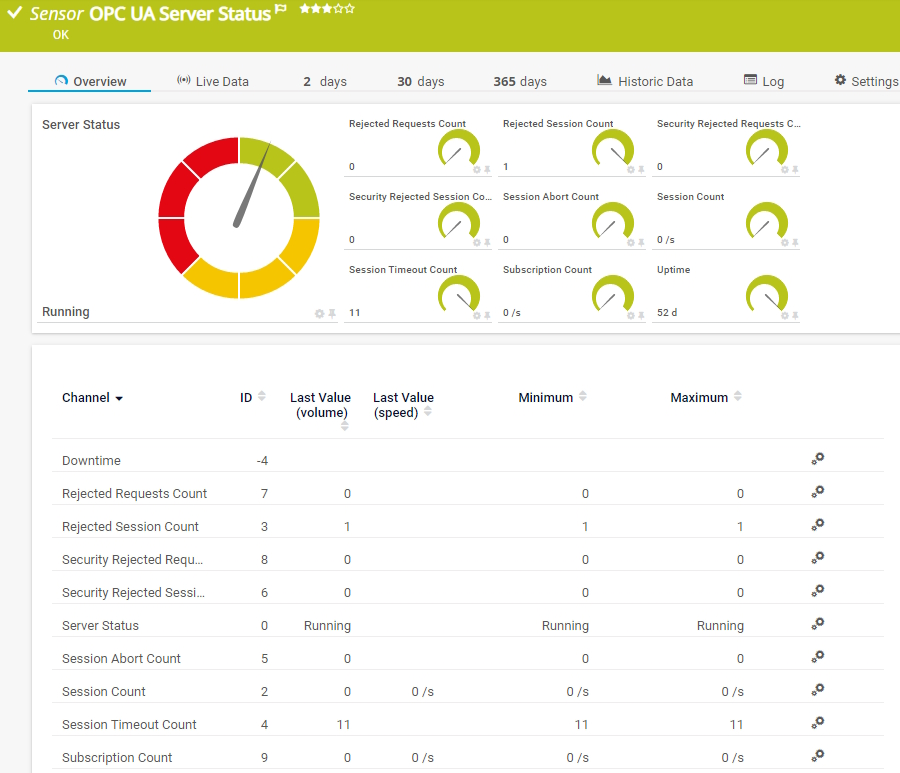
The OPC UA Server Status sensor monitors the server status, uptime, and diagnostic information of an OPC Unified Architecture (OPC UA) server. It can show the following:

  • Server status
  • Uptime
  • Number of rejected requests and sessions
  • Number of security-rejected requests and sessions
  • Number of subscriptions, sessions, session timeouts, and session aborts
OPC UA Server Status

MQTT Round Trip

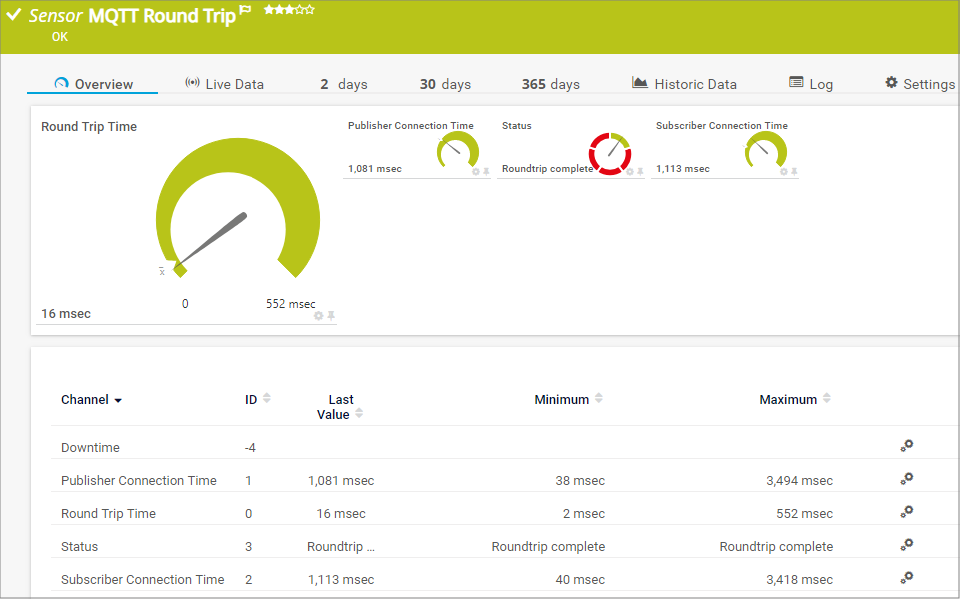
The MQTT Round Trip sensor monitors the availability of a Message Queue Telemetry Transport (MQTT) broker (server), connects to the broker as a publishing and subscribing client, and sends the data packets using a predefined topic. It can show the following:

  • Time it takes the publisher to connect
  • Time it takes the subscriber to connect
  • Round trip time (RTT) of the message (after both publisher and subscriber connected)
  • Round trip status
MQTT Round Trip
MQTT Round Trip

See the PRTG Manual for a list of all available sensor types.

PRTG is compatible with all major vendors, products, and systems

compatible with all major vendors, products, and systems

PRTG makes IoT monitoring as easy as it gets

Custom alerts and data visualization let you quickly identify and prevent IoT device connectivity issues.

Free download
PRODUCT OVERVIEW

“In the past, the enterprise and the industrial network were completely separated with very different requirements, such as security versus productivity. We see that within OT, monitoring is not widely used yet for several reasons, but processes are depending on IT systems more and more. The need for a reliable OT network is growing rapidly, and that’s where PRTG comes in.”

Pascal Vercammen, Digitalization & IT Department Manager
Process Automation Solutions

“PRTG has become an essential part of the entire plant production process, from planning to acceptance by the customer. So much so that we are currently toying with the idea of expanding our portfolio to offer support for plants, even after they are operational.”

Frank Schweisfurth
SMS group

“We have known PRTG for many years. We have selected this solution because it integrates natively into the industrial operational technology environments that we offer to our customers in the region.”

Miguel Ángel López Ávila, General Manager
SE3

“We appreciate the flexibility of PRTG and how it grows together with the company, supporting our needs to also digitalize the factory floor and monitor not only standard IT infrastructure but also factory equipment.”

Sandeep Rai, Network and Security Team Lead
Nobia AB

“In the past, the enterprise and the industrial network were completely separated with very different requirements, such as security versus productivity. We see that within OT, monitoring is not widely used yet for several reasons, but processes are depending on IT systems more and more. The need for a reliable OT network is growing rapidly, and that’s where PRTG comes in.”

Pascal Vercammen, Digitalization & IT Department Manager
Process Automation Solutions

“PRTG has become an essential part of the entire plant production process, from planning to acceptance by the customer. So much so that we are currently toying with the idea of expanding our portfolio to offer support for plants, even after they are operational.”

Frank Schweisfurth
SMS group

Your IoT monitor at a glance – even on the go

PRTG is set up in a matter of minutes and can be used on a wide variety of mobile devices.

device overview

Create innovative solutions with Paessler’s IT partners

Partnering with innovative IT vendors, Paessler unleashes synergies to create
new and additional benefits for joined customers.

Sigfox

Sigfox

Combine the functionality of Sigfox and Paessler for the most comprehensive, cost-effective, and easy-to-use IoT solution available.

Read more
INSYS icom

INSYS icom

With the combination of PRTG and Insys, the monitoring specialist Paessler and the industrial gateway manufacturer INSYS icom offer a practical possibility to merge IT and OT.

Read more
Soffico

Soffico

A combination of Orchestra and PRTG provides the ideal solution to monitor the traditional IT Infrastructure as well as the central communication server in hospitals and industrial environments.

Read more

Find the root cause of the problem with our PRTG IoT monitoring solution

Real-time notifications mean faster troubleshooting so that you can act before more serious issues occur.

Free download
PRODUCT OVERVIEW
Paessler PRTG

Paessler PRTG

Network Monitoring Software – Version 24.4.102.1351 (November 12th, 2024)

Hosting icon

Hosting

Download for Windows and cloud-based version PRTG Hosted Monitor available

Languages icon

Languages

English, German, Spanish, French, Portuguese, Dutch, Russian, Japanese, and Simplified Chinese

test

Monitor everything

Network devices, bandwidth, servers, applications, virtual environments, remote systems, IoT, and more

test

Pricing

Choose the PRTG Network Monitor subscription that's best for you

IoT Monitoring: FAQ


What is an IoT monitoring tool?

An IoT monitoring tool is a system that enables real-time tracking and management of connected devices within the Internet of Things. It provides observability across multiple devices and networks, allowing users to collect data, analyze performance metrics, and ensure the smooth operation of IoT ecosystems. These tools are critical to maintaining device health, optimizing connectivity, and improving the overall user experience.

How does PRTG work as an IoT monitoring tool?

PRTG acts as a comprehensive IoT monitoring tool by leveraging its robust API and automation capabilities. It helps you manage and monitor connected devices through intuitive dashboards and real-time alerts. PRTG supports various use cases in industries such as healthcare and manufacturing, providing end-to-end visibility into device performance and network health.

What are the main benefits of using PRTG for IoT monitoring?

PRTG offers numerous benefits for IoT monitoring, including scalability to handle large IoT networks and the ability to aggregate data from multiple sources for comprehensive insights. It supports predictive maintenance through data analysis, helping to prevent potential outages. PRTG also enables seamless integration with cloud services such as AWS IoT and Azure IoT, increasing its functionality and flexibility.

How does PRTG handle IoT data security and vulnerabilities?

PRTG ensures IoT data security by implementing robust authentication protocols and monitoring for vulnerabilities. It uses thresholds to detect anomalies and alert users to potential security threats. This proactive approach helps protect IoT networks from unauthorized access and data breaches, ensuring the integrity and confidentiality of sensitive information.

Can PRTG be used for device management in IoT ecosystems?

Yes, PRTG provides excellent device management within IoT ecosystems. It provides detailed insight into device status, firmware updates and performance metrics. Track latency, manage workflows, and optimize device operations through automated processes to guarantee efficient and reliable network performance.

How does PRTG support data processing and analytics for IoT?

PRTG supports data processing and analytics by collecting metadata from connected devices and applying machine learning algorithms to detect patterns and trends. This capability allows you to perform in-depth analysis of IoT data, enabling better decision-making and improving the overall performance of IoT systems.

What are the pricing options for PRTG as an IoT monitoring solution?

PRTG offers flexible pricing options to meet different business needs. You can choose from different licensing models, including SaaS and on-premises solutions, ensuring that you only pay for the features you need. Our pricing structure allows you to scale your monitoring capabilities as your IoT networks grow, providing cost-effective solutions for both small and large enterprises.

What is a sensor in PRTG?

In PRTG, “sensors” are the basic monitoring elements. One sensor usually monitors one measured value in your network, for example the traffic of a switch port, the CPU load of a server, or the free space on a disk drive. On average, you need about 5-10 sensors per device or one sensor per switch port.

We asked: would you recommend PRTG? Over 95% of our customers say yes!

Paessler conducted trials in over 600 IT departments worldwide to tune its network monitoring software closer to the needs of sysadmins. The result of the survey: over 95% of the participants would recommend PRTG – or already have.

recommendation

Still not convinced?

Love

More than 500,000 sysadmins love PRTG

Paessler PRTG is used by companies of all sizes. Sysadmins love PRTG because it makes their job a whole lot easier.

PRTG

Monitor your entire IT infrastructure

Bandwidth, servers, virtual environments, websites, VoIP services – PRTG keeps an eye on your entire network.

test

Try Paessler PRTG for free

Everyone has different monitoring needs. That’s why we let you try PRTG for free.

PRTG Logo

Start monitoring your IoT environment with PRTG and see how it can make your network more reliable and your job easier.

Free download
PRODUCT OVERVIEW

Products

  • Paessler PRTG
    Paessler PRTGMonitor your whole IT infrastructure
    • PRTG Network Monitor
    • PRTG Enterprise Monitor
    • PRTG Hosted Monitor
  • PRTG extensions
    Extensions for Paessler PRTGExtend your monitoring to a new level
  • Icon Features
    FeaturesExplore all monitoring features

Monitoring with PRTG

  • Network monitoring
  • Bandwidth monitoring
  • SNMP monitoring
  • Network mapping
  • Wi-Fi monitoring
  • Server monitoring
  • Network traffic analyzer
  • NetFlow monitoring
  • Syslog server

Useful Links

  • PRTG Manual
  • Knowledge Base
  • Customer Success Stories
  • About Paessler
  • Subscribe to newsletter
  • PRTG Support
  • PRTG Consulting

Contact

Paessler GmbH
Thurn-und-Taxis-Str. 14, 
90411 Nuremberg 
Germany

info@paessler.com

+49 911 93775-0

  • Contact us
©2025 Paessler GmbHTerms & ConditionsPrivacy PolicyImprintReport VulnerabilityDownload & InstallSitemap
404 - Page not found 404 - Page not found 404 - Page not found