Custom alerts and data visualization let you quickly identify and prevent bandwidth bottlenecks and protocol-related disruptions.
When you monitor network protocols effectively, you gain unprecedented insight into your entire infrastructure. With PRTG, you transform complex protocol data into actionable intelligence that helps you prevent issues before they impact your business operations.
Track every protocol flowing through your network with the comprehensive monitoring capabilities from PRTG. You can see which protocols are consuming the most bandwidth and pinpoint exactly where traffic bottlenecks are occurring. This complete visibility allows you to make data-driven network optimization decisions.
Receive alerts when protocol metrics exceed your defined thresholds or when unusual traffic patterns occur. You can customize alert conditions based on protocol type, traffic volume, or specific network segments. These timely alerts help you address issues before users even notice a problem.
Analyze traffic patterns across TCP/IP, SNMP, NetFlow, and other protocols to understand exactly how your network operates. Drill down to specific time periods to investigate anomalies or performance issues. This in-depth analysis provides the context you need for effective troubleshooting.
Create custom views that display the log metrics most relevant to your specific network environment. You can arrange multiple log monitors on a single screen for at-a-glance status checks. These customizable dashboards make complex log data accessible and meaningful.
Diagnose network issues by continuously tracking data packets, protocol distribution and traffic patterns. Show packet flows, response times and other key metrics in real time. Visualize monitoring data in clear graphs and dashboards to identify problems more easily. Gain the overview you need to troubleshoot connectivity issues and performance degradation.

Device tree view of the complete monitoring setup

Custom PRTG dashboard for keeping an eye on the entire IT infrastructure

Live traffic data graph in PRTG
“All-around winning
network monitor”
“The real beauty of PRTG is the endless possibilities it offers”
“PRTG Network Monitor
is very hard to beat”
Have you ever wondered what happens when network protocols in your infrastructure silently fail? When TCP/IP, SNMP, or NetFlow protocols fail, you face slow applications, inconsistent connectivity, or complete network outages. Without proper monitoring, these problems remain hidden until they severely impact your business operations, leaving you scrambling for solutions.
Choose the subscription model that fits your network size without overpaying for unused capacity. Scale up or down as your monitoring needs change throughout the year. Avoid the surprise costs often associated with other monitoring solutions.
Monitor all your protocols along with servers, applications, and infrastructure from a single interface without having to switch between multiple tools. Correlate protocol issues with other system metrics to quickly identify root causes. Save valuable troubleshooting time by having all relevant data in one place.
Access expert support when you encounter complex protocol monitoring challenges or need help with configuration. Benefit from comprehensive documentation, active community forums and responsive technical support. Resolve issues faster with guidance from specialists who understand both PRTG and network protocols.
Deploy protocol monitoring without installing heavy agents on each monitored device or generating excessive network traffic. Set up new sensors in minutes instead of hours with intuitive configuration wizards. Maintain monitoring performance as your network grows and becomes more complex.
PRTG comes with more than 250 native sensor types for monitoring your entire on-premises, cloud, and hybrid cloud environment out of the box. Check out some examples below!
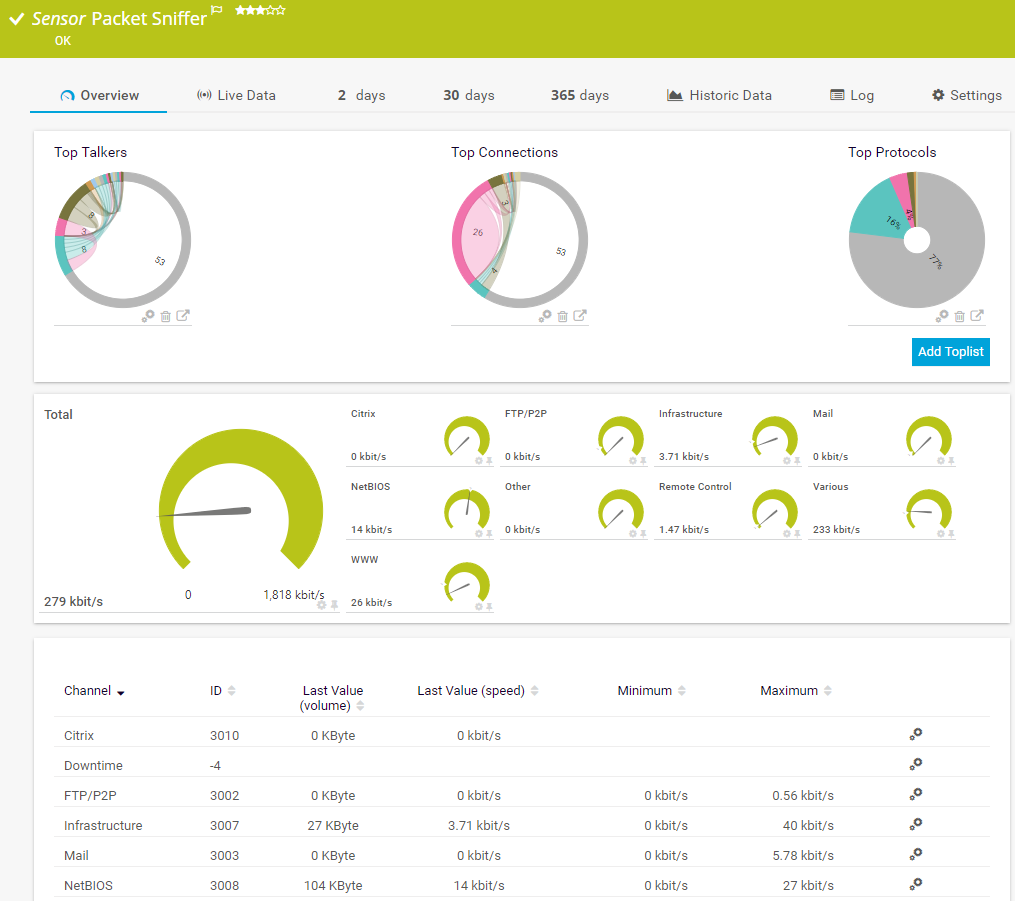
The Packet Sniffer sensor monitors the headers of data packets that pass a local network card using a built-in packet sniffer. You can choose from predefined channels. It can show the following and more:
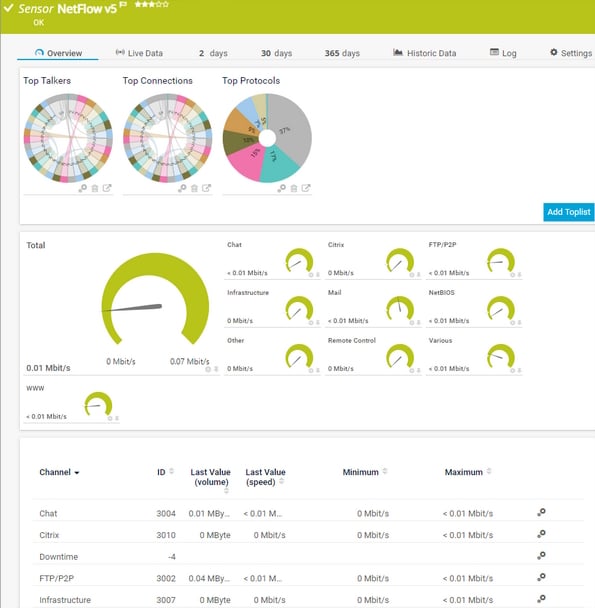
The NetFlow v5 sensor receives traffic data from a NetFlow v5-compatible device and shows the traffic by type. This sensor has several filter options to divide traffic into different channels. It can show the following and more:
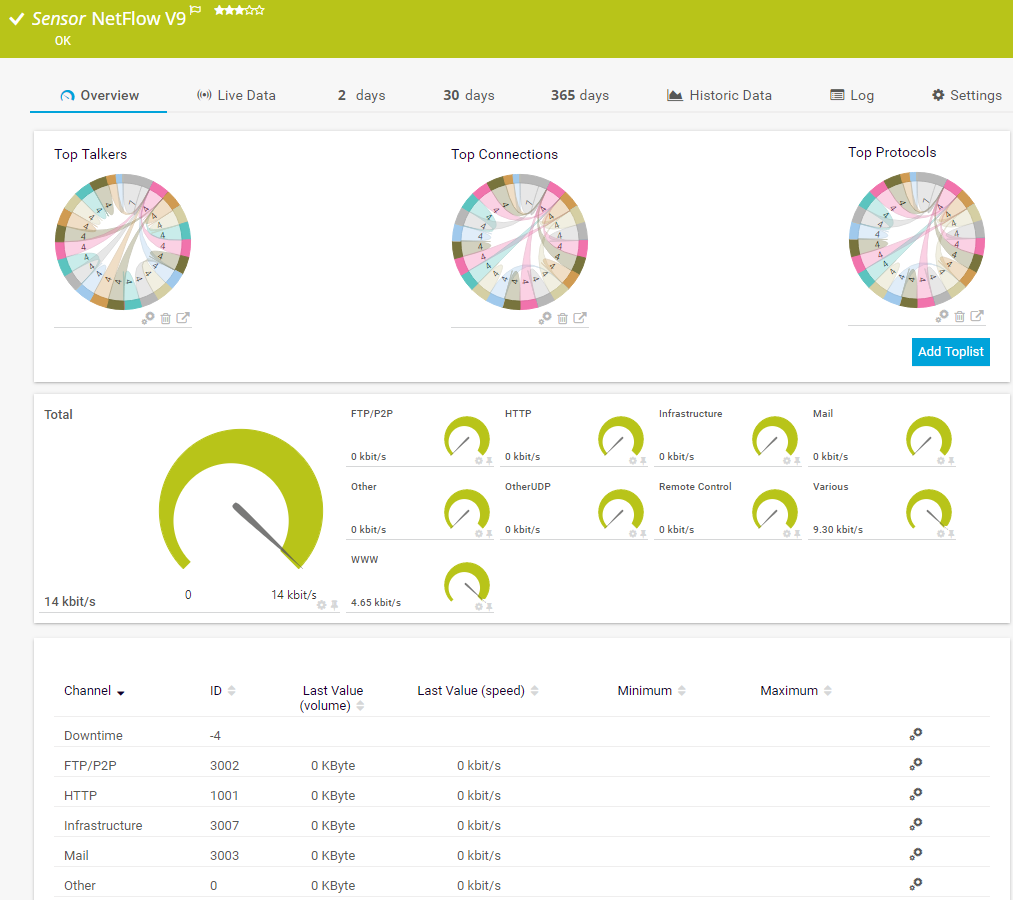
The NetFlow v9 sensor receives traffic data from a NetFlow v9-compatible device and shows the traffic by type. This sensor has several filter options to divide traffic into different channels. It can show the following and more:
The SNMP Traffic v2 sensor monitors bandwidth and traffic on a device. It can show the following:
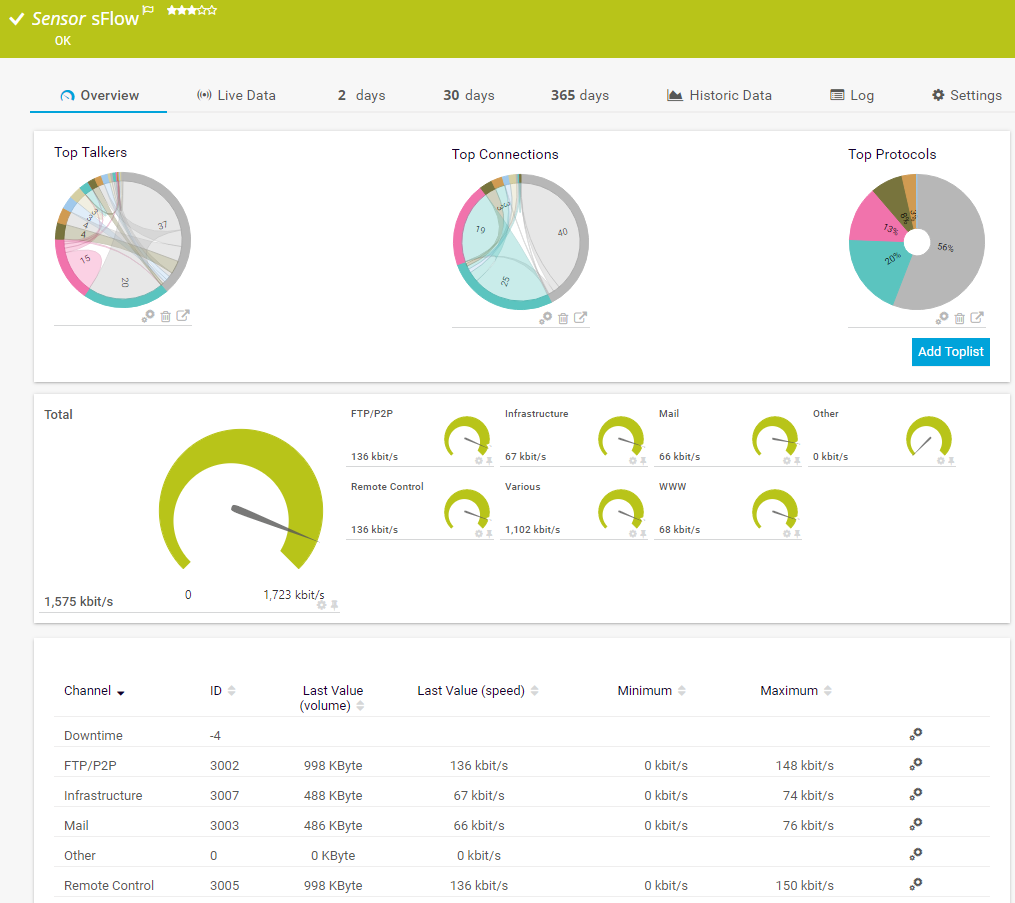
The sFlow sensor receives traffic data from an sFlow v5-compatible device and shows the traffic by type. This sensor has several filter options to divide traffic into different channels. It can show the following and more:
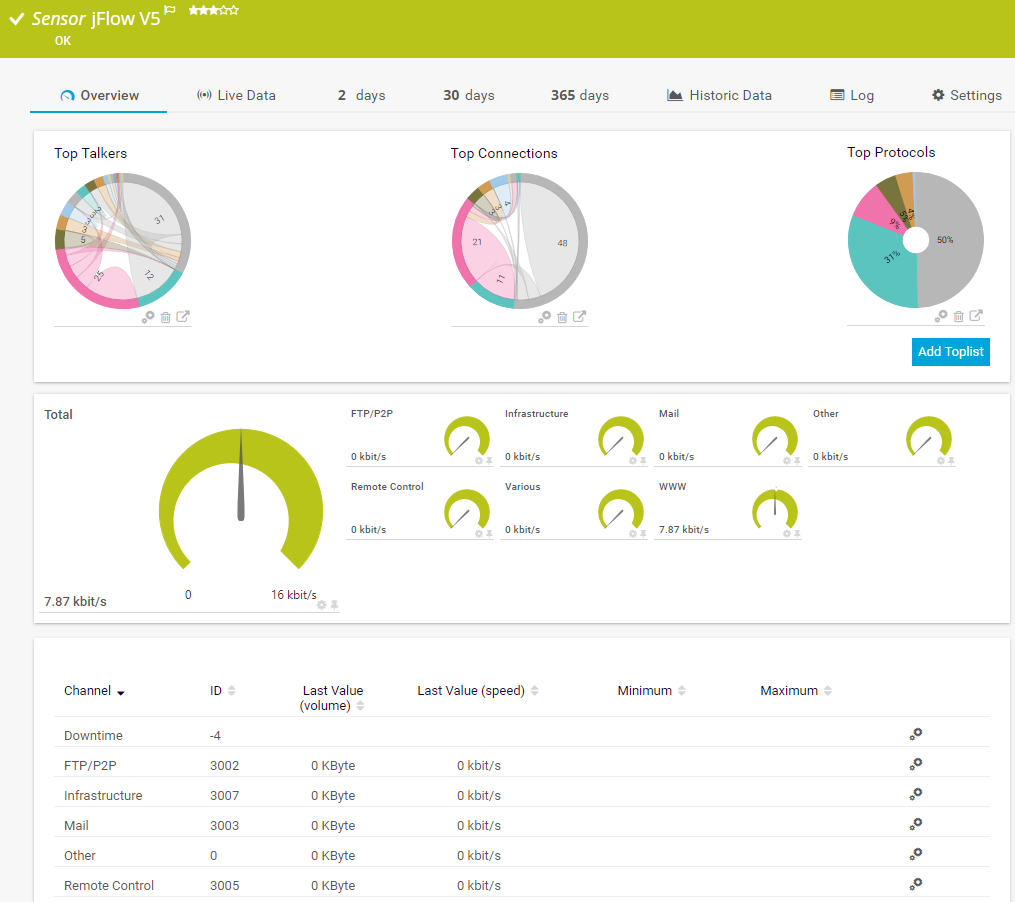
The jFlow v5 sensor receives traffic data from a jFlow v5-compatible device and shows the traffic by type. It can show the following and more:
See the PRTG Manual for a list of all available sensor types.

Custom alerts and data visualization let you quickly identify and prevent network performance issues and security threats.
PRTG is set up in a matter of minutes and can be used on a wide variety of mobile devices.

As a member of the Cisco Partner Program, Paessler is one of the market leaders that enhances the Cisco technology portfolio with products that are proven to easily integrate with Cisco devices.
What does this mean for you?
Partnering with innovative IT vendors, Paessler unleashes synergies to create
new and additional benefits for joined customers.
IT that works constitutes a business-critical basis for a company's success. Availability and security must be defined for the respective purpose and closely monitored – by OT and IT alike.
UVexplorer integrates tightly with PRTG to bring fast and accurate network discovery, detailed device inventory, and automatic network mapping to the PRTG platform.
baramundi and PRTG create a secure, reliable and powerful IT infrastructure where you have everything under control - from the traffic in your firewall to the configuration of your clients.
Real-time notifications mean faster troubleshooting so that you can act before more serious issues occur.
Network Monitoring Software – Version 25.3.110.1313 (August 27, 2025)
Download for Windows and cloud-based version PRTG Hosted Monitor available
English, German, Spanish, French, Portuguese, Dutch, Russian, Japanese, and Simplified Chinese
Network devices, bandwidth, servers, applications, virtual environments, remote systems, IoT, and more
Choose the PRTG Network Monitor subscription that's best for you
A protocol monitoring tool is software that tracks and analyzes network protocols to ensure optimal network performance and security. These tools help network admins collect data about traffic flows, bandwidth utilization, and communication between network devices. With protocol monitoring, you can identify problems such as latency, packet loss, or security threats before they impact the user experience. Today's protocol monitoring tools support multiple formats, including Simple Network Management Protocol (SNMP), syslog, NetFlow, and other network monitoring protocols.
PRTG monitors network protocols using specialized sensors that track communication between devices. It collects performance data using industry-standard protocols such as SNMP, NetFlow, sFlow and jFlow to monitor traffic flows through routers, switches, firewalls and other network devices. PRTG can monitor both IPv4 and IPv6 traffic, tracking destination IP addresses and analyzing packet metadata. Our monitoring tool provides real-time insight into network activity, allowing you to detect bottlenecks, identify unauthorized access, and troubleshoot connectivity issues across your entire infrastructure.
With PRTG you can monitor a wide range of network monitoring protocols including TCP/IP, UDP, ICMP, HTTP, HTTPS, FTP, DNS and many more. It supports monitoring of Cisco devices via SNMP and NetFlow, Microsoft servers via WMI and Amazon AWS services via API connections. PRTG also monitors routing protocols, syslog messages from network devices and application specific protocols. This comprehensive protocol support ensures that you have complete visibility into all network activity, from basic Internet Protocol communications to complex application interactions.
Protocol monitoring is essential for network security because it allows you to detect unusual traffic patterns that may indicate security threats. By monitoring protocols, you can identify unauthorized access attempts, detect potential malware communications, and monitor traffic to sensitive endpoints. PRTG helps you implement access control by alerting you when unexpected protocol usage occurs. The system monitors communication with firewalls and can detect when security rules are being bypassed. This continuous monitoring creates an additional layer of protection by providing visibility into all network traffic flows across your infrastructure.
Yes, PRTG helps with capacity planning by providing detailed insight into bandwidth usage across your network. By monitoring logs, you can identify which applications and services consume the most resources and determine the optimal allocation of network bandwidth. The system collects historical data on traffic flows, allowing you to analyze trends and forecast future needs. This information helps you plan strategic upgrades to network devices, increase capacity where needed, and optimize routing to avoid bottlenecks. With PRTG Protocol Monitoring, you can make data-driven decisions about network infrastructure investments.
Protocol monitoring with PRTG dramatically improves troubleshooting by providing detailed insight into network communications. When users report problems, you can immediately check the protocol performance, examine the headers in the packet data and identify where the communication breaks down. PRTG shows you exactly which network devices are experiencing latency or packet loss, helping you pinpoint the root cause of problems. The system maintains historical performance data, allowing you to compare current behavior with established baselines. This comprehensive visibility reduces mean time to resolution and helps you resolve complex network issues before they significantly impact user experience.
In PRTG, “sensors” are the basic monitoring elements. One sensor usually monitors one measured value in your network, for example the traffic of a switch port, the CPU load of a server, or the free space on a disk drive. On average, you need about 5-10 sensors per device or one sensor per switch port.
Paessler conducted trials in over 600 IT departments worldwide to tune its network monitoring software closer to the needs of sysadmins. The result of the survey: over 95% of the participants would recommend PRTG – or already have.

Paessler PRTG is used by companies of all sizes. Sysadmins love PRTG because it makes their job a whole lot easier.
Bandwidth, servers, virtual environments, websites, VoIP services – PRTG keeps an eye on your entire network.
Everyone has different monitoring needs. That’s why we let you try PRTG for free.