Custom alerts and data visualization let you quickly identify and prevent low bandwidth, traffic spikes, and other network performance issues.
Having the right tools at your disposal is imperative, and even more so when you monitor critical parameters such as network traffic. Paessler PRTG is exactly that – a powerful, purpose-built tool that uses flow protocols like NetFlow, and more, to highlight the smallest details of your network traffic.
Discover all your network data stream can tell you with PRTG NetFlow collection software. Is that a misconfigured application hogging your bandwidth? Are users cluttering up the network with media streams?
Leverage our NetFlow collector to quickly identify and troubleshoot these issues before they become a meeting with the CEO.
Configure network monitoring settings to exactly match your network’s needs in scale and complexity. No more nightmare of trying to shoehorn the problem into a sub-standard solution.
The flexibility of PRTG adapts quickly and readily to your infrastructure. Use custom thresholds and set alerts to be delivered the way you want, be it via email, text message, or other method.
How many monitoring tools do you really need before it’s just too many? Every added tool increases your system’s complexity and creates new blind spots for little bandwidth-sucking issues to hide.
PRTG highlights all the blind spots and cleans out the corners by combining all necessary tools into one comprehensive solution. This reduces complexity and increases your ability to stay on top of your network while keeping the hair you have.
If you aren’t holding the keys to your network, someone else is. Network security is non-negotiable, and PRTG helps you maintain tight control on the ins and outs of your network traffic.
By encrypting all data flows and utilizing real-time traffic analysis, PRTG acts as a guard dog on high alert, notifying you instantly of any suspicious activities before they can get out of hand.
Diagnose network issues by continuously tracking traffic data of your LAN, WAN, VPN, or hardware such as routers, switches, or firewalls via NetFlow. Show the bandwidth usage of IP addresses, ports, and network protocols, and other key metrics in real time. Visualize monitoring data in clear graphs and dashboards to identify problems more easily. Gain the overview you need to troubleshoot issues with your network flow and IP traffic.

Device tree view of the complete monitoring setup
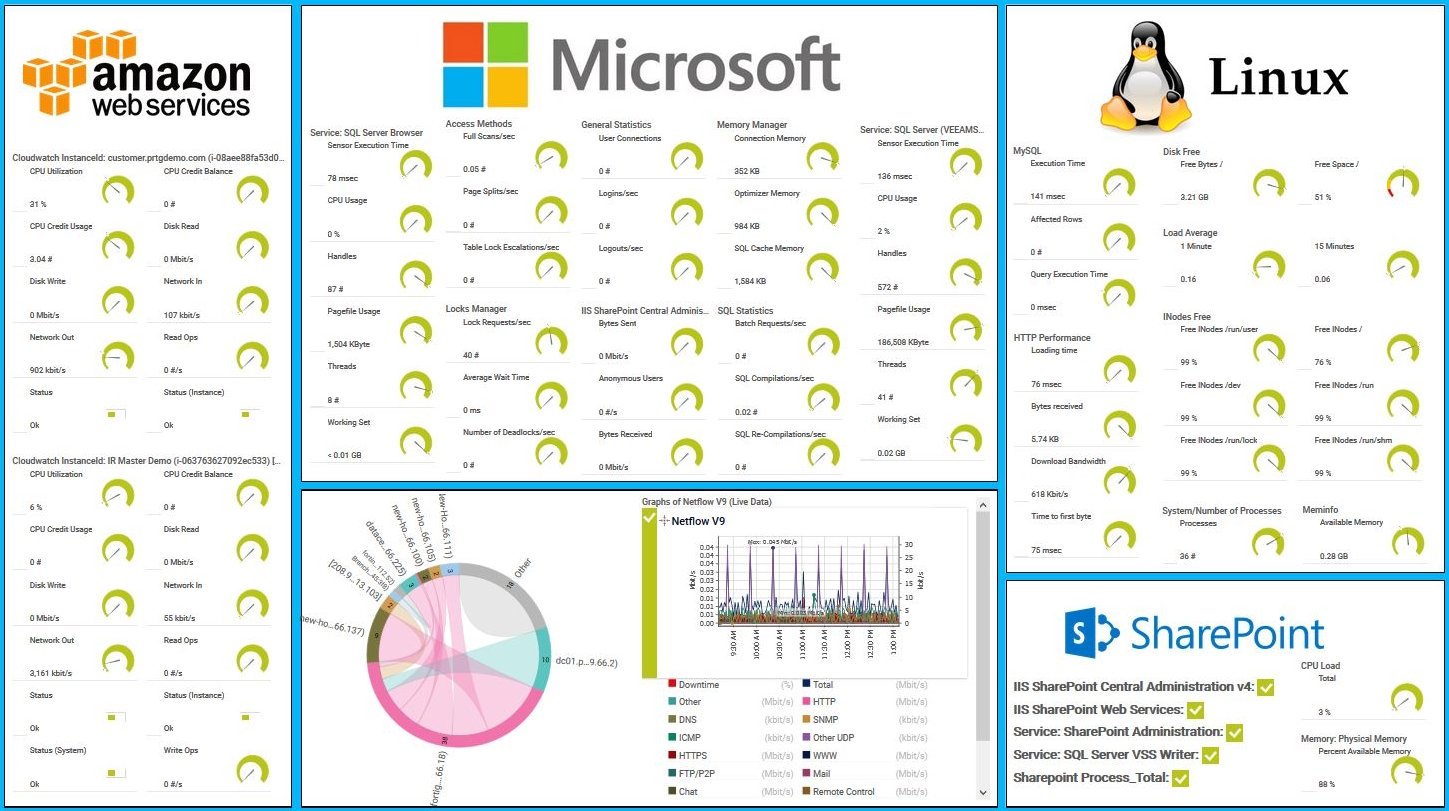
Comprehensive PRTG Sensor Dashboard Overview – Real-Time Monitoring of AWS, Microsoft, Linux, and SharePoint Services

Custom PRTG dashboard for keeping an eye on the entire IT infrastructure

Live traffic data graph in PRTG
“All-around winning
network monitor”
“The real beauty of PRTG is the endless possibilities it offers”
“PRTG Network Monitor
is very hard to beat”
Monitor who is using how much bandwidth, and what they are using it for. Track down that seemingly random traffic spike and put it to rest. Analyze overall usage patterns to find less obvious drains on your network.
With this birds-eye view, you can better manage resources, improve network performance, and plan for future network expansions on the ground.
Scaling with our NetFlow traffic monitoring software is simple and quick, thanks to its user-friendly design. Perfect for networks of any size, PRTG scales with your needs, ensuring that your critical NetFlow data monitoring and analysis remains robust, whether you’re just starting out or expanding.
Plan ahead to provide for enough bandwidth and devices such as routers and switches to avoid overload and bandwidth bottlenecks.
Spot issues a mile away and foresee business-critical failures before they happen with PRTG’s advanced alerts. You’re notified immediately of anything out of the ordinary in your NetFlow data, such as unexpected traffic spikes or unusual traffic patterns.
This proactive approach helps you mitigate issues swiftly and maintain smooth and reliable network operations.
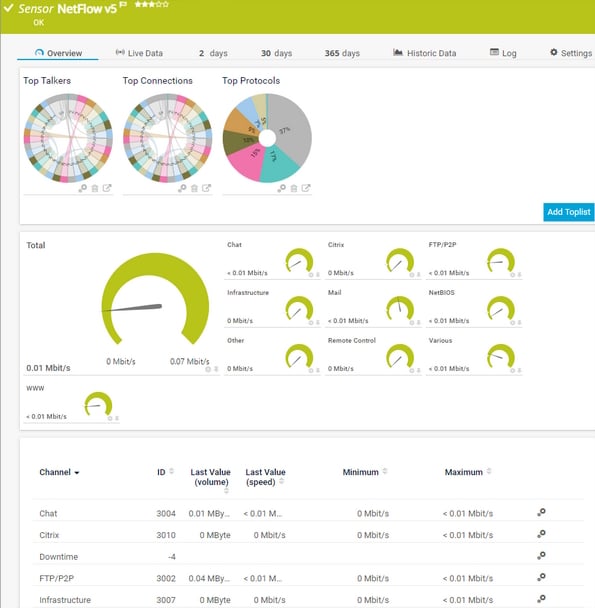
Use our built-in PRTG sensors for NetFlow monitoring that come with every PRTG license out of the box. Each sensor lets you break down traffic into the top talkers, top connections, and top protocols in your network to find out which device is using up your bandwidth.
NetFlow v5 is in widespread use. With PRTG, you get a preconfigured NetFlow v5 sensor as well as a NetFlow v5 (Custom) sensor for devices that have NetFlow v5 enabled.
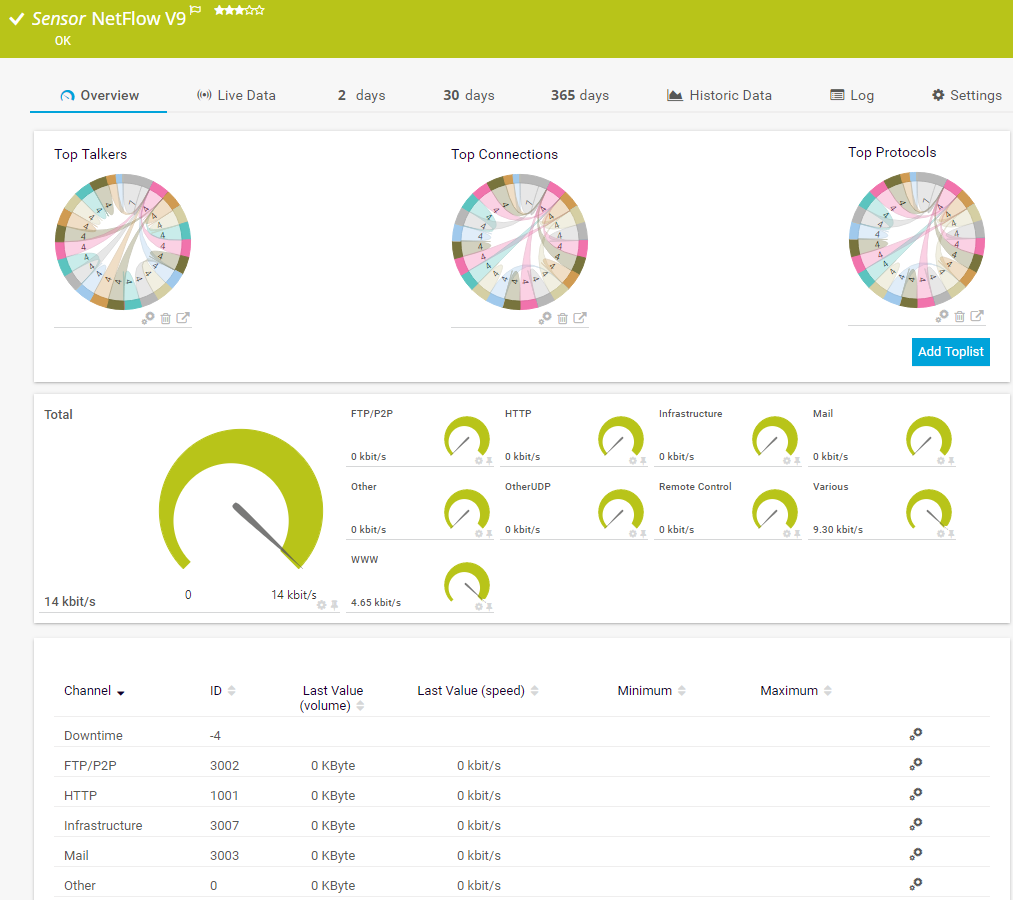
NetFlow v9 is an advanced form of the NetFlow technology. PRTG provides you with the preconfigured NetFlow v9 and NetFlow v9 (Custom) sensor for devices that have NetFlow v9 enabled.
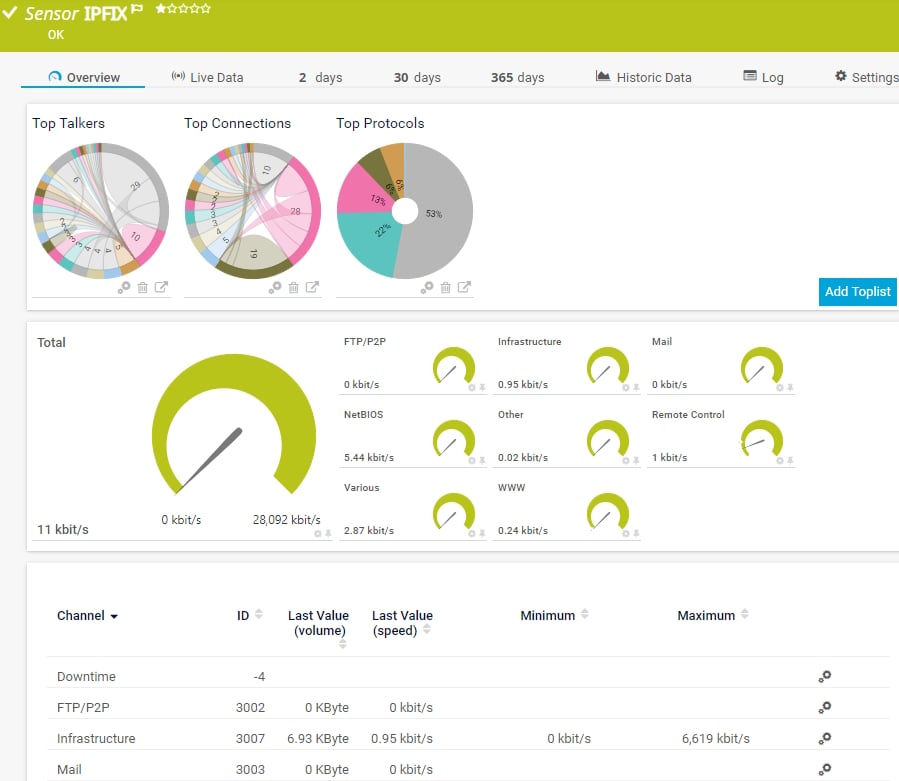
Internet Protocol Flow Information Export (IPFIX) is an advanced form of Cisco's NetFlow technology. PRTG offers two preconfigured sensors: the IPFIX and the IPFIX (Custom) sensor.
PRTG comes with more than 250 native sensor types for monitoring your entire on-premises, cloud, and hybrid cloud environment out of the box. Check out some examples below!
The NetFlow v5 sensor receives traffic data from a NetFlow v5-compatible device and shows the traffic by type. This sensor has several filter options to divide traffic into different channels. It can show the following and more:
The NetFlow v9 sensor receives traffic data from a NetFlow v9-compatible device and shows the traffic by type. This sensor has several filter options to divide traffic into different channels. It can show the following and more:
The IPFIX sensor receives traffic data from an Internet Protocol Flow Information Export (IPFIX) compatible device and shows traffic by type. It can show the following and more:
The SNMP Traffic v2 sensor monitors bandwidth and traffic on a device. It can show the following:
See the PRTG Manual for a list of all available sensor types.

Custom alerts and data visualization let you quickly identify and prevent low bandwidth, traffic spikes, and other network performance issues.
PRTG is set up in a matter of minutes and can be used on a wide variety of mobile devices.

As a member of the Cisco Partner Program, Paessler is one of the market leaders that enhances the Cisco technology portfolio with products that are proven to easily integrate with Cisco devices.
What does this mean for you?
Partnering with innovative IT vendors, Paessler unleashes synergies to create
new and additional benefits for joined customers.
Integrating monitoring results from PRTG into NetBrain maps makes the foundation for network automation.
IT that works constitutes a business-critical basis for a company's success. Availability and security must be defined for the respective purpose and closely monitored – by OT and IT alike.
With ScriptRunner Paessler integrates a powerful event automation platform into PRTG Network Monitor.
Real-time notifications mean faster troubleshooting so that you can act before more serious issues occur.
Network Monitoring Software – Version 25.3.110.1313 (August 27, 2025)
Download for Windows and cloud-based version PRTG Hosted Monitor available
English, German, Spanish, French, Portuguese, Dutch, Russian, Japanese, and Simplified Chinese
Network devices, bandwidth, servers, applications, virtual environments, remote systems, IoT, and more
Choose the PRTG Network Monitor subscription that's best for you


NetFlow is a protocol for collecting, aggregating, and recording traffic, or flow* data, in a network. This data provides a more granular view of how bandwidth and network traffic are being used when compared to other solutions.
The protocol was developed by Cisco and is embedded in Cisco’s IOS software on the company’s routers and switches. Many other hardware manufacturers either support NetFlow or use alternative technologies.
* A flow is simply a way of grouping a unidirectional stream of packets into a specific set. These sets can be configured according to matching attributes in each packet including IP source, IP destination, source port, and others.
A NetFlow collector captures, saves, and processes NetFlow data. It’s an application that ingests the flows and organizes the binary data into a numeric format. A NetFlow collector also compresses the size of the NetFlow data and stores the output on a database.
Some of the tools out there are more effective than others at providing in-depth data analysis. And many administrators use one single tool to perform the functions of both a NetFlow collector and NetFlow analyzer – such as Paessler PRTG, the all-in-one monitoring tool for your network.
PRTG is designed to scale efficiently with your network. It utilizes an optimized database architecture and intelligent data sampling techniques to handle high volumes of data without degrading performance. For larger networks, PRTG can distribute monitoring loads across multiple servers to maintain responsiveness and real-time monitoring accuracy.
Yes, PRTG allows users to set up customized filters for NetFlow data, enabling you to focus on specific IP addresses, port numbers, or traffic types. This capability is crucial for finding the root causes of issues or monitoring specific aspects of network traffic, such as multicast or peer-to-peer traffic.
PRTG enhances network security by providing detailed traffic analysis, which can detect anomalous behavior and potential network attacks. Features include encrypted data storage, secure communication channels between sensors and the core server, and comprehensive logging of all network events, which is crucial for forensic analysis and compliance with regulations like GDPR and HIPAA.
There is a reason why 500,000 users rely on PRTG every day, the monitoring solution for all areas of IT, including database, application, cloud, server, LAN, and SNMP.
So, it’s not just bandwidth and switches – if you’re out to get a NetFlow collector, with PRTG you’re also getting a tool to:
PRTG offers extensive native support for popular network devices and applications and a powerful API for custom integrations. This flexibility allows PRTG to fit into any IT infrastructure and interact seamlessly with other management tools and systems, streamlining workflows and enhancing data consistency across your monitoring toolkit.
In PRTG, “sensors” are the basic monitoring elements. One sensor usually monitors one measured value in your network, for example the traffic of a switch port, the CPU load of a server, or the free space on a disk drive. On average, you need about 5-10 sensors per device or one sensor per switch port.
Paessler conducted trials in over 600 IT departments worldwide to tune its network monitoring software closer to the needs of sysadmins. The result of the survey: over 95% of the participants would recommend PRTG – or already have.

Paessler PRTG is used by companies of all sizes. Sysadmins love PRTG because it makes their job a whole lot easier.
Bandwidth, servers, virtual environments, websites, VoIP services – PRTG keeps an eye on your entire network.
Everyone has different monitoring needs. That’s why we let you try PRTG for free.