Custom alerts and data visualization let you quickly identify and prevent Internet protocol suite issues.
Ever tried finding a needle in a digital haystack? That's what troubleshooting network issues feels like without proper monitoring. The Internet Protocol Suite (TCP/IP) is the invisible backbone connecting everything in your IT infrastructure. When these communication protocols hiccup, your entire network suffers - slow web pages, failed file transfers, and the dreaded "network is down" calls from frustrated users. Network monitoring tools like Paessler PRTG become essential for maintaining optimal performance across your IP networks.
Think about it: every email sent, every file shared, every web page loaded depends on dozens of protocol interactions happening perfectly in sequence. A single DNS query failure can make your entire website seem "down" even when the server is running flawlessly. A routing protocol misconfiguration can send data packets on scenic detours, creating mysterious slowdowns that leave users baffled and IT teams scrambling. PRTG's specialized sensors track each critical interaction point, alerting you to DNS resolution problems and identifying inefficient routing paths before users even notice issues. By monitoring the entire protocol sequence, PRTG helps you spot the first domino before it falls.
Network administrators without protocol-level visibility are essentially flying blind. You might know something's wrong, but pinpointing whether the issue lies in TCP transmission, IP routing, or application layer services becomes an exercise in educated guessing. PRTG changes this dynamic completely by providing detailed protocol-specific sensors that monitor each layer of the TCP/IP stack independently. Instead of guesswork, you get precise diagnostics showing exactly where communication breaks down. This targeted visibility transforms troubleshooting from hours of investigation into minutes of focused resolution.
While basic tools might tell you "something's wrong," PRTG helps pinpoint exactly where the problem lies - whether it's up in the application layer with HTTP and FTP, the transport layer where TCP and UDP do the heavy lifting, or down at the internet layer where IP addresses and routing magic happens. It's like having x-ray vision for your entire network communication system!
Diagnose network issues by continuously tracking every layer in your TCP/IP ecosystem. Show transport layer efficiency data and other key metrics in real time. Visualize monitoring data in clear graphs and dashboards to identify problems more easily. Gain the overview you need to troubleshoot Internet protocol suite issues.

Device tree view of the complete monitoring setup

Custom PRTG dashboard for keeping an eye on the entire IT infrastructure

Live traffic data graph in PRTG
“All-around winning
network monitor”
“The real beauty of PRTG is the endless possibilities it offers”
“PRTG Network Monitor
is very hard to beat”
Is TCP playing nice with your applications? Are UDP packets arriving as expected? PRTG keeps these transport layer protocols under close surveillance, measuring connection times and tracking data packet journeys across your network. When TCP starts dragging its feet or UDP packets go missing, PRTG sounds the alarm before users even notice.
The internet layer is where IP addresses find their way home and routing decisions make or break your network's day. PRTG constantly patrols this critical territory, monitoring ICMP responses, checking IP address availability, and making sure your routing protocols aren't taking unexpected detours. When a router decides to take a coffee break or an IP subnet goes into hiding, you'll be the first to know - and the first to fix it. Your users might start thinking you have psychic powers!
Your users don't care about TCP or IP - they just want their web pages, emails, and file transfers to work. PRTG monitors the application layer protocols they interact with daily (HTTP, FTP, DNS, SMTP, Telnet) to ensure they're not just available but performing at their best. When DNS starts moving in slow motion or your FTP server gets stage fright, PRTG gives you the heads-up before angry emails start piling up. It's like having a personal assistant for all your critical network services!
Even the most sophisticated network relies on solid physical connections. PRTG keeps a watchful eye on your Ethernet connections and ARP processes, ensuring the foundation of your network stays rock solid. When authentication issues arise or physical connections start acting flaky, you'll have the insights needed to resolve them before they escalate. Think of it as insurance for the most fundamental part of your network communication.
With networks transitioning between IPv4 and IPv6, monitoring both is no longer optional - it's essential. PRTG handles both protocol versions with equal expertise, giving you complete visibility regardless of which IP flavor you're running. Compare traffic patterns, spot version-specific quirks, and ensure smooth sailing across your entire IP network ecosystem.
PRTG comes with more than 250 native sensor types for monitoring your entire on-premises, cloud, and hybrid cloud environment out of the box. Check out some examples below!
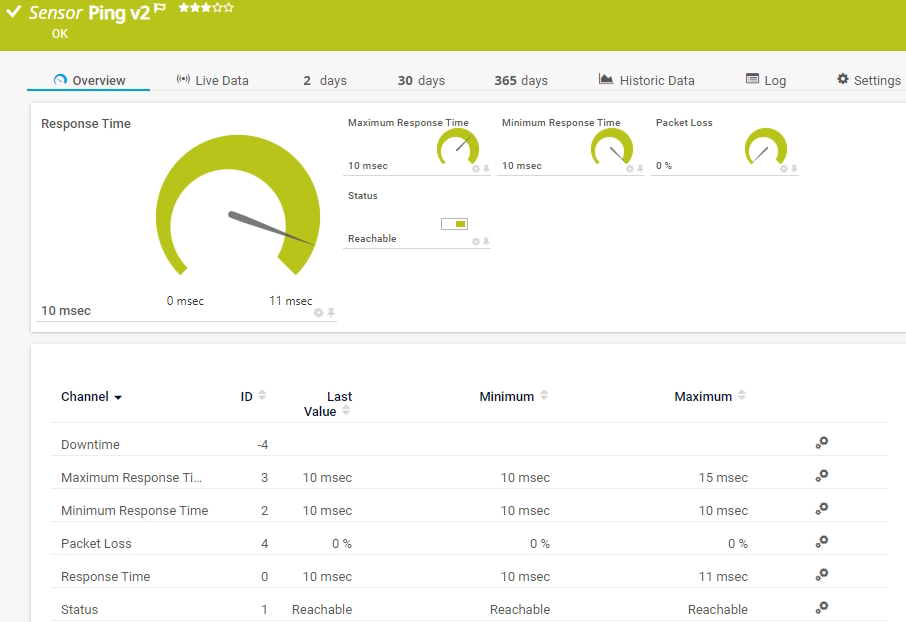
The Ping v2 sensor sends an Internet Control Message Protocol (ICMP) echo request ("ping") from the probe system to the parent device to monitor its availability. It can show the following:
• Response time
• Packet loss
• Target status
• Minimum and maximum ping time
The SNMP Traffic v2 sensor monitors bandwidth and traffic on a device. It can show the following:
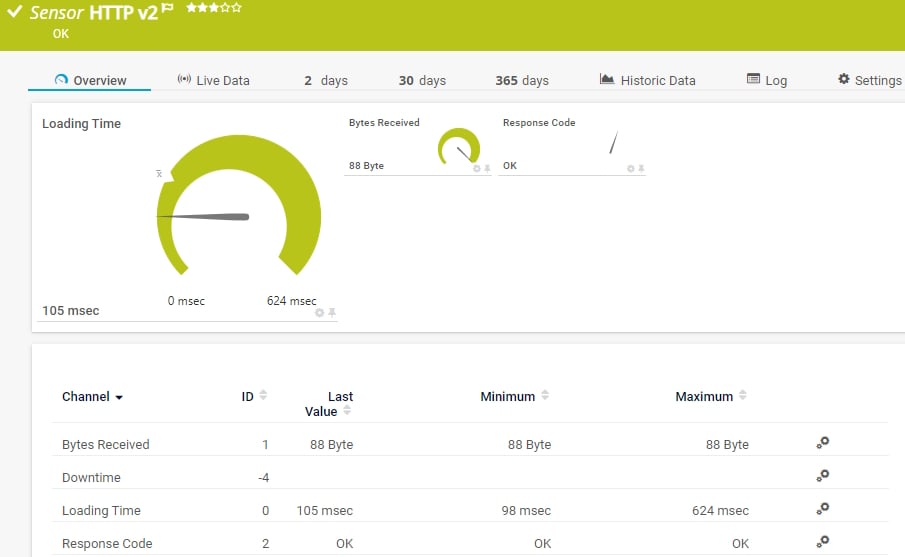
The HTTP v2 sensor monitors a web server. It can show the following:
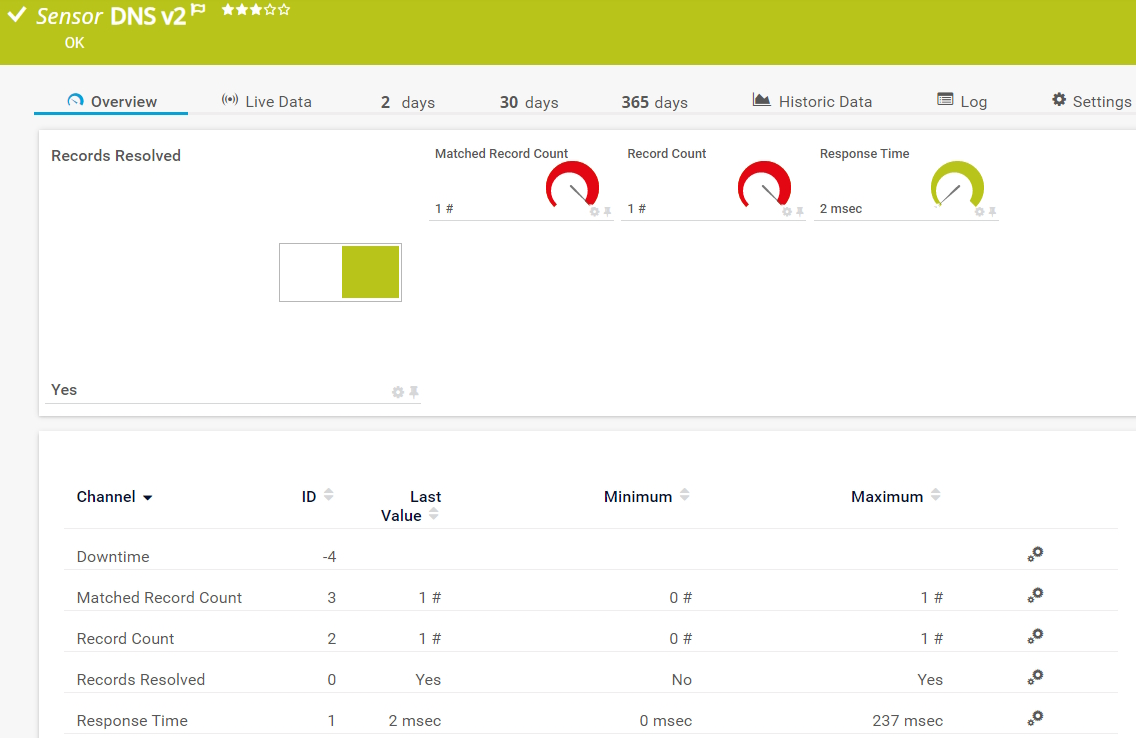
The DNS v2 sensor monitors a Domain Name System (DNS) server, resolves domain name records, and compares them to a filter. It can show the following:
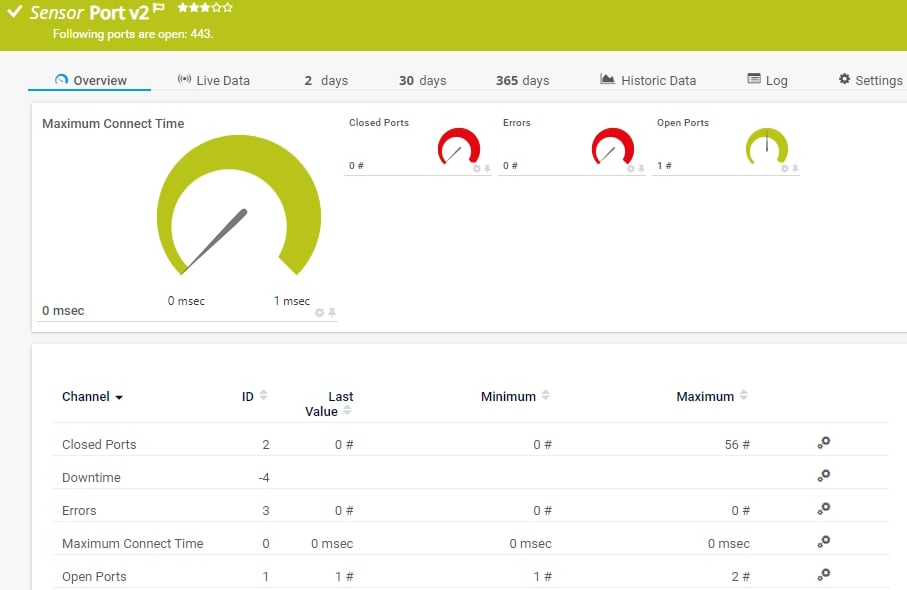
The Port v2 sensor monitors a network service by connecting to one or more of its TCP/IP ports. It can show the following:
See the PRTG Manual for a list of all available sensor types.

Custom alerts and data visualization let you quickly identify and prevent Internet protocol suite issues.
PRTG is set up in a matter of minutes and can be used on a wide variety of mobile devices.

Partnering with innovative IT vendors, Paessler unleashes synergies to create
new and additional benefits for joined customers.
Asset visibility is a big problem for many IT teams. Not having an accurate inventory of tech assets is inefficient, costly and a potential security risk.
Combine the functionality of Sigfox and Paessler for the most comprehensive, cost-effective, and easy-to-use IoT solution available.
Integrating monitoring results from PRTG into NetBrain maps makes the foundation for network automation.
Real-time notifications mean faster troubleshooting so that you can act before more serious issues occur.
Network Monitoring Software – Version 25.3.110.1313 (August 27, 2025)
Download for Windows and cloud-based version PRTG Hosted Monitor available
English, German, Spanish, French, Portuguese, Dutch, Russian, Japanese, and Simplified Chinese
Network devices, bandwidth, servers, applications, virtual environments, remote systems, IoT, and more
Choose the PRTG Network Monitor subscription that's best for you
Think of the Internet Protocol Suite (TCP/IP) as the universal language of your infrastructure - it's how your devices talk to each other and the internet. This family of communication protocols works like a well-organized team: the application layer (HTTP, FTP, SMTP) handles the services you interact with, the transport layer (TCP, UDP) ensures data arrives correctly, the internet layer (IP, ICMP) handles addressing and routing, and the data-link layer (Ethernet, ARP) manages physical connections. Without this protocol family working in harmony, you wouldn't be able to read this web page, send emails, or pretty much do anything online!
PRTG is able to monitor each layer of your TCP/IP protocol stack. For transport layer surveillance, it deploys TCP and UDP connection sensors to verify everything's flowing smoothly. At the internet layer, ping sensors constantly check ICMP responses and IP connectivity. For the application layer, specialized HTTP, FTP, DNS, and SMTP sensors monitor the services your users depend on. PRTG even offers packet sniffing capabilities to analyze traffic patterns across your entire network—like having security cameras for your data! The result? Complete visibility into every conversation happening on your network.
Running a network without protocol monitoring is like trying to see in the dark. When transport layer protocols falter, data arrives corrupted or not at all. When internet layer issues occur, devices can't find each other. When application layer protocols struggle, users can't access services they need – if you can’t see what’s really going on, it’s not going to end well. But by monitoring the entire suite, you can turn on the lights, and you'll spot problems before they become disasters – letting you maintain peak performance.
PRTG transforms you from network firefighter to prevention specialist. Instead of waiting for users to report issues, you'll see problems developing in real-time across all protocol layers. When something goes wrong, PRTG's intuitive dashboards show exactly where the trouble started—whether it's packet transmission issues, routing problems, or application response delays. You'll receive instant alerts when performance thresholds are crossed, giving you a head start on troubleshooting. PRTG even helps connect the dots between different protocol issues, helping you see relationships that would otherwise remain hidden.
In PRTG, “sensors” are the basic monitoring elements. One sensor usually monitors one measured value in your network, for example the traffic of a switch port, the CPU load of a server, or the free space on a disk drive. On average, you need about 5-10 sensors per device or one sensor per switch port.
Paessler conducted trials in over 600 IT departments worldwide to tune its network monitoring software closer to the needs of sysadmins. The result of the survey: over 95% of the participants would recommend PRTG – or already have.

Paessler PRTG is used by companies of all sizes. Sysadmins love PRTG because it makes their job a whole lot easier.
Bandwidth, servers, virtual environments, websites, VoIP services – PRTG keeps an eye on your entire network.
Everyone has different monitoring needs. That’s why we let you try PRTG for free.