Custom alerts and data visualization let you quickly identify and prevent web server errors, slow page speed, and other website issues.
A website that’s up and running 24/7 is important for any modern business – whether it’s an e-commerce site, a SaaS platform, or a corporate homepage.
If you want to make sure it stays that way, monitoring your website uptime with Paessler PRTG is the path forward. It’s an easy way to make sure your site stays online and avoid pesky downtime, which can have a negative influence on user satisfaction, SEO rankings, and even revenue.
With PRTG, you always know if you should have a look at load times, page speed, or check the validity of your SSL certificate.
With an instant view into how your website is performing, you can deal with potential issues before they start being a nuisance. Plus, you can set custom thresholds for your teams so they can respond even quicker to any performance issues.

If you need a monitoring software to check if your website is up and running, PRTG will be your go-to network monitoring platform. Tracking your most important data at all times? PRTG has got you covered as well. You’ll never again be surprised with problems regarding your website’s health. Promise.
Pay extra close attention to important website data like response time, page load times, and ping tests. Real-time visibility into website data lets you detect slowdowns and make changes before they affect your customers.
Regular ping tests show you if your website is reachable from the outside, while tracking page load times helps reduce bounce rates and give users a great experience no matter the device they use.
To avoid security vulnerabilities, PRTG monitors SSL certificates to make sure they are still valid – an easy way to prevent unplanned expiration.
It also tracks TCP connections to ensure stable data transfers, which helps maintain both network security and reliability. With continuous monitoring, PRTG give you the peace of mind that your site is always running the way it should.
PRTG’s DNS monitoring continuously verifies that your domain resolves correctly, so you don’t have to worry about people not reaching your website due to a DNS misconfigurations. It also lets you know if there are any other problems with your DNS.
An easy way to fix issues before they further affect your business. Having a reliable DNS resolution means your site will always be accessible, and you’ll have a constant uptime and a smooth user experience.
Diagnose network issues by continuously tracking website availability and uptime. Show website response times, page load speed, and other key metrics in real time. Visualize monitoring data in clear graphs and dashboards to identify problems more easily. Gain the overview you need to troubleshoot downtime or performance issues.

Device tree view of the complete monitoring setup

Custom PRTG dashboard for keeping an eye on the entire IT infrastructure

Live traffic data graph in PRTG
“All-around winning
network monitor”
“The real beauty of PRTG is the endless possibilities it offers”
“PRTG Network Monitor
is very hard to beat”
If you want to have one less thing to worry about, let PRTG keep an eye on your website’s uptime. Critical metrics like the SSL certificate expiry date or website availability are always under surveillance, so you can focus on other projects and only be informed when you are alerted.
It’s an easy way to prevent or minimize outages, so your team – and your users – can have the peace of mind that your site will be available when they need it most.
Being in the loop when you need to be is a great way to approach system administration. When you set up your custom alerts in PRTG, you always know exactly what is going on, whether it’s downtime, DNS errors, or response time delays.
Configure the notifications you and your team need – whether it’s email, SMS, or push notifications, you get the information where you want them (without the false positives).
Response time and SSL health are valuable metrics to keep an eye on as they can directly be linked to a fulfilling user experience. Optimize the performance of your website by addressing bottlenecks before they have a negative impact on availability or compliance.
With the help of PRTG, you’ll maintain high uptime and performance without breaking a sweat. And if you need to do some maintenance, you can monitor if your public status pages are shown to visitors.
You want to integrate PRTG into your existing infrastructure? No problem! Thanks to its flexible API, you can just do that.
Custom webhooks let you automate tasks or trigger actions based on threshold breaches, so PRTG can adapt to fit your monitoring needs. From streamlining reports to specific monitoring scenarios, PRTG’s adaptability makes it simple to tailor your setup to suit.
PRTG comes with more than 250 native sensor types for monitoring your entire on-premises, cloud, and hybrid cloud environment out of the box. Check out some examples below!
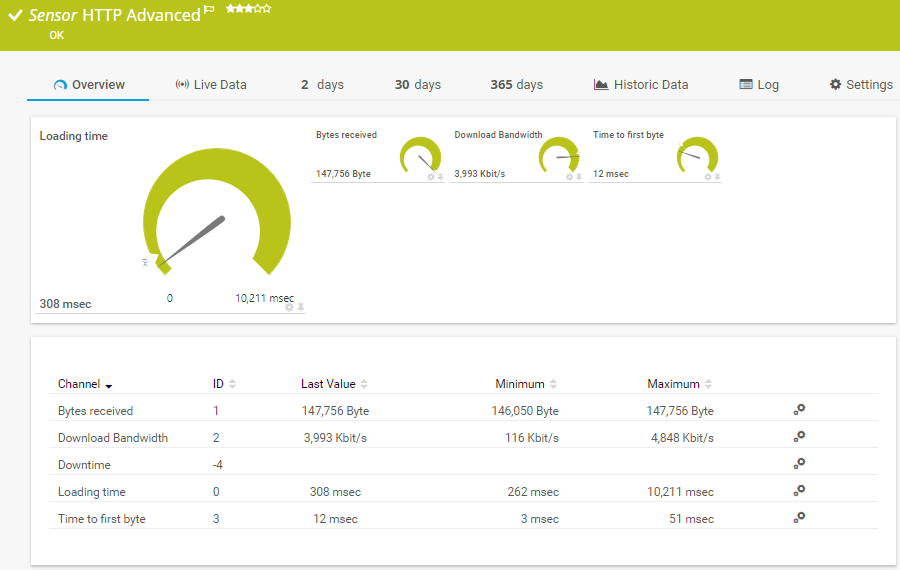
The HTTP Advanced sensor monitors the source code of a web page using HTTP. It supports authentication, content checks, and other advanced parameters. It can show the following:
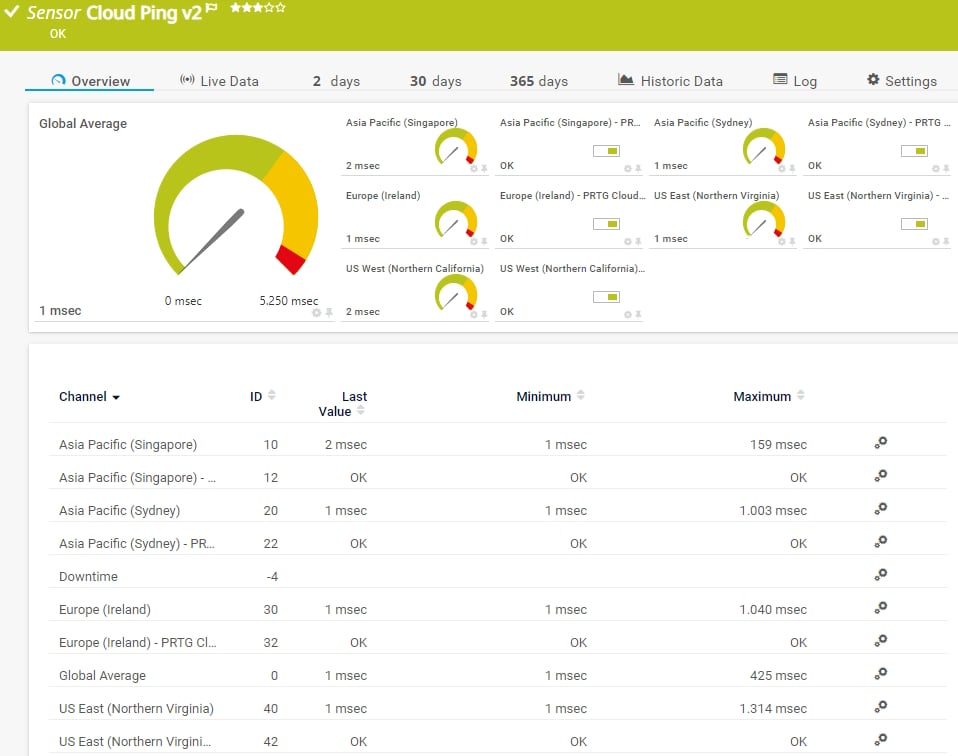
The Cloud Ping v2 sensor monitors the Transmission Control Protocol (TCP) ping times to its parent device from different locations worldwide (Asia Pacific: Singapore, Asia Pacific: Sydney, Europe: Ireland, US East: Northern Virginia, US West: Northern California) via the PRTG Cloud. It can show the following:
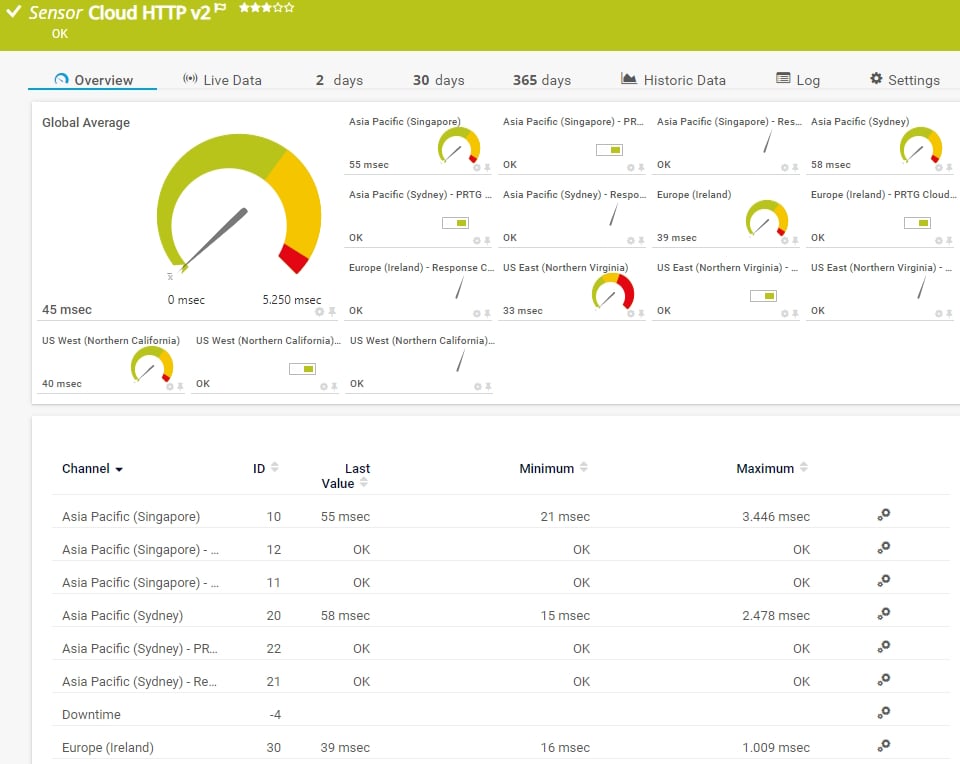
The Cloud HTTP v2 sensor monitors the loading time of a web server via HTTP from different locations worldwide (Asia Pacific: Singapore, Asia Pacific: Sydney, Europe: Ireland, US East: Northern Virginia, US West: Northern California) via the PRTG Cloud. It can show the following:
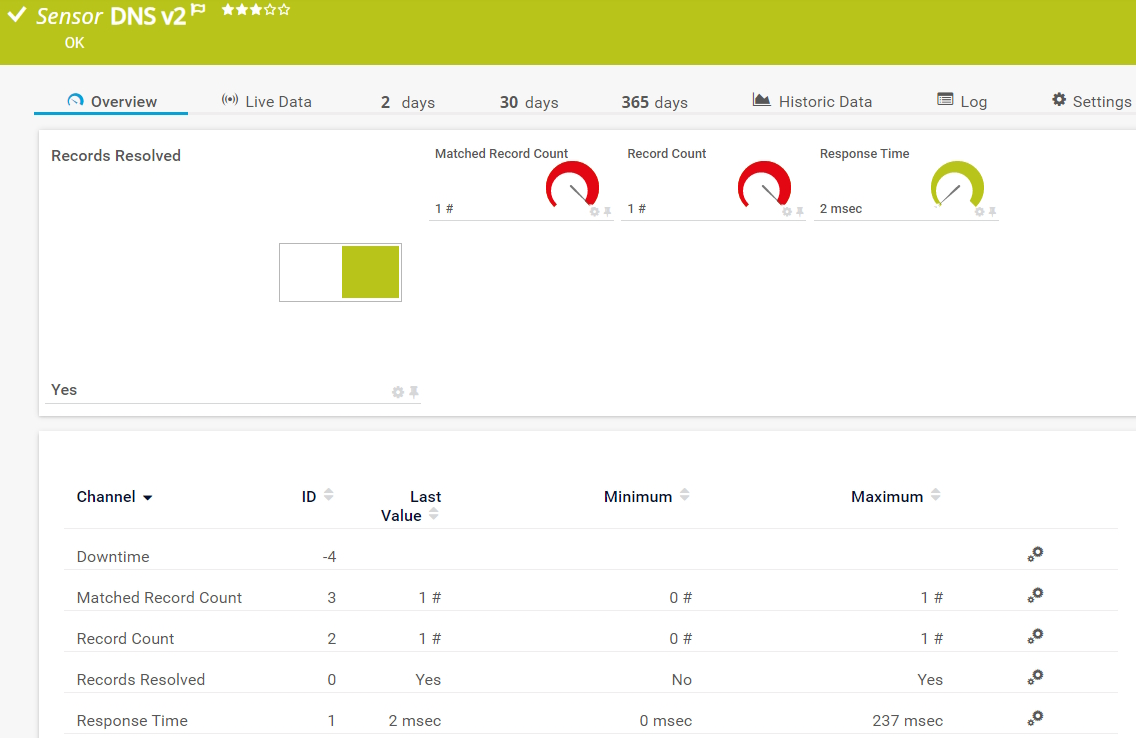
The DNS v2 sensor monitors a Domain Name System (DNS) server, resolves domain name records, and compares them to a filter. It can show the following:
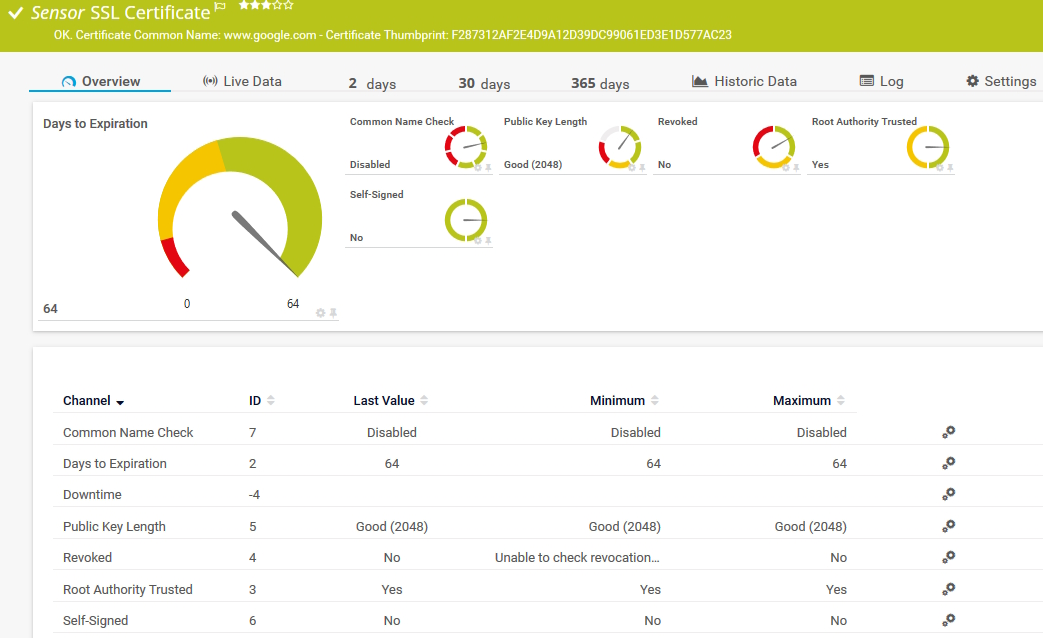
The SSL Certificate sensor monitors the certificate of a Secure Sockets Layer (SSL)/Transport Layer Security (TLS) secured connection. It can show the following:
See the PRTG Manual for a list of all available sensor types.

Custom alerts and data visualization let you quickly identify and prevent web server errors, slow page speed, and other website issues.
PRTG is set up in a matter of minutes and can be used on a wide variety of mobile devices.

Partnering with innovative IT vendors, Paessler unleashes synergies to create
new and additional benefits for joined customers.
Combining their tools to a powerful solution for advanced analysis and automation, KnowledgeRiver and Paessler enable IT teams to ensure best performance for their infrastructure and networks.
baramundi and PRTG create a secure, reliable and powerful IT infrastructure where you have everything under control - from the traffic in your firewall to the configuration of your clients.
Combining PRTG’s broad monitoring feature set with IP Fabric’s automated network assurance creates a new level of network visibility and reliability.
Real-time notifications mean faster troubleshooting so that you can act before more serious issues occur.
Network Monitoring Software – Version 25.3.110.1313 (August 27, 2025)
Download for Windows and cloud-based version PRTG Hosted Monitor available
English, German, Spanish, French, Portuguese, Dutch, Russian, Japanese, and Simplified Chinese
Network devices, bandwidth, servers, applications, virtual environments, remote systems, IoT, and more
Choose the PRTG Network Monitor subscription that's best for you
Website uptime monitoring is the process of tracking the availability and performance of your website to make sure it remains accessible to users. PRTG tracks key website metrics, monitors for potential outages, and provides customizable notifications when issues arise. This guarantees that your website offers a reliable experience for every end user.
Yes, downtime can negatively impact your SEO rankings. Search engines like Google penalize websites that aren’t consistently available, affecting visibility and traffic. Use PRTG to minimize downtime and maintain high availability. This will help to protect your rankings and ensures that end users can always reach your site.
Yes, PRTG is scalable and can track multiple websites simultaneously. This allows you to monitor website performance across different locations and maintain an overview of all your sites, no matter the size of your infrastructure.
PRTG monitors key performance metrics such as response time, load time, page speed, and upload/download speed, so you can identify slowdowns early. By resolving performance issues promptly, you can optimize website speed and deliver a better experience for end users. This not only boosts satisfaction but also supports SEO and conversion goals.
Yes, PRTG offers a free version of its monitoring service, allowing you to monitor up to 100 sensors at no cost. This includes tracking critical metrics like response time and SSL health, which are essential for maintaining uptime and performance. If you require advanced monitoring for larger infrastructures, affordable paid licenses are available.
In PRTG, “sensors” are the basic monitoring elements. One sensor usually monitors one measured value in your network, for example the traffic of a switch port, the CPU load of a server, or the free space on a disk drive. On average, you need about 5-10 sensors per device or one sensor per switch port.
Paessler conducted trials in over 600 IT departments worldwide to tune its network monitoring software closer to the needs of sysadmins. The result of the survey: over 95% of the participants would recommend PRTG – or already have.

Paessler PRTG is used by companies of all sizes. Sysadmins love PRTG because it makes their job a whole lot easier.
Bandwidth, servers, virtual environments, websites, VoIP services – PRTG keeps an eye on your entire network.
Everyone has different monitoring needs. That’s why we let you try PRTG for free.