Custom alerts and data visualization let you quickly identify and prevent virtualization issues.
Hyper-V is a virtualization platform from Microsoft that enables users to create and manage virtual machines on Windows-based systems. It uses a hypervisor to manage both the Hyper-V server and virtual machines, which allows the VMs to run independently from the underlying hardware.
Virtualization with solutions such as Microsoft Hyper-V has become increasingly important in modern IT infrastructures, as it allows multiple virtual machines to run on a single physical server. This not only improves resource utilization but also reduces costs while at the same time boosting the flexibility of your business.
Virtualization also comes with some drawbacks, however, such as a more complex IT environment and performance overhead due to an additional layer of software between the physical hardware and the virtual machines. Also, a critical error – whether of the network connection or the host itself – might affect several virtual servers at the same time.
It’s not a good idea to set up a virtualized environment without keeping an eye on CPU load, disk usage, performance, and network utilization of your VMs. Solutions for virtualization like Microsoft Hyper-V themselves usually offer only basic information about the status and performance of your virtual machines and the applications that run on them.
PRTG offers in-depth monitoring of all important data of your Hyper-V environment and arranges it into neat, customizable dashboards. Preconfigured Hyper-V sensors that you get out-of-the-box with every product license make setting up your Hyper-V monitoring very easy.
Diagnose network issues by continuously tracking Microsoft Hyper-V. Show all data about your virtual hosts, guest VMs, and virtual services in real time. Visualize monitoring data in clear graphs and dashboards to identify problems more easily. Gain the overview you need to troubleshoot latency, bottlenecks, and other performance issues.

Device tree view of the complete monitoring setup

Custom PRTG dashboard for keeping an eye on the entire IT infrastructure

Live traffic data graph in PRTG
“All-around winning
network monitor”
“The real beauty of PRTG is the endless possibilities it offers”
“PRTG Network Monitor
is very hard to beat”
PRTG monitors all aspects of your Hyper-V virtual environment. For virtual machines to run smoothly, their host must be stable and reliable. With PRTG, you can monitor, for example, the system status, disk usage, and CPU load of your Hyper-V host. To prevent errors or outages, we also recommend monitoring your most important virtual machines and the applications that run on the VMs, as well as the allocated storage.
With PRTG, you don’t need to manually check every single metric of your Hyper-V environment. Our virtual infastructure monitoring software offers a centralized view that combines all your monitoring data in a user-friendly dashboard. Additionally, you can design custom maps and dashboards with our easy-to-use drag-and-drop map editor to display your Hyper-V monitoring metrics the way you want.
If you’re tired of constantly checking if your virtual environment is working properly, just sit back & relax with PRTG – whenever a problem with your Hyper-V resources or any other issue on your network occurs, our monitoring software will immediately alert you through highly customizable notifications, for example via email, SMS, push notifications, Teams or Slack messages, and more.
PRTG comes with more than 250 native sensor types for monitoring your entire on-premises, cloud, and hybrid cloud environment out of the box. Check out some examples below!
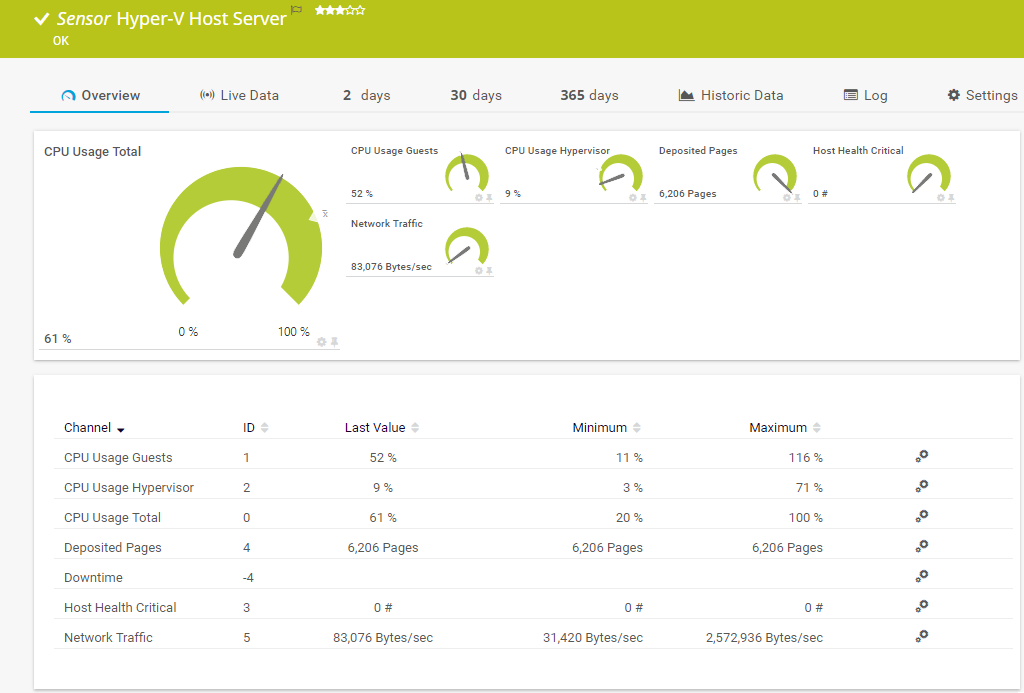
The Hyper-V Host Server sensor monitors a Microsoft Hyper-V host server via WMI or Windows performance counters. It can show the following:
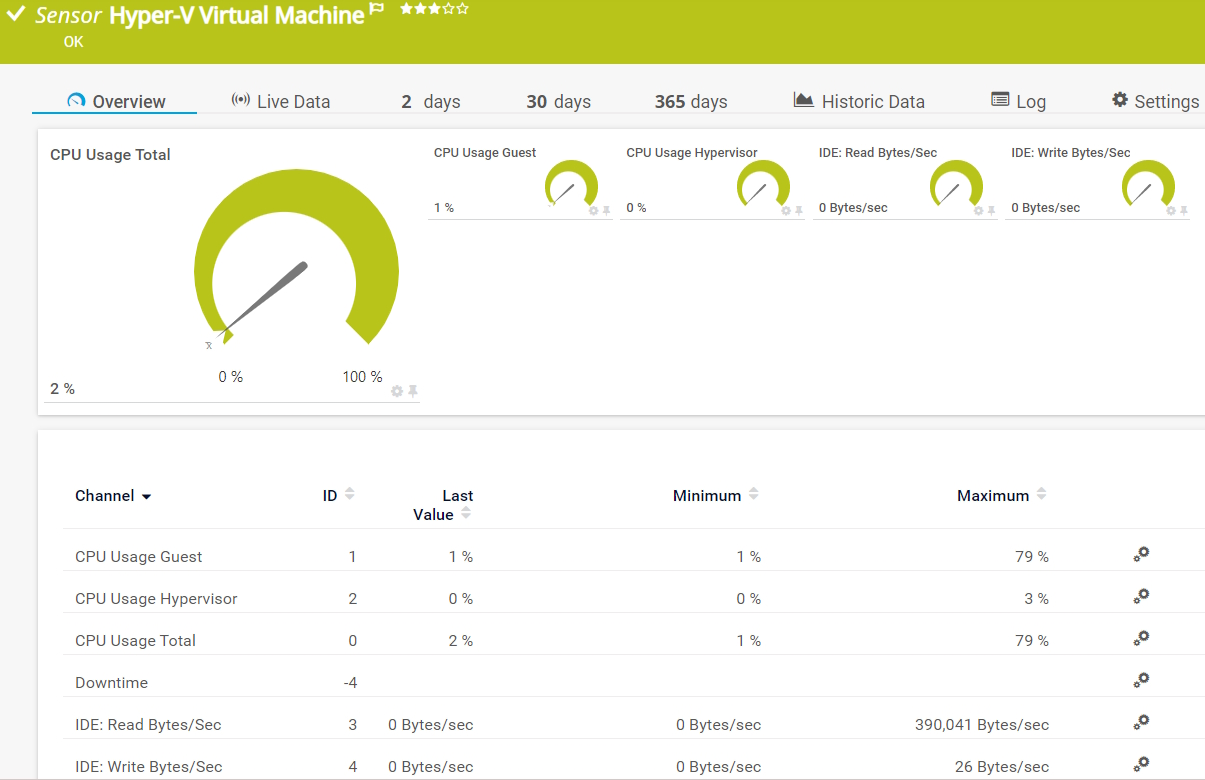
The Hyper-V Virtual Machine sensor monitors a virtual machine that runs on a Microsoft Hyper-V host server via WMI or Windows performance counters. It can show the following:
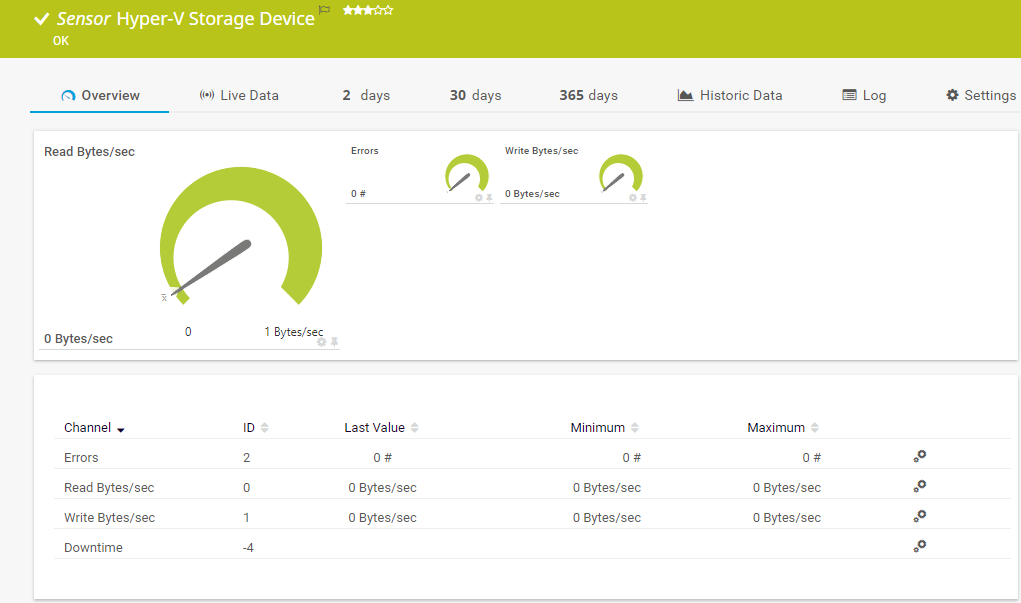
The Hyper-V Virtual Storage Device sensor monitors a virtual storage device that runs on a Microsoft Hyper-V host server via WMI or Windows performance counters. It can show the following:
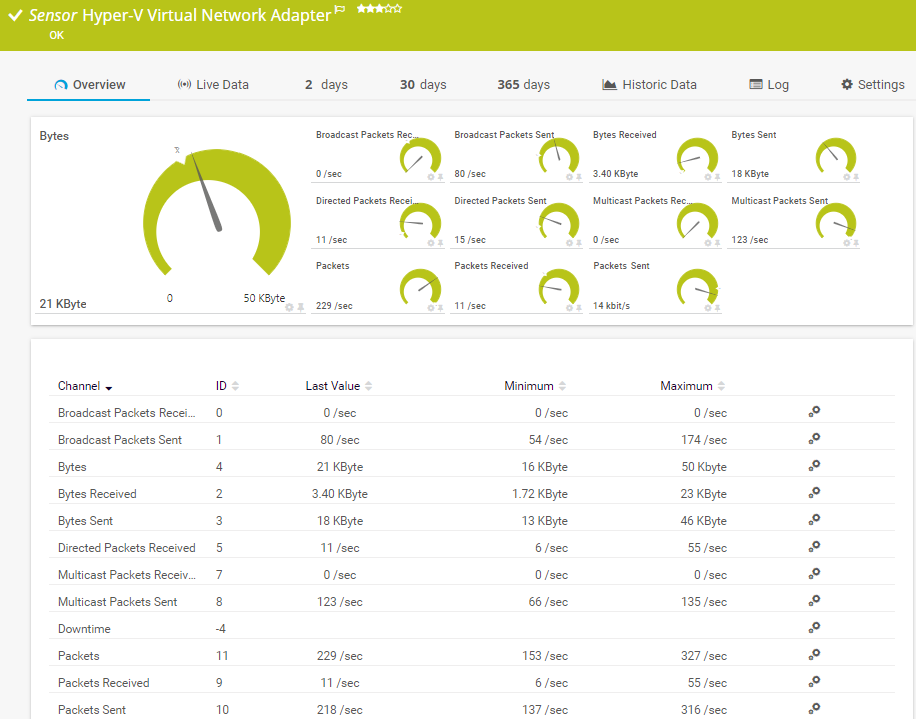
The Hyper-V Virtual Network Adapter sensor monitors virtual network adapters that run on a Microsoft Hyper-V host server via WMI or Windows performance counters. It can show the following:
See the PRTG Manual for a list of all available sensor types.

Custom alerts and data visualization let you quickly identify and prevent virtualization issues.
Set up PRTG in minutes and use it on almost any mobile device.

Paessler achieved VMware's highest level of endorsement due to our technological excellence, leading market position, and superior compatibility with VMware products.
What does this mean for you?
Partnering with innovative IT vendors, Paessler unleashes synergies to create
new and additional benefits for joined customers.
By integrating PRTG with Martello iQ, you can add a fast analytics layer to improve uptime, visualize your IT environment, and integrate all of your IT systems into a single pane of glass.
Integrating monitoring results from PRTG into NetBrain maps makes the foundation for network automation.
Siemon and Paessler bring together intelligent building technology and advanced monitoring and make your vision of intelligent buildings and data centers become reality.
Real-time notifications mean faster troubleshooting so that you can act before more serious issues occur.
Network Monitoring Software – Version 25.3.110.1313 (August 27, 2025)
Download for Windows and cloud-based version PRTG Hosted Monitor available
English, German, Spanish, French, Portuguese, Dutch, Russian, Japanese, and Simplified Chinese
Network devices, bandwidth, servers, applications, virtual environments, remote systems, IoT, and more
Choose the PRTG Network Monitor subscription that's best for you


Microsoft Hyper-V monitoring with PRTG is the process of monitoring the performance and health of Hyper-V VMs, hosts, and clusters in a Hyper-V environment. This way, IT professionals can make sure that their virtual environment is running smoothly and efficiently. Typically, Hyper-V monitoring involves keeping track of metrics such as CPU usage, memory usage, disk usage, network traffic, and more to identify issues and prevent downtime.
PRTG uses various preconfigured Hyper-V sensors to collect performance data of your virtual machines, hosts, and clusters. The collected monitoring data is consolidated on easy-to-read dashboards. PRTG also sends out real-time alerts when performance metrics fall below your defined thresholds so that you can take immediate action to resolve issues.
PRTG comes with a range of benefits, including real-time monitoring, automatic alerts, comprehensive reporting, and user-friendly dashboards. Besides Hyper-V monitoring, PRTG also allows you to monitor other network devices and applications, which gives you a complete overview of your IT infrastructure in a single monitoring tool. What’s more: PRTG is easy to set up and can be customized to meet your specific needs.
In PRTG, “sensors” are the basic monitoring elements. One sensor usually monitors one measured value in your network, for example the traffic of a switch port, the CPU load of a server, or the free space on a disk drive. On average, you need about 5-10 sensors per device or one sensor per switch port.
Paessler conducted trials in over 600 IT departments worldwide to tune its network monitoring software closer to the needs of sysadmins. The result of the survey: over 95% of the participants would recommend PRTG – or already have.

Paessler PRTG is used by companies of all sizes. Sysadmins love PRTG because it makes their job a whole lot easier.
Bandwidth, servers, virtual environments, websites, VoIP services – PRTG keeps an eye on your entire network.
Everyone has different monitoring needs. That’s why we let you try PRTG for free.