• Company
    • About Us
    • Case Studies
    • Press Center
    • Events
    • Careers
    • Blog
    • Contact us
  • Contact us
  • Login
 
  • English
    • Deutsch
    • Español
    • Français
    • Italiano
    • Português
Paessler
                    - The Monitoring Experts
  • Products
    • Paessler PRTG
      Paessler PRTGMonitor your whole IT infrastructure
      • PRTG Network Monitor
      • PRTG Enterprise Monitor
      • PRTG Hosted Monitor
      • PRTG extensionsExtensions for Paessler PRTGExtend your monitoring to a new level
    • Icon Features
      FeaturesExplore all monitoring features
      • Maps & dashboards
      • Alerts & notifications
      • Multiple user interfaces
      • Distributed monitoring
      • Customizable reporting
  • Solutions
    • Industries
      IndustriesMonitor various industry sectors
      • Industrial
      • Healthcare
      • Data Center
      • Education
      • Finance
      • Government
    • IT Topics
      IT TopicsMonitor all areas of IT
      • Network Monitoring
      • Bandwidth Monitoring
      • SNMP Monitor
      • Network Mapping
      • WiFi Monitoring
      • Server Monitoring
  • Pricing
  • Resources
    • Getting Started
      Getting StartedModules for self-paced learning
    • How-to Guides
      How-to GuidesGet the most out of PRTG
    • Videos & Webinars
      Videos & WebinarsLearn from Paessler experts
    • IT  Knowledge
      IT KnowledgeExpand your IT knowledge
    • PRTG Manual
      PRTG ManualFull documentation
    • Knowledge Base
      Knowledge BaseShare community knowledge
    • PRTG Sensor Hub
      PRTG Sensor HubGet sensors, scripts & templates
    • Trainings
      PRTG TrainingLearn how to work with PRTG
  • Partners
    • icon star
      New Partners and MSPBecome a new partner or MSP
    • icon partner
      Partner PortalLog in to your partner account
    • icon search
      Find a PartnerFind partners selling Paessler products
    • icon technology
      Technology AlliancesSee Paessler technology partnerships
  • Company
    • About Us
    • Case Studies
    • Press Center
    • Events
    • Careers
    • Blog
    • Contact us
  • Contact us
  • Login
  • English
    • Deutsch
    • Español
    • Français
    • Italiano
    • Português
  • Get a quote
  • Free trial
  1. Home>
  2. IT Topics>
  3. Hardware>
  4. Storage Monitoring
PRTG Logo

Storage Monitoring with PRTG

Keep a 24/7 eye on your storage system’s availability and performance

  • Keep track of physical and virtual storage devices, NAS, SANs, and cloud storage
  • Avoid storage capacity problems and other failures that hurt your business
  • Prevent data loss with all-in-one monitoring of your entire data storage process
Free download
product overview

Our users give top ratings for monitoring with Paessler PRTG

Gartner peer insights
spiceworks
Capterra
G2
Trustpilot

PRTG storage monitoring: What you will find on this page

Table of content
  • 4 business problems you will avoid with PRTG storage monitoring
  • What storage observability looks like in PRTG
  • 4 more reasons why to choose PRTG as your storage monitoring tool
  • Explore our preconfigured PRTG sensors for storage monitoring
  • Monitoring storage: FAQ

PRTG makes storage performance monitoring as easy as it gets

Custom alerts and data visualization let you quickly identify and prevent low storage space, data loss, and other issues with your storage environment.

Free download
PRODUCT OVERVIEW

4 business problems you will avoid with PRTG storage monitoring

Paessler PRTG helps you avoid negative business impacts due to storage problems or failures with 24/7 storage monitoring of all components – hardware as well as software, availability as well as performance and security.

Icon Temperature

Data loss through high temperature

PRTG helps you detect cooling failures before they lead to synchronous destruction of hardware components and to irreversible loss of data.

Although these systems have multiple layers of redundancy based on RAID levels and multiple disks, failures still happen without proper temperature monitoring with a tool like PRTG.

Icon Devices

Data loss through faulty hardware

PRTG helps you detect faulty hardware so it can be replaced in time to assure maximum performance and reliability for the entire system.

Although these systems can handle the loss of multiple disks without urgent problems, such failures cause performance issues and can lead to data loss on a long-term basis.

Icon Warning

Data loss through software issues

Since storage systems depend mainly on software components, even a small undetected error can become a critical failure that causes massive data loss.

PRTG helps you detect and identify the root cause of such errors, and helps preserve data integrity that is affected by backup software, databases, and virtual infrastructures.

Icon Flash

Business loss through performance problems

With PRTG, you can easily avoid disturbances  such as critical business processes that slow down because data is not available or can’t be stored in time.

Prevent problems such as a failed purchasing process in a web shop, a backup process that’s interrupted and corrupted, or a security update that fails and leaves open vulnerabilities.

What storage observability looks like in PRTG

Diagnose network issues by continuously tracking your storage systems, including virtual and physical servers, network-attached storage (NAS), storage area networks (SAN), content delivery networks (CDN), and cloud storage. Show response times, CPU and memory usage, latency, and other key metrics in real time. Visualize monitoring data in clear graphs and dashboards to identify problems more easily. Gain the overview you need to troubleshoot storage bottlenecks, low storage capacity, and unplanned downtime.

Map storage monitoring

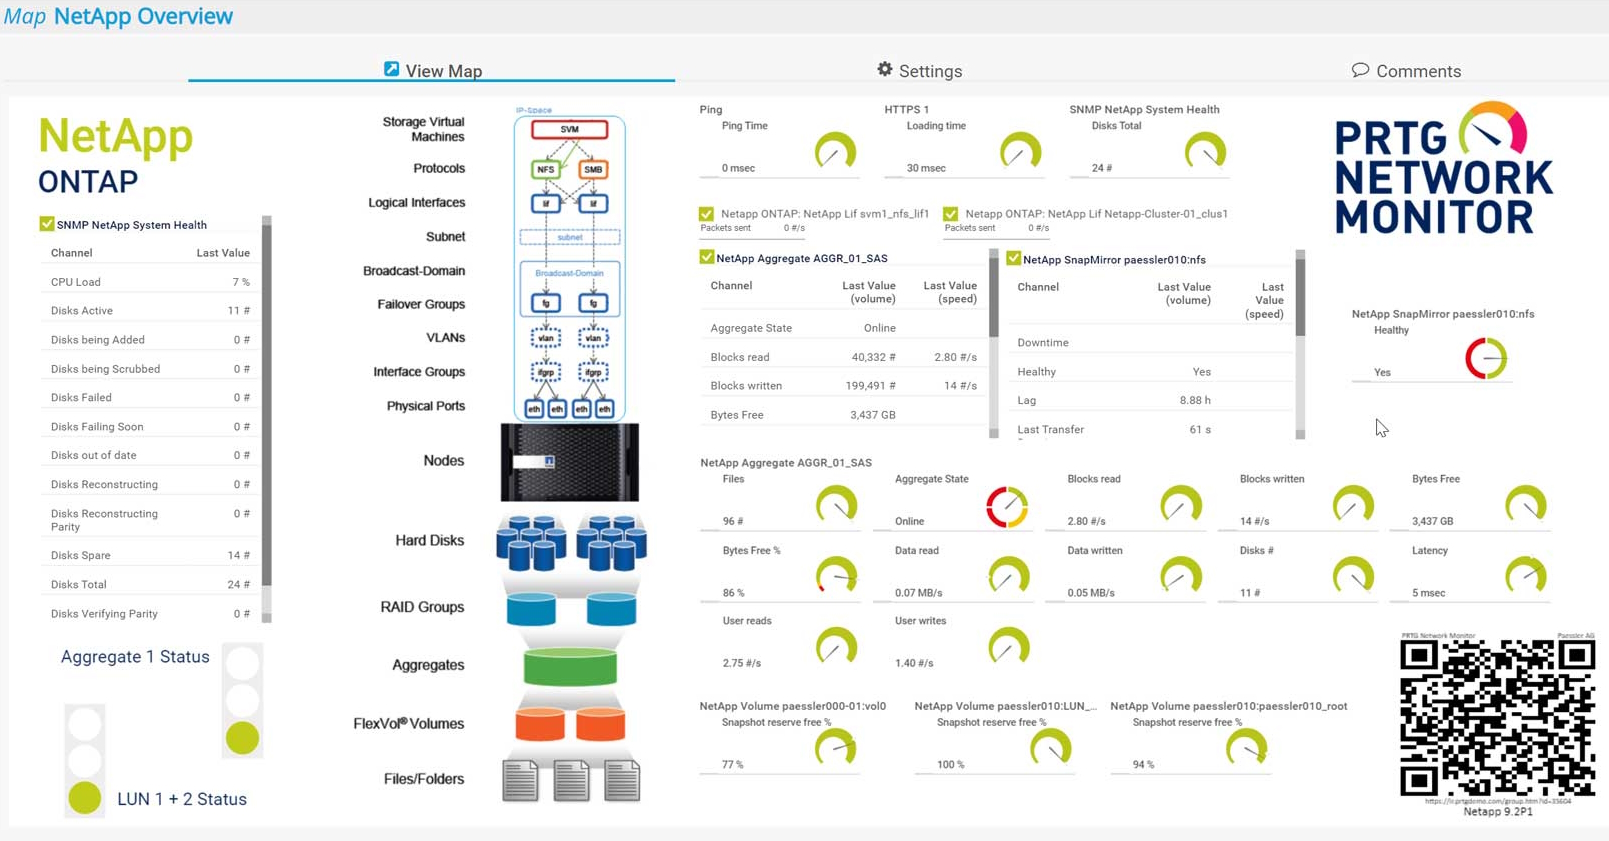
Custom PRTG dashboard for NetApp storage devices

PRTG Screenshot device tree view

Device tree view of the complete monitoring setup

PRTG screenshot map entire it infrastructure

Custom PRTG dashboard for keeping an eye on the entire IT infrastructure

PRTG screenshot graph live data traffic

Live traffic data graph in PRTG

Start monitoring your storage infrastructure with PRTG and see how it can make your network more reliable and your job easier

Free download
PRODUCT OVERVIEW

IT experts agree: Paessler PRTG is a great solution for IT infrastructure monitoring

PCMag

“All-around winning
 network monitor”

IT Brief

“The real beauty of PRTG is the endless possibilities it offers”

ITPro

“PRTG Network Monitor 
is very hard to beat”

4 more reasons why to choose PRTG as your storage monitoring tool

Icon Alarm

Real-time notifications

If your IT teams need custom alerting that only triggers a notification if necessary and just informs the responsible person and not the whole company, PRTG is what you’ll need.

Define your individual warning and error thresholds, and PRTG alerts you via SMS, email, push notification, and other methods if there is an issue so that you can step in and save the day.

Icon Plus

Wide vendor compatibility

Get out-of-the-box support for Dell EMC, NetApp, Lenovo, QNAP, IBM, HPE 3PAR, Synology, and cloud storage vendors like AWS, Azure, Google, or Microsoft.

Not what you’re looking for? Then create your custom integration for the storage provider of your choice. Your system, your rules.

Icon Boost

All-in-one network monitoring

Do away with juggling multiple monitoring tools by several vendors you use – especially if each storage system offers its individual monitoring system.

PRTG provides you with one central monitoring solution with a unified overview that lets you track your storage environment as well as your entire IT infrastructure at a glance.

Icon Eye

Beyond the storage system

PRTG monitors the entire path data takes from the source application to the final disk, folder or database where it is stored. 
This also includes keeping a 24/7 eye on network connectivity, bandwidth usage, storage resource allocation, and other IT components that play a vital role in the data storage process.

Explore our preconfigured PRTG sensors for Storage Monitoring

PRTG comes with more than 250 native sensor types for monitoring your entire on-premises, cloud, and hybrid cloud environment out of the box. Check out some examples below!

NetApp Physical Disk v2

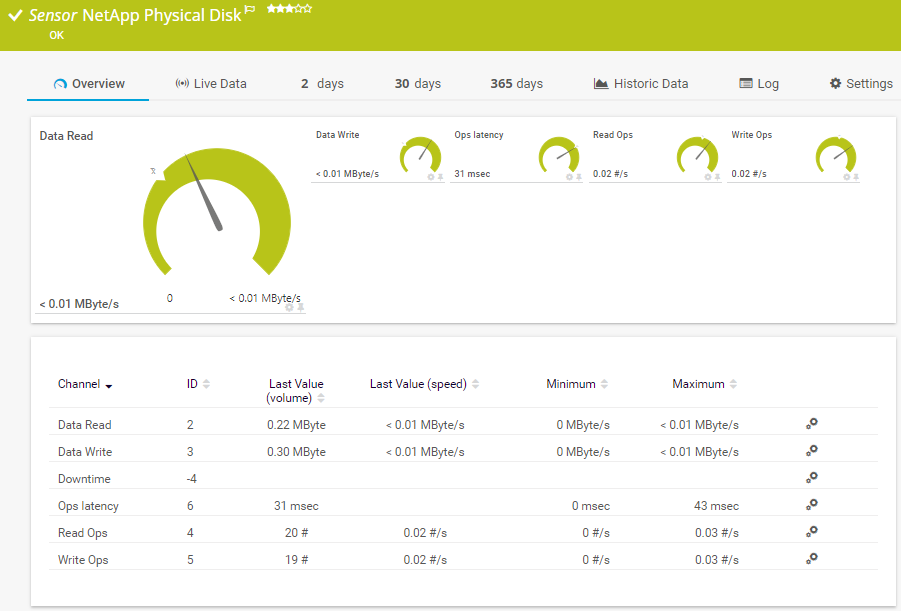
The NetApp Physical Disk v2 sensor monitors physical disks of a NetApp storage system using ONTAP. It can show the following:

  • Container type
  • Number of IOPS and path errors
  • Latency
  • Total time the disk has been spinning
  • Throughput
NetApp Physical Disk v2

HPE 3PAR Drive Enclosure

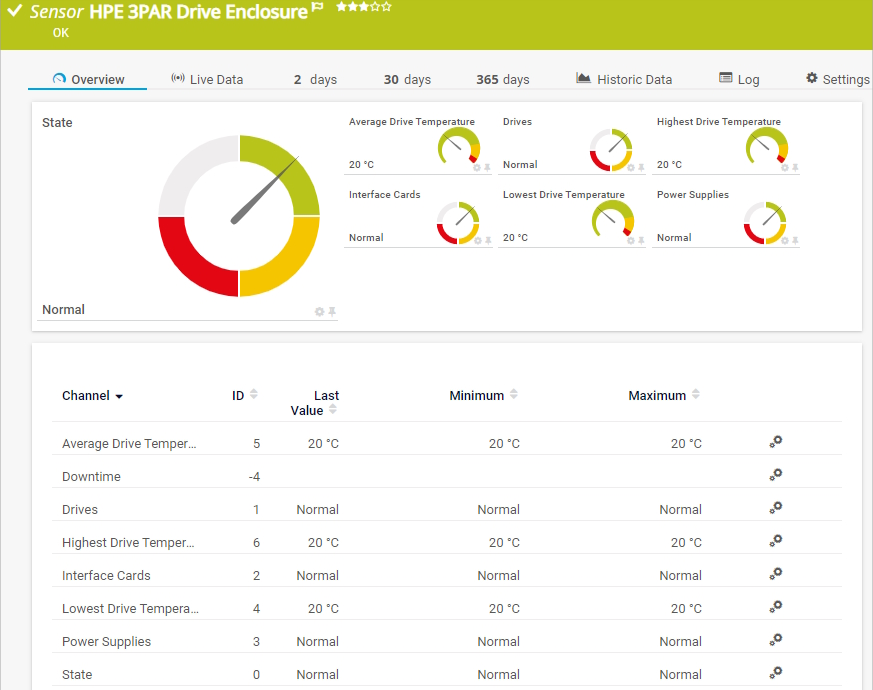
The HPE 3PAR Drive Enclosure monitors a drive enclosure of an HPE 3PAR storage system. It can show the following:

  • Average, highest, and lowest drive temperature
  • Drive and drive enclosure status
  • Interface card status
  • Power supply status
HPE 3PAR Drive Enclosure

Dell EMC Unity Storage LUN v2

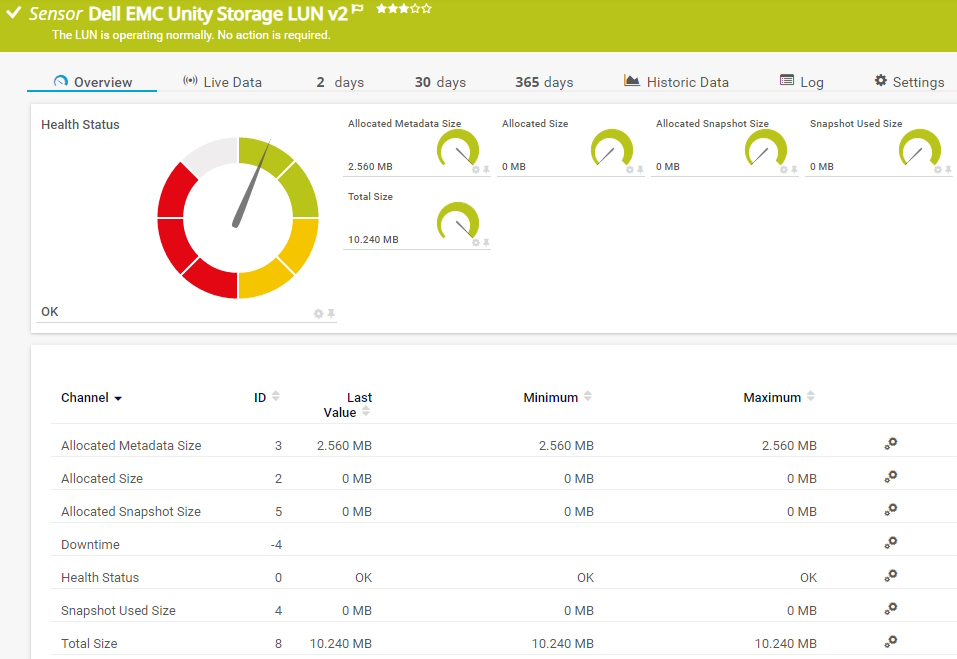
The Dell EMC Unity Storage LUN v2 sensor monitors a logical unit number (LUN) on a Dell EMC storage system. It can show the following:

  • Allocated metadata size
  • Allocated and total size
  • Allocated and used snapshot size
  • Health status
Dell EMC Unity Storage LUN

Microsoft Azure Storage Account

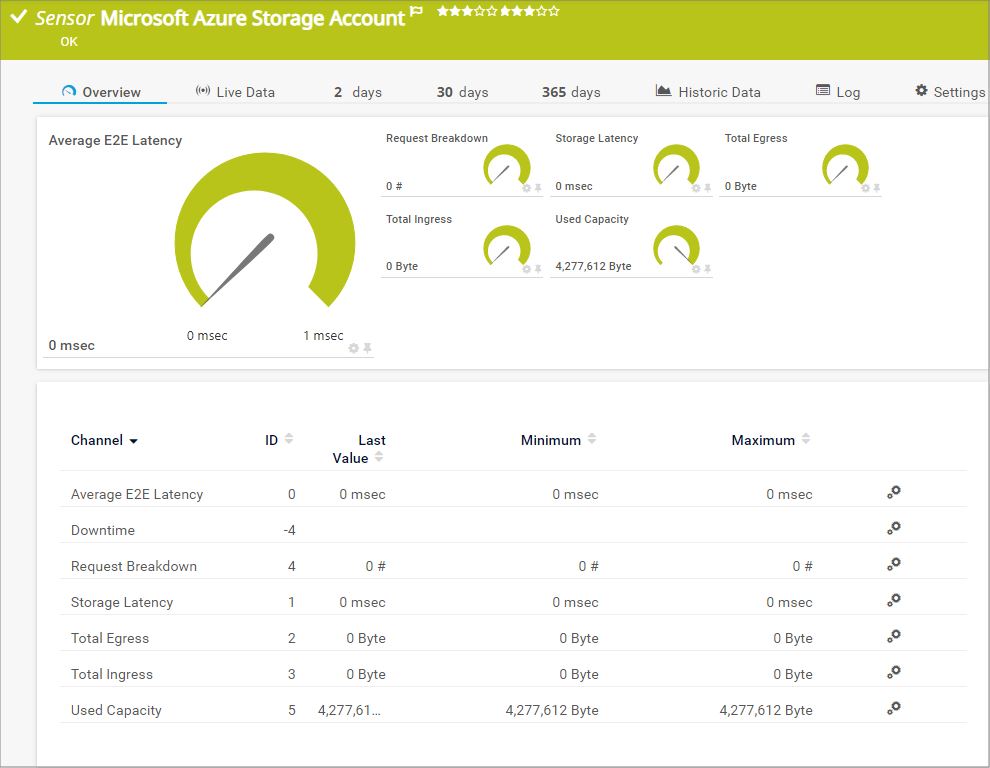
The Microsoft Azure Storage Account sensor monitors the storage account in a Microsoft Azure subscription. It can show the following:

  • Average E2E latency
  • Total number of requests made to the storage service
  • Latency of the storage
  • Total egress and ingress
  • Used capacity
Microsoft Azure Storage Account

WMI Storage Pool

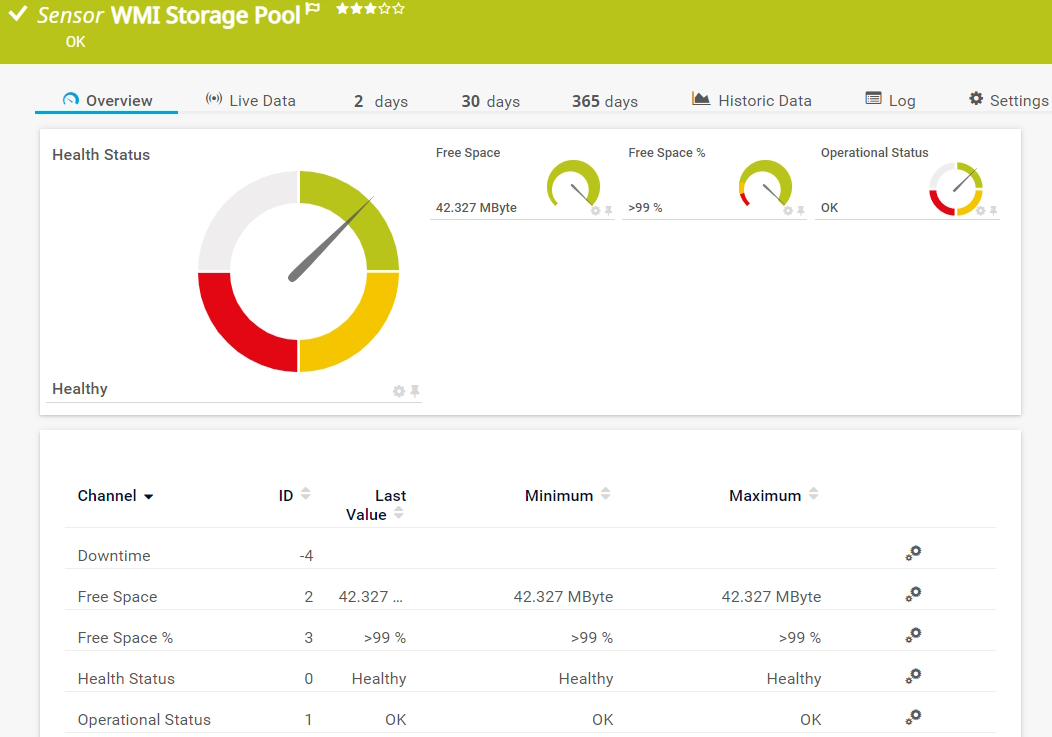
The WMI Storage Pool sensor monitors a storage pool on a Windows system. It can show the following:

  • Free space
  • Health status
  • Operational status
WMI Storage Pool
WMI Storage Pool

See the PRTG Manual for a list of all available sensor types.

PRTG is compatible with all major vendors, products, and systems

compatible with all major vendors, products, and systems

Find the root cause of the problem with our PRTG storage monitoring solution

Real-time notifications mean faster troubleshooting so that you can act before more serious issues occur.

Free download
PRODUCT OVERVIEW

“From a server perspective, we're monitoring all of the key components of our service such as CPU usage, RAM disk space, the Windows services that it's running, and network connectivity of that server. In terms of networks, we’re monitoring all of our switches, firewalls, and access points. It’s really useful to be able to easily pull performance metrics from the PRTG dashboard.”

Ollie Kerslake, Infrastructure Lead
Riverford Organic Farmers

“The tool has given us greater control over all types of devices connected to the network (switches, IP telephony, security cameras, IoT, WiFi) that previously remained opaque when dealing with service incidents. This has improved our ability to diagnose and resolve problems, which has translated into greater efficiency and a better user experience in both internal and public services.”

Jordi Tolosà Bel, New Technologies Technician
Vinaroz City Council

“Our objective was to be able to monitor the health of our most critical servers containing data and applications, but also the flows and bandwidth between headquarters, our 50 servers in the cloud and the 15 servers at our production sites. For us, it is essential to have a proactive approach to understand where the weaknesses of the IT system are to be able to improve them.”

Marc Boullier, CIO
Carambar & Co

Your storage monitor at a glance – even on the go

PRTG is set up in a matter of minutes and can be used on a wide variety of mobile devices.

device overview
NetApp

We are a NetApp Alliance Partner

For NetApp, Paessler has proven to be one of the qualified, best-of-breed infrastructure and application providers whose products have been tested to expertly integrate with NetApp storage systems.

What does this mean for you?

  • Easy integration of NetApp hardware and software with PRTG
  • State-of-the-art features for monitoring your NetApp environment
  • Expert technical support around your NetApp monitoring setup

Create innovative solutions with Paessler’s IT partners

Partnering with innovative IT vendors, Paessler unleashes synergies to create
new and additional benefits for joined customers.

baramundi

baramundi

baramundi and PRTG create a secure, reliable and powerful IT infrastructure where you have everything under control - from the traffic in your firewall to the configuration of your clients.

Read more
KnowledgeRiver

KnowledgeRiver

Combining their tools to a powerful solution for advanced analysis and automation, KnowledgeRiver and Paessler enable IT teams to ensure best performance for their infrastructure and networks.

Read more
Siemon

Siemon

Siemon and Paessler bring together intelligent building technology and advanced monitoring and make your vision of intelligent buildings and data centers become reality.

Read more

PRTG makes storage performance monitoring as easy as it gets

Custom alerts and data visualization let you quickly identify and prevent low storage space, data loss, and other issues with your storage environment.

Free download
PRODUCT OVERVIEW
Paessler PRTG

Paessler PRTG

Network Monitoring Software – Version 24.4.102.1351 (November 12th, 2024)

Hosting icon

Hosting

Download for Windows and cloud-based version PRTG Hosted Monitor available

Languages icon

Languages

English, German, Spanish, French, Portuguese, Dutch, Russian, Japanese, and Simplified Chinese

test

Monitor everything

Network devices, bandwidth, servers, applications, virtual environments, remote systems, IoT, and more

test

Pricing

Choose the PRTG Network Monitor subscription that's best for you

Discover more monitoring insights and stories

Resources Solution

Solutions for all your monitoring needs

  • SAN monitoring
  • Storage Performance Monitoring
  • Storage capacity planning
Resources Content

Powerful stories from the monitoring world

  • Storage performance monitoring
  • Why You Definitely Need to Monitor Your Storage Infrastructure
  • Paessler Blog - All about IT, Monitoring, and PRTG
Resources Solutions

Resources to master your monitoring challenges

  • Microsoft Azure Storage Account Sensor
  • Dell OpenManage Storage monitoring - overall status og virtual disk
  • How do I monitor SharePoint storage for low space?

Storage Monitoring: FAQ


What types of storage are there?

There are several types of storage, typically categorized based on the technology, purpose, or use case. Here's an overview:

  • Hard disk drives (HDD), solid-state drives (SSD), and NVMe drives
  • Optical storage such as CDs and DVDs
  • Direct-attached storage (DAS): Storage directly connected to a single computer (e.g., internal/external drives)
  • Network-attached storage (NAS): A dedicated storage device accessible over a network
  • Storage area network (SAN): A high-performance network that connects servers to shared storage
  • Cloud storage (Google Drive, Microsoft OneDrive, Dropbox, AWS)
What is storage monitoring?

Storage monitoring refers to the process of tracking, analyzing, and managing the performance, capacity, and health of storage systems to ensure optimal functionality and efficiency. This involves using tools or software to provide visibility into various storage resources, such as disks, arrays, or cloud-based storage, and helps identify and resolve potential issues before they become critical.

Key aspects of storage monitoring include:

  • Tracking the input/output operations per second (IOPS), latency, and throughput
  • Ensuring that storage systems can handle workloads efficiently without bottlenecks
  • Monitoring the amount of storage space available and in use
  • Preventing storage shortages or over-provisioning with informed storage capacity planning
  • Checking the status of hardware components like disks, arrays, or RAID configurations
  • Monitoring unauthorized access or unusual activity that could indicate a breach.
Why should I monitor my storage systems?

Monitoring storage systems is important for several reasons, including:

  • Proactive maintenance: Identifies issues before they impact users, preventing downtime.
  • Improved performance: Ensures that storage systems operate at peak efficiency by detecting bottlenecks and keeping an eye on different performance metrics
  • Cost savings: Prevents unnecessary purchases by providing insights into storage utilization.
  • Scalability: Helps plan for future storage needs based on usage trends.
  • Data protection: Minimizes the risk of data loss by monitoring health and redundancy mechanisms.
How can I optimize the performance of my storage infrastructure with PRTG?

PRTG is a comprehensive network monitoring tool that can be effectively used to optimize the performance of your storage infrastructure. It can keep an eye on storage metrics such as disk I/O, latency, disk usage, RAID health, storage array performance, or cache utilization. Its real-time alerts and custom notifications help you proactively solve issues with your storage setup. What’s more: With PRTG’s wealth of historical data and in-depth reporting, it can help you with storage capacity planning and workload distribution.

What is a sensor in PRTG?

In PRTG, “sensors” are the basic monitoring elements. One sensor usually monitors one measured value in your network, for example the traffic of a switch port, the CPU load of a server, or the free space on a disk drive. On average, you need about 5-10 sensors per device or one sensor per switch port.

We asked: would you recommend PRTG? Over 95% of our customers say yes!

Paessler conducted trials in over 600 IT departments worldwide to tune its network monitoring software closer to the needs of sysadmins. The result of the survey: over 95% of the participants would recommend PRTG – or already have.

recommendation

Still not convinced?

Love

More than 500,000 sysadmins love PRTG

Paessler PRTG is used by companies of all sizes. Sysadmins love PRTG because it makes their job a whole lot easier.

PRTG

Monitor your entire IT infrastructure

Bandwidth, servers, virtual environments, websites, VoIP services – PRTG keeps an eye on your entire network.

test

Try Paessler PRTG for free

Everyone has different monitoring needs. That’s why we let you try PRTG for free.

PRTG Logo

Start monitoring your storage infrastructure with PRTG and see how it can make your network more reliable and your job easier

Free download
PRODUCT OVERVIEW

Products

  • Paessler PRTG
    Paessler PRTGMonitor your whole IT infrastructure
    • PRTG Network Monitor
    • PRTG Enterprise Monitor
    • PRTG Hosted Monitor
  • PRTG extensions
    Extensions for Paessler PRTGExtend your monitoring to a new level
  • Icon Features
    FeaturesExplore all monitoring features

Monitoring with PRTG

  • Network monitoring
  • Bandwidth monitoring
  • SNMP monitoring
  • Network mapping
  • Wi-Fi monitoring
  • Server monitoring
  • Network traffic analyzer
  • NetFlow monitoring
  • Syslog server

Useful Links

  • PRTG Manual
  • Knowledge Base
  • Customer Success Stories
  • About Paessler
  • Subscribe to newsletter
  • PRTG Support
  • PRTG Consulting

Contact

Paessler GmbH
Thurn-und-Taxis-Str. 14, 
90411 Nuremberg 
Germany

info@paessler.com

+49 911 93775-0

  • Contact us
©2025 Paessler GmbHTerms & ConditionsPrivacy PolicyImprintReport VulnerabilityDownload & InstallSitemap
404 - Page not found 404 - Page not found 404 - Page not found