• Company
    • About Us
    • Case Studies
    • Press Center
    • Events
    • Careers
    • Blog
    • Contact us
  • Login
 
  • English
    • Deutsch
    • Español
    • Français
    • Italiano
    • Português
Paessler
                    - The Monitoring Experts
  • Products
    • Paessler PRTG
      Paessler PRTGMonitor your whole IT infrastructure
      • PRTG Network Monitor
      • PRTG Enterprise Monitor
      • PRTG Hosted Monitor
      • PRTG extensionsExtensions for Paessler PRTGExtend your monitoring to a new level
    • Icon Features
      FeaturesExplore all monitoring features
      • Maps & dashboards
      • Alerts & notifications
      • Multiple user interfaces
      • Distributed monitoring
      • Customizable reporting
  • Solutions
    • Industries
      IndustriesMonitor various industry sectors
      • Industrial
      • Healthcare
      • Data Center
      • Education
      • Finance
      • Government
    • IT Topics
      IT TopicsMonitor all areas of IT
      • Network Monitoring
      • Bandwidth Monitoring
      • SNMP Monitor
      • Network Mapping
      • WiFi Monitoring
      • Server Monitoring
  • Pricing
  • Resources
    • Getting Started
      Getting StartedModules for self-paced learning
    • How-to Guides
      How-to GuidesGet the most out of PRTG
    • Videos & Webinars
      Videos & WebinarsLearn from Paessler experts
    • IT  Knowledge
      IT KnowledgeExpand your IT knowledge
    • PRTG Manual
      PRTG ManualFull documentation
    • Knowledge Base
      Knowledge BaseShare community knowledge
    • PRTG Sensor Hub
      PRTG Sensor HubGet sensors, scripts & templates
    • Trainings
      PRTG TrainingLearn how to work with PRTG
  • Partners
    • icon star
      New Partners and MSPBecome a new partner or MSP
    • icon partner
      Partner PortalLog in to your partner account
    • icon search
      Find a PartnerFind partners selling Paessler products
    • icon technology
      Technology AlliancesSee Paessler technology partnerships
  • Company
    • About Us
    • Case Studies
    • Press Center
    • Events
    • Careers
    • Blog
    • Contact us
  • Login
  • English
    • Deutsch
    • Español
    • Français
    • Italiano
    • Português
  • Get a quote
  • Free trial
  1. Home>
  2. IT Topics>
  3. Virtualization>
  4. Hypervisor Monitoring Tool
PRTG Logo

Hypervisor Monitoring with PRTG

Enjoy full control of your hypervisor environment

  • Monitor in real-time for faster troubleshooting
  • Simplify resource utilization and allocation tracking
  • Optimize virtual machine performance and uptime
Free download
product overview

Our users give top ratings for monitoring with Paessler PRTG

Gartner peer insights
spiceworks
Capterra
G2
Trustpilot

PRTG hypervisor monitoring: What you will find on this page

Table of content
  • Efficient hypervisor monitoring with PRTG
  • What hypervisor monitoring looks like in PRTG
  • 3 reasons why PRTG is the hypervisor monitoring tool of your choice
  • Preconfigured sensors for hypervisor monitoring
  • Hypervisor Monitoring: FAQ

PRTG makes hypervisor monitoring as easy as it gets

Custom alerts and data visualization let you quickly identify and prevent performance issues.

Free download
PRODUCT OVERVIEW

Efficient hypervisor monitoring with PRTG

With Paessler PRTG, IT teams get an overview of hypervisor health, performance, and resource usage. Our solution helps you visualize real-time metrics, troubleshoot bottlenecks, and optimize your virtual environment for uninterrupted operations.

Monitoring

Gain complete visibility of your virtual environment

With PRTG, you get a comprehensive view of your entire virtualization setup. You can easily monitor CPU load, memory usage, and network utilization for both physical and virtual servers. This holistic approach helps you quickly identify and resolve issues across your virtualized infrastructure.

Alerts

Receive instant alerts for real-time problem solving

PRTG provides you with real-time monitoring and immediate notifications for any failures in your virtual environment. You'll be alerted instantly about issues with hosts, guests, or applications, allowing you to take swift action and minimize downtime.

Licensing

Leverage a flexible and cost-effective solution

You'll find PRTG to be a versatile and budget-friendly monitoring tool. With pricing based on sensor count and each sensor capable of tracking numerous metrics, you can efficiently monitor your entire virtual infrastructure without breaking the bank.

What hypervisor monitoring looks like in PRTG

Diagnose network issues by continuously tracking hypervisor performance. Show CPU usage, memory usage, and other key metrics in real time. Visualize monitoring data in clear graphs and dashboards to identify problems more easily. Gain the overview you need to troubleshoot performance bottlenecks within your hypervisor infrastructure.

PRTG Screenshot device tree view

Device tree view of the complete monitoring setup

PRTG screenshot map entire it infrastructure

Custom PRTG dashboard for keeping an eye on the entire IT infrastructure

PRTG screenshot graph live data traffic

Live traffic data graph in PRTG

Start monitoring your hypervisor with PRTG and see how it can make your network more reliable and your job easier.

Free download
PRODUCT OVERVIEW

IT experts agree: Paessler PRTG is a great solution for IT infrastructure monitoring

PCMag

“All-around winning
 network monitor”

IT Brief

“The real beauty of PRTG is the endless possibilities it offers”

ITPro

“PRTG Network Monitor 
is very hard to beat”

3 reasons why PRTG is the hypervisor monitoring tool of your choice

Licensing

Flexible licensing

PRTG offers a flexible subscription model tailored to different environments. Whether you are managing small or large IT infrastructures, our pricing adapts to your needs.

Support

Comprehensive support

With PRTG, you gain access to extensive support options and documentation. Our global customer support team ensures you’re always up and running with the best practices in monitoring.

Integration

Easy integration

PRTG integrates seamlessly with your existing systems and virtual platforms like VMware and Hyper-V. This ensures quick setup and immediate functionality in your virtualized infrastructure.

Explore our preconfigured PRTG sensors for hypervisor monitoring

PRTG comes with more than 250 native sensor types for monitoring your entire on-premises, cloud, and hybrid cloud environment out of the box. Check out some examples below!

Hyper-V Host Server

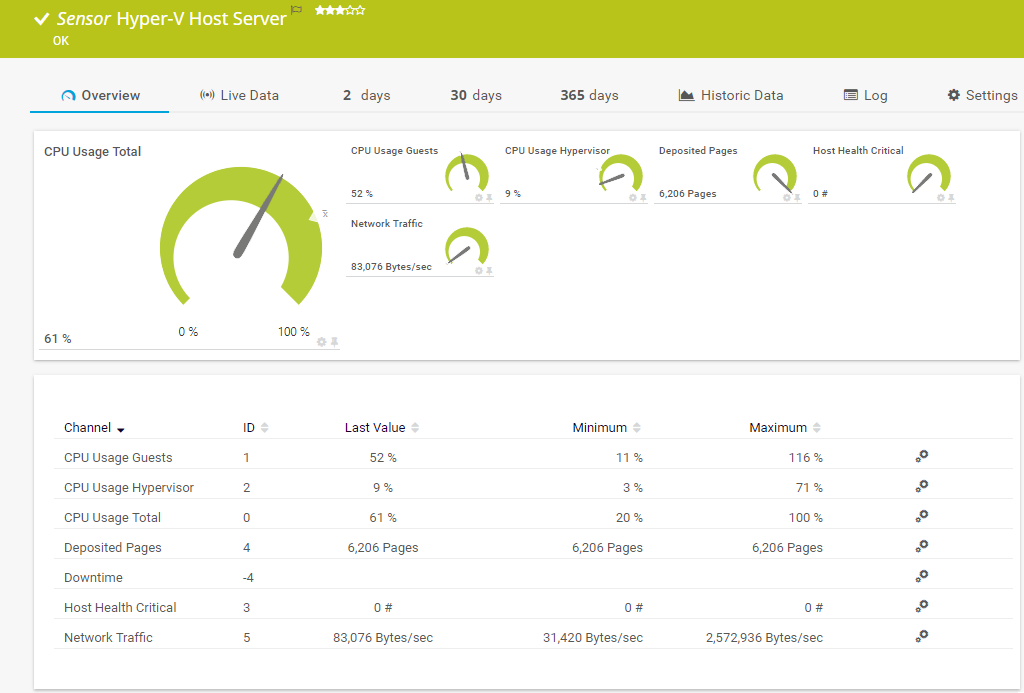
The Hyper-V Host Server sensor monitors a Microsoft Hyper-V host server via WMI or Windows performance counters. It can show the following:

  • CPU usage of the hypervisor, the guests, and in total
  • Network traffic
  • Number of deposited pages
  • Number of host health-critical values
Hyper-V Host Server
Hyper-V Host Server

SNMP Nutanix Hypervisor

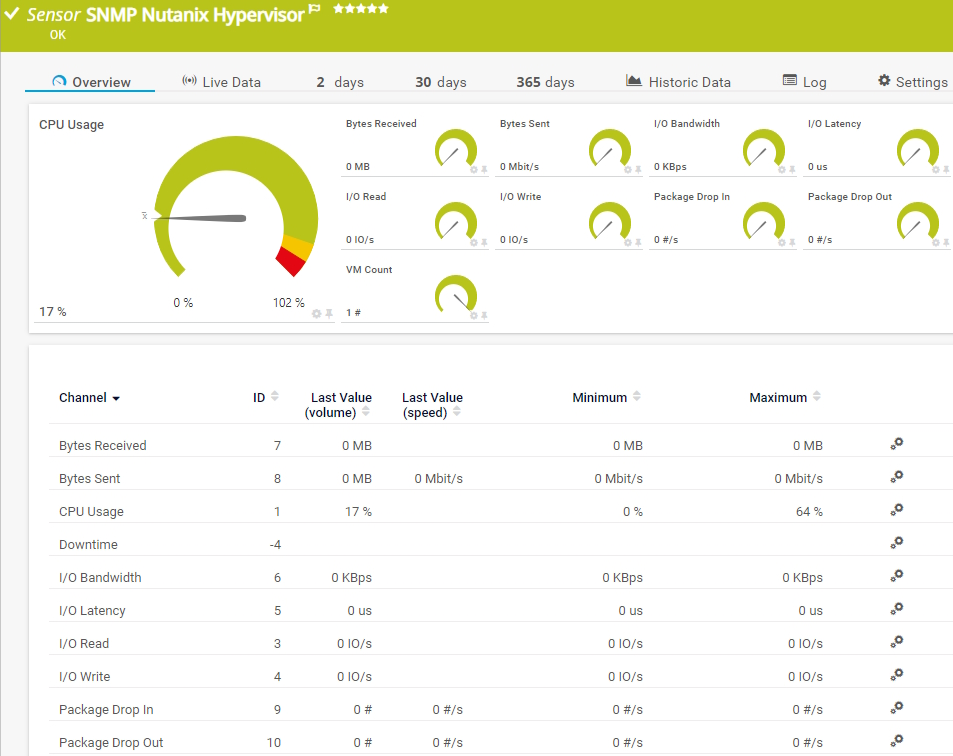
The SNMP Nutanix Hypervisor sensor monitors a Nutanix hypervisor. It can show the following:

  • Number of bytes sent and received
  • CPU usage
  • Bandwidth, latency, and read and write speed of I/O operations
  • Number of dropped incoming and outgoing packages
  • Number of VMs
SNMP Nutanix Hypervisor

VMware Host Hardware (WBEM)

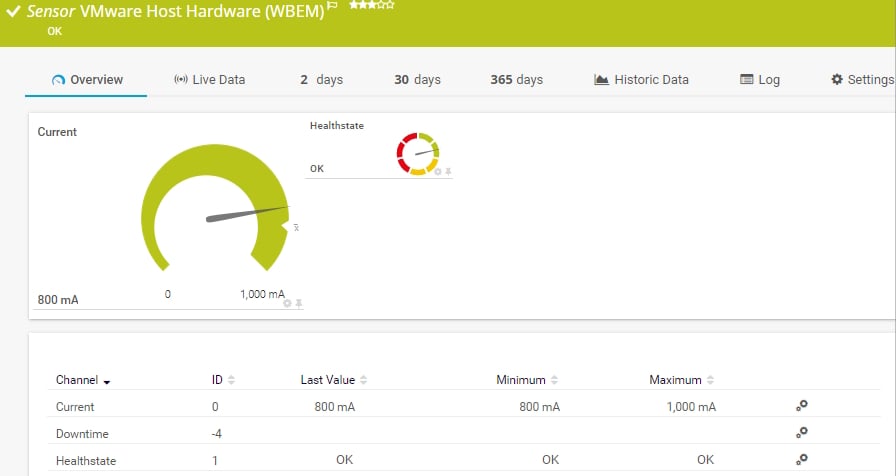
The VMware Host Hardware (WBEM) sensor monitors information about the hardware of an ESXi server using Web-based Enterprise Management (WBEM). It can show the following:

  • The current
  • Health status
  • Average host power status
  • Fan RPM
  • Temperature
Mware Host Hardware (WBEM

Citrix XenServer Host

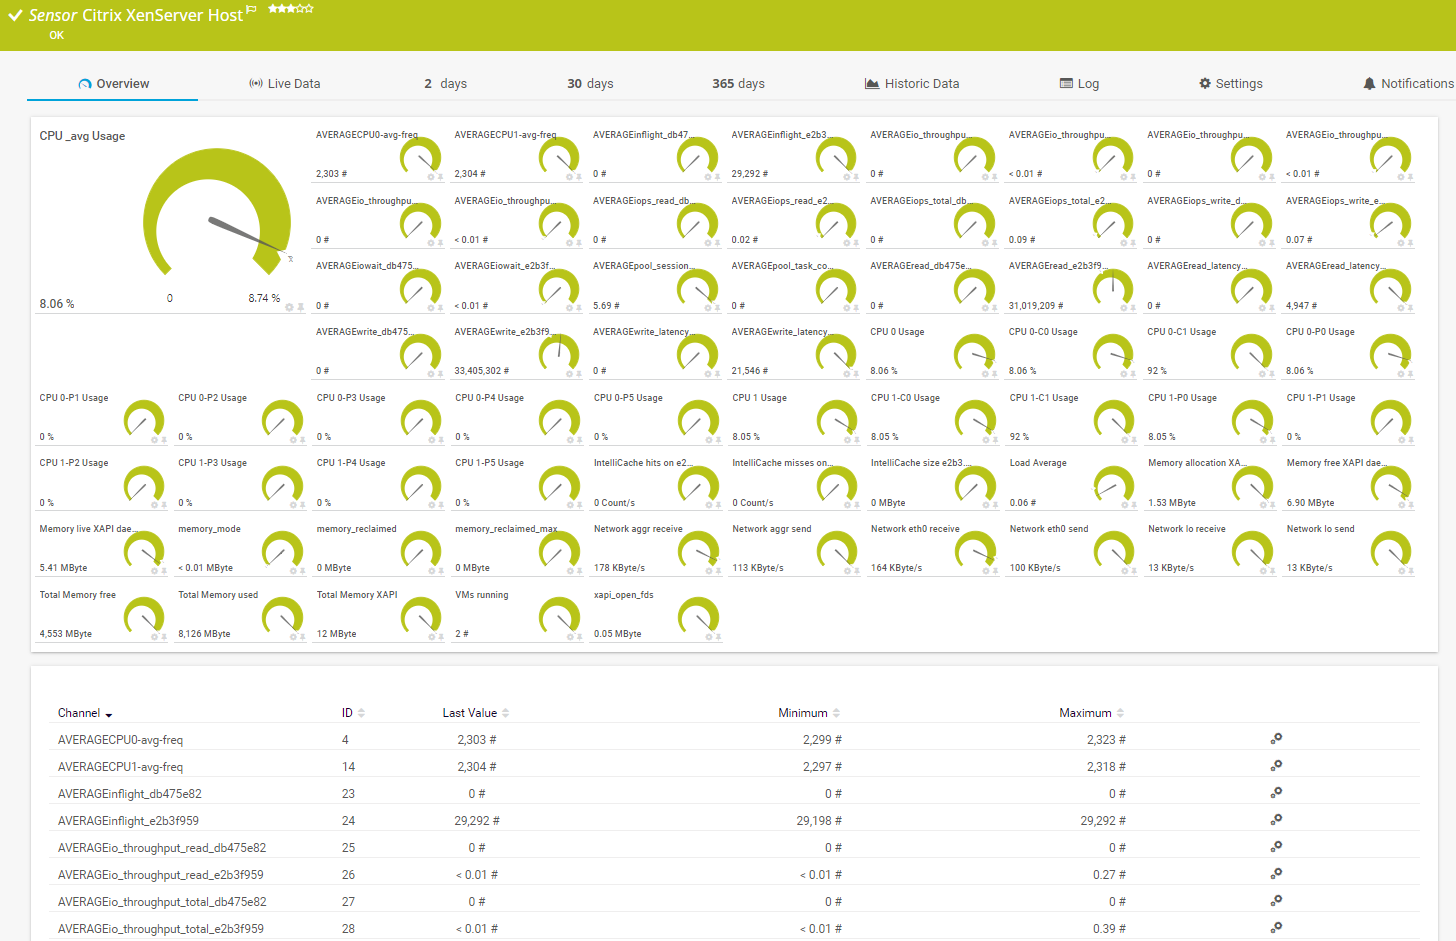
The Citrix XenServer Host sensor monitors a Xen host server via HTTP. It can show the following:

  • CPU usage
  • Load average amount
  • Number of running virtual machines
  • Total available and used memory
Citrix XenServer Host

See the PRTG Manual for a list of all available sensor types.

PRTG is compatible with all major vendors, products, and systems

compatible with all major vendors, products, and systems

PRTG makes hypervisor monitoring as easy as it gets

Custom alerts and data visualization let you quickly identify and prevent performance issues.

Free download
PRODUCT OVERVIEW

“With PRTG, you get a centralized, intuitive, all-in-one tool that monitors the entire infrastructure. In the event of an error, the software immediately informs you by email. If you don’t hear from PRTG, you can sit back and relax, knowing everything is in order. Shortly after implementing PRTG, we were able to identify and eliminate performance bottlenecks in our VMware environment and load problems in our network.”

Steffen Ille, Head of Infrastructure, Service Center for Computer Systems and Communication
Bauhaus University Weimar

“The demands on our entire IT infrastructure have grown steadily in recent years. An important step towards the optimization of this environment involved the virtualization of our digital landscape. In order to maintain the required transparency and the uninterrupted performance of all our systems, we needed a powerful network monitoring tool. For us, the most important selection criteria were price-performance ratio and ease of use. PRTG met all our expectations and has proven to be an indispensable part of our network management.”

Daniel Baumgartner, Network Administrator
Volkswind

Your hypervisor monitor at a glance – even on the go

PRTG is set up in a matter of minutes and can be used on a wide variety of mobile devices.

device overview
vmware

We are a VMware Technology Alliance Partner

Paessler achieved VMware's highest level of endorsement due to our technological excellence, leading market position, and superior compatibility with VMware products.

What does this mean for you?

  • Easy integration of VMware components with PRTG
  • State-of-the-art features for monitoring your virtual environment
  • Expert technical support around your VMware monitoring setup

Create innovative solutions with Paessler’s IT partners

Partnering with innovative IT vendors, Paessler unleashes synergies to create
new and additional benefits for joined customers.

Martello

Martello 

By integrating PRTG with Martello iQ, you can add a fast analytics layer to improve uptime, visualize your IT environment, and integrate all of your IT systems into a single pane of glass.

Read more
NetBrain

NetBrain

Integrating monitoring results from PRTG into NetBrain maps makes the foundation for network automation.

Read more
Siemon

Siemon

Siemon and Paessler bring together intelligent building technology and advanced monitoring and make your vision of intelligent buildings and data centers become reality.

Read more

Find the root cause of the problem with our PRTG hypervisor monitoring solution

Real-time notifications mean faster troubleshooting so that you can act before more serious issues occur.

Free download
PRODUCT OVERVIEW
Paessler PRTG

Paessler PRTG

Network Monitoring Software – Version 24.4.102.1351 (November 12th, 2024)

Hosting icon

Hosting

Download for Windows and cloud-based version PRTG Hosted Monitor available

Languages icon

Languages

English, German, Spanish, French, Portuguese, Dutch, Russian, Japanese, and Simplified Chinese

test

Monitor everything

Network devices, bandwidth, servers, applications, virtual environments, remote systems, IoT, and more

test

Pricing

Choose the PRTG Network Monitor subscription that's best for you

Hypervisor Monitoring: FAQ


What is hypervisor monitoring?

Hypervisor monitoring is the process of tracking the performance and health of virtual machines (VMs), hosts, and clusters in a virtualized environment. It allows IT professionals to ensure their virtual infrastructure is running efficiently and to quickly identify and resolve any issues that may arise.

Why is hypervisor monitoring important?

Hypervisor monitoring is crucial because it helps maintain the stability and performance of your virtual environment. It allows you to detect potential bottlenecks in your data center's hardware layer that might impact your virtual servers. By continuously monitoring your virtualized infrastructure, you can proactively address issues, optimize resource allocation, and ensure smooth operation of your business-critical applications.

How does Paessler PRTG monitor hypervisors like VMware and Microsoft Hyper-V?

PRTG uses preconfigured sensor types for major virtualization platforms such as VMware and Microsoft Hyper-V. It doesn't require any agents to be installed on ESXi, vCenter, Hyper-V, or your VMs. PRTG can monitor different aspects of your virtual environment, including the performance of VMs, hosts, and even VMs that have been moved by Live Migration in Hyper-V clusters.

What performance metrics can be tracked with PRTG for hypervisor monitoring?

PRTG can monitor a wide range of metrics for hypervisors. For Hyper-V, it offers five out-of-the-box sensors that track the health status of the Hyper-V infrastructure. These include CPU usage, memory utilization, network performance, and disk I/O metrics for both hosts and VMs. For VMware environments, PRTG can pull various VMware-specific metrics that are extremely useful for monitoring vSphere infrastructure.

How can PRTG help optimize a Hyper-V environment?

PRTG helps optimize Hyper-V environments by providing comprehensive visibility into your virtual infrastructure. It allows you to monitor the performance of Hyper-V VMs, hosts, and clusters. With PRTG, you can track resource usage, identify overloaded or underutilized VMs, and make informed decisions about resource allocation. The tool's real-time monitoring and alerting capabilities help you quickly respond to issues, ensuring optimal performance of your Hyper-V environment.

Does PRTG support hypervisor monitoring across multiple platforms?

Yes, PRTG supports hypervisor monitoring across multiple platforms. It offers preconfigured sensor types for most major virtualization platforms, including VMware, Microsoft Hyper-V, Citrix XenServer, and Microsoft Azure. This multi-platform support allows you to monitor diverse virtual environments from a single interface, making it easier to manage complex, heterogeneous infrastructures.

What is a sensor in PRTG?

In PRTG, “sensors” are the basic monitoring elements. One sensor usually monitors one measured value in your network, for example the traffic of a switch port, the CPU load of a server, or the free space on a disk drive. On average, you need about 5-10 sensors per device or one sensor per switch port.

We asked: would you recommend PRTG? Over 95% of our customers say yes!

Paessler conducted trials in over 600 IT departments worldwide to tune its network monitoring software closer to the needs of sysadmins. The result of the survey: over 95% of the participants would recommend PRTG – or already have.

recommendation

Still not convinced?

Love

More than 500,000 sysadmins love PRTG

Paessler PRTG is used by companies of all sizes. Sysadmins love PRTG because it makes their job a whole lot easier.

PRTG

Monitor your entire IT infrastructure

Bandwidth, servers, virtual environments, websites, VoIP services – PRTG keeps an eye on your entire network.

test

Try Paessler PRTG for free

Everyone has different monitoring needs. That’s why we let you try PRTG for free.

PRTG Logo

Start monitoring your hypervisor with PRTG and see how it can make your network more reliable and your job easier.

Free download
PRODUCT OVERVIEW

Products

  • Paessler PRTG
    Paessler PRTGMonitor your whole IT infrastructure
    • PRTG Network Monitor
    • PRTG Enterprise Monitor
    • PRTG Hosted Monitor
    • PRTG extensions
      Extensions for Paessler PRTGExtend your monitoring to a new level
  • Icon Features
    FeaturesExplore all monitoring features

Monitoring with PRTG

  • Network monitoring
  • Bandwidth monitoring
  • SNMP monitoring
  • Network mapping
  • Wi-Fi monitoring
  • Server monitoring
  • Network traffic analyzer
  • NetFlow monitoring
  • Syslog server

Useful Links

  • PRTG Manual
  • Knowledge Base
  • Customer Success Stories
  • About Paessler
  • Subscribe to newsletter
  • PRTG Support
  • PRTG Consulting

Contact

Paessler GmbH
Thurn-und-Taxis-Str. 14, 
90411 Nuremberg 
Germany

info@paessler.com

+49 911 93775-0

  • Contact us
©2025 Paessler GmbHTerms & ConditionsPrivacy PolicyImprintReport VulnerabilityDownload & InstallSitemap
404 - Page not found 404 - Page not found 404 - Page not found