Custom alerts and data visualization let you quickly identify and prevent issues with your SNMP-enabled devices.
Efficiently manage and monitor your network with SNMP and Paessler PRTG. Our solution is designed to simplify your network management tasks, ensuring a smooth operation and performance of your network devices.
Get a detailed view of network traffic and server performance. PRTG utilizes SNMP (you can choose from SNMP versions SNMP v1, SNMP v2c, and SNMP v3) to monitor your servers effectively and gain real-time data.
With the SNMP Traffic sensor, SNMP Hardware Status sensor, and SNMP Custom sensor – to name just three of our many preconfigured SNMP sensor types – PRTG lets you keep a close eye on data flow, hardware functionality, and custom parameters tailored to your specific needs.
Stay ahead of potential issues with PRTG’s automated alarm system. This feature promptly notifies you about server errors or unusual activities detected via SNMP, allowing you to respond quickly and maintain network integrity.
You can even set custom warning and error thresholds to tailor alerting with PRTG exactly to your needs. This way, unnecessary alert noise will quickly become a thing of the past.
Windows Servers, mail servers, database servers, storage servers of all the biggest manufacturers usually support SNMP – and setting up PRTG SNMP monitoring is a hassle-free process.
Enable and configure SNMP on your servers, and benefit from PRTG’s automatic network discovery to automatically add your servers and suitable sensors to your monitoring setup. Or use our straightforward, easy-to-follow instructions to manually add the SNMP sensors you need via complete MIB files or single OIDs.
Your IT security framework needs to be bolstered, and one big way is to make sure your company can use it by monitoring the availability and health of SNMP-compatible servers, firewalls, routers, and switches in real time.
This continuous surveillance helps identify and mitigate potential security threats, such as open ports vulnerable to attacks or firewalls that are down and thus not doing their job.
Diagnose network issues by continuously tracking your servers and monitoring network devices using SNMP (and other protocols like WMI or flow. Show availability, traffic stats, and other key metrics in real time. Visualize monitoring data in clear graphs and dashboards to identify problems more easily. Gain the overview you need to troubleshoot server issues and outages.
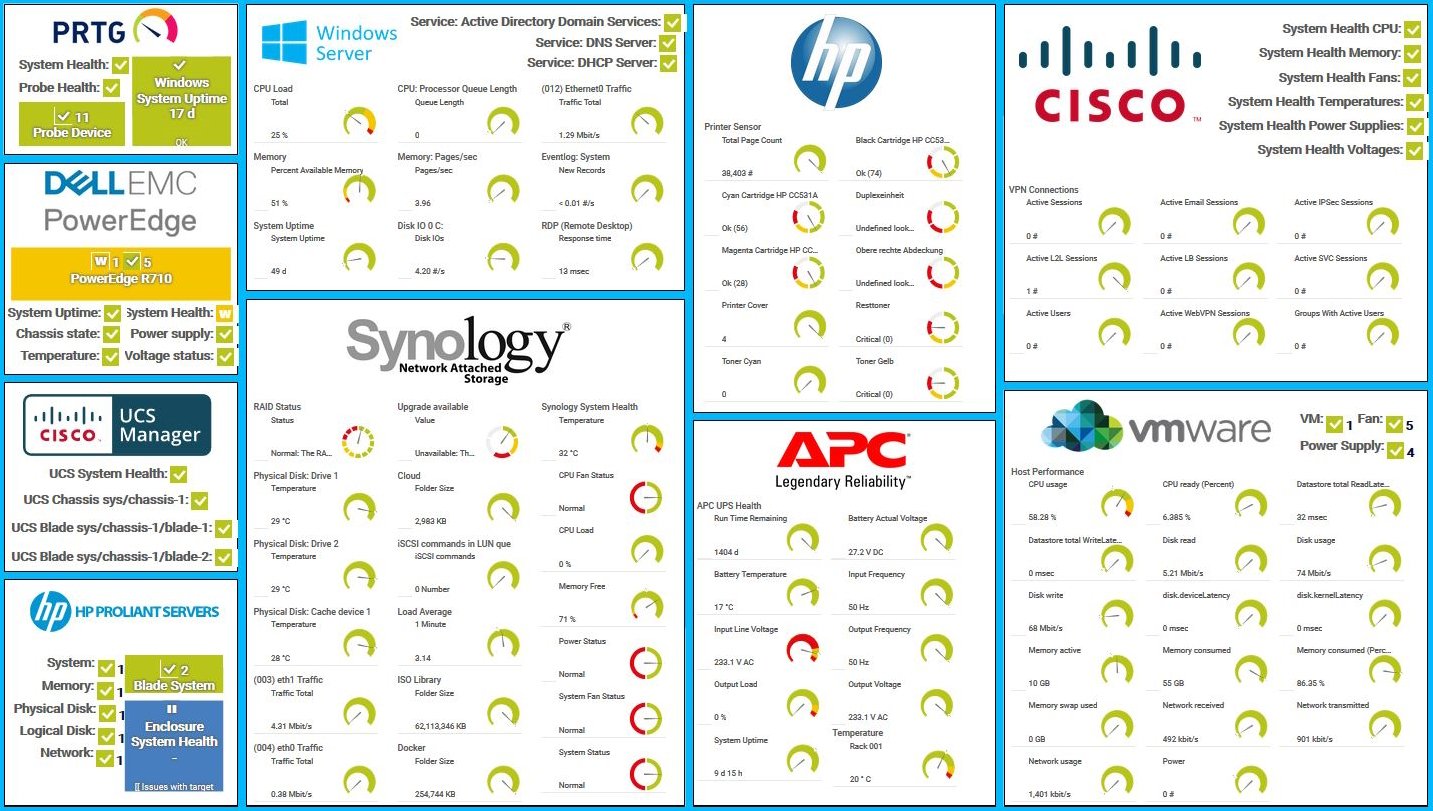
PRTG map screenshot showcasing real-time hardware monitoring

Device tree view of the complete monitoring setup

Custom PRTG dashboard for keeping an eye on the entire IT infrastructure

Live traffic data graph in PRTG
“All-around winning
network monitor”
“The real beauty of PRTG is the endless possibilities it offers”
“PRTG Network Monitor
is very hard to beat”
PRTG comes with more than 250 native sensor types for monitoring your entire on-premises, cloud, and hybrid cloud environment out of the box. Check out some examples below!
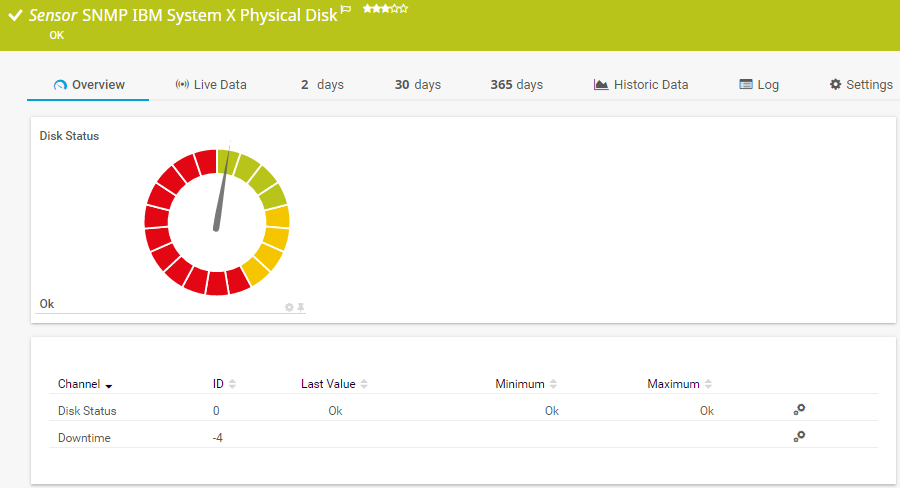
The SNMP IBM System X Physical Disk sensor monitors a physical disk in an IBM server. It can show the following:
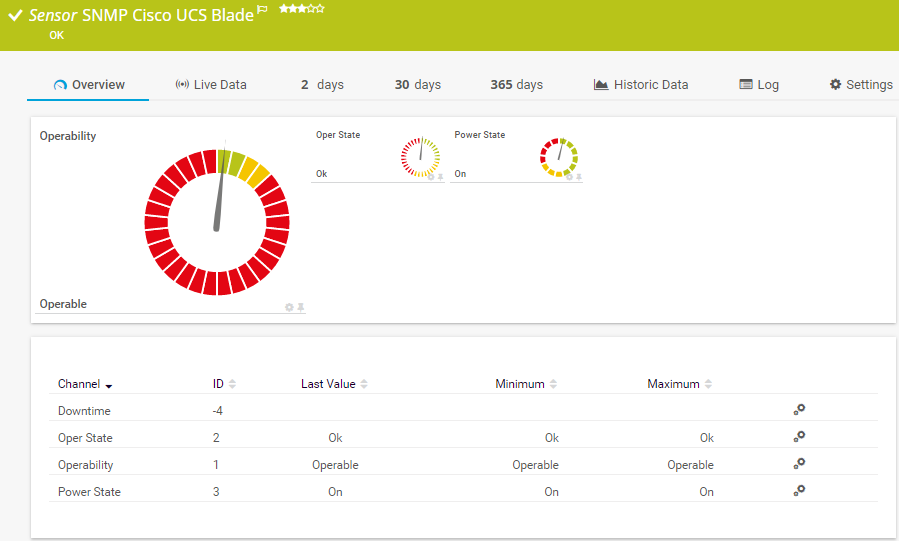
The SNMP Cisco UCS Blade sensor monitors the health status of a Cisco Unified Computing System blade server. It can show the following:
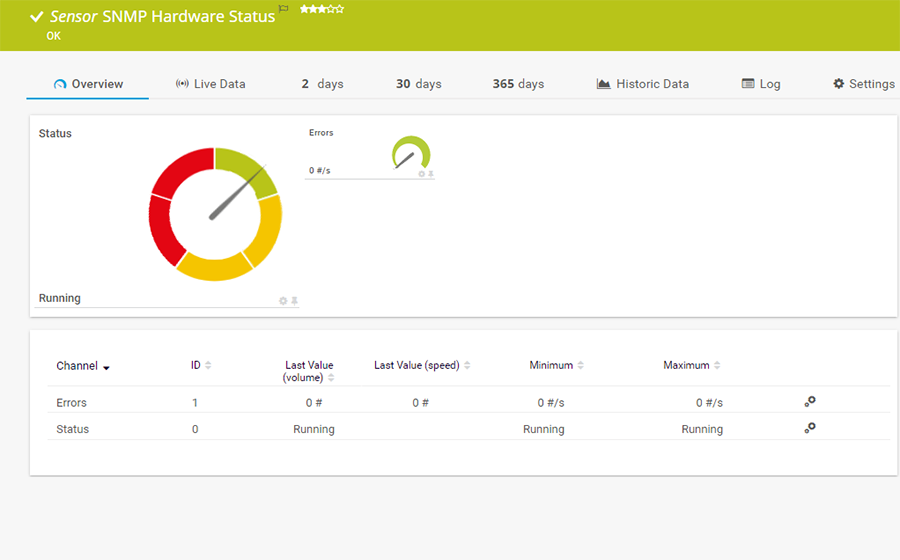
The SNMP Hardware Status sensor monitors the status of a server's hardware component. It can show the following:
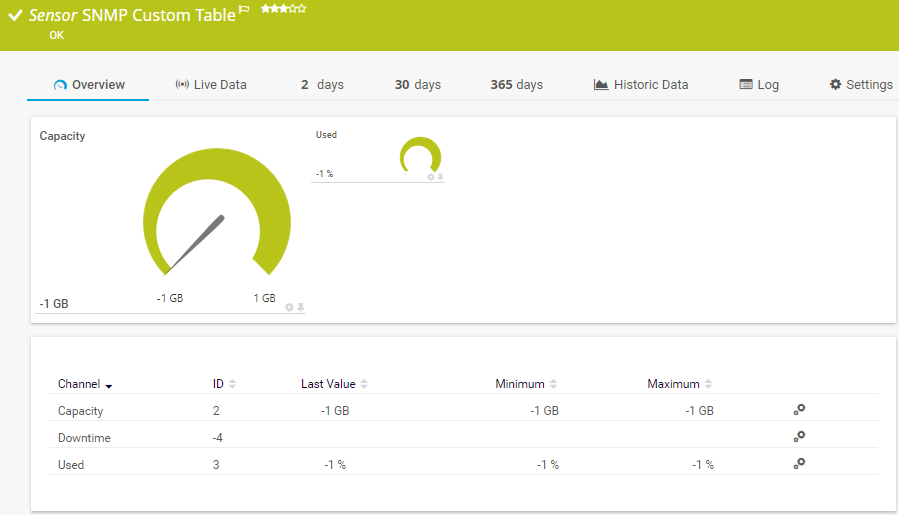
The SNMP Custom Table sensor monitors entries from a table. You can create one new sensor per table row. It can show the following:
See the PRTG Manual for a list of all available sensor types.

Real-time notifications mean faster troubleshooting so that you can act before more serious issues occur.
PRTG is set up in a matter of minutes and can be used on a wide variety of mobile devices.

As a member of the Cisco Partner Program, Paessler is one of the market leaders that enhances the Cisco technology portfolio with products that are proven to easily integrate with Cisco devices.
What does this mean for you?
Partnering with innovative IT vendors, Paessler unleashes synergies to create
new and additional benefits for joined customers.
Combining PRTG’s broad monitoring feature set with IP Fabric’s automated network assurance creates a new level of network visibility and reliability.
With ScriptRunner Paessler integrates a powerful event automation platform into PRTG Network Monitor.
UVexplorer integrates tightly with PRTG to bring fast and accurate network discovery, detailed device inventory, and automatic network mapping to the PRTG platform.
Custom alerts and data visualization let you quickly identify and prevent issues with your SNMP-enabled devices.
Network Monitoring Software – Version 25.3.110.1313 (August 27, 2025)
Download for Windows and cloud-based version PRTG Hosted Monitor available
English, German, Spanish, French, Portuguese, Dutch, Russian, Japanese, and Simplified Chinese
Network devices, bandwidth, servers, applications, virtual environments, remote systems, IoT, and more
Choose the PRTG Network Monitor subscription that's best for you


Yes, PRTG is designed to be vendor-neutral and can monitor a wide range of devices from different manufacturers as long as they support SNMP. This makes it a versatile tool for diverse IT environments.
PRTG is equipped to efficiently handle large volumes of SNMP data. It aggregates and processes the data, presenting it in a user-friendly format through its dashboard. This enables network administrators to easily interpret and analyze the data, even when dealing with large networks.
Yes, PRTG allows you to customize the intervals for SNMP polling. You can set different intervals for different devices or metrics based on your monitoring requirements, balancing the need for up-to-date information with network traffic considerations.
PRTG supports SNMP v3 which includes security features for authentication and data encryption, ensuring that the monitoring data is protected from unauthorized access. PRTG's secure implementation of SNMP v3 ensures that your network's monitoring data is both safe and reliable.
Yes, PRTG offers integration capabilities with other IT management and alerting tools. This allows you to streamline your IT operations by combining SNMP data with other metrics and alerts in a centralized management system.
Absolutely, PRTG's SNMP monitoring tools store historical data of SNMP-monitored devices, enabling you to perform trend analysis, capacity planning, and review past performance issues. This historical data is valuable for understanding your network's behavior over time and making informed decisions.
Yes, PRTG can be configured to send alerts and notifications based on specific SNMP traps. This means that when certain predefined conditions or thresholds are met, PRTG will automatically notify the relevant personnel, enabling prompt response to potential issues.
Yes, PRTG can monitor devices across multiple locations. You can set up remote probes in different geographical locations, and these probes will send SNMP data back to the central PRTG server, allowing centralized monitoring of a geographically dispersed network.
In PRTG, “sensors” are the basic monitoring elements. One sensor usually monitors one measured value in your network, for example the traffic of a switch port, the CPU load of a server, or the free space on a disk drive. On average, you need about 5-10 sensors per device or one sensor per switch port.
Paessler conducted trials in over 600 IT departments worldwide to tune its network monitoring software closer to the needs of sysadmins. The result of the survey: over 95% of the participants would recommend PRTG – or already have.

Paessler PRTG is used by companies of all sizes. Sysadmins love PRTG because it makes their job a whole lot easier.
Bandwidth, servers, virtual environments, websites, VoIP services – PRTG keeps an eye on your entire network.
Everyone has different monitoring needs. That’s why we let you try PRTG for free.