• Company
    • About Us
    • Case Studies
    • Press Center
    • Events
    • Careers
    • Blog
    • Contact us
  • Contact us
  • Login
 
  • English
    • Deutsch
    • Español
    • Français
    • Italiano
    • Português
Paessler
                    - The Monitoring Experts
  • Products
    • Paessler PRTG
      Paessler PRTGMonitor your whole IT infrastructure
      • PRTG Network Monitor
      • PRTG Enterprise Monitor
      • PRTG Hosted Monitor
      • PRTG extensionsExtensions for Paessler PRTGExtend your monitoring to a new level
    • Icon Features
      FeaturesExplore all monitoring features
      • Maps & dashboards
      • Alerts & notifications
      • Multiple user interfaces
      • Distributed monitoring
      • Customizable reporting
  • Solutions
    • Industries
      IndustriesMonitor various industry sectors
      • Industrial
      • Healthcare
      • Data Center
      • Education
      • Finance
      • Government
    • IT Topics
      IT TopicsMonitor all areas of IT
      • Network Monitoring
      • Bandwidth Monitoring
      • SNMP Monitor
      • Network Mapping
      • WiFi Monitoring
      • Server Monitoring
  • Pricing
  • Resources
    • Getting Started
      Getting StartedModules for self-paced learning
    • How-to Guides
      How-to GuidesGet the most out of PRTG
    • Videos & Webinars
      Videos & WebinarsLearn from Paessler experts
    • IT  Knowledge
      IT KnowledgeExpand your IT knowledge
    • PRTG Manual
      PRTG ManualFull documentation
    • Knowledge Base
      Knowledge BaseShare community knowledge
    • PRTG Sensor Hub
      PRTG Sensor HubGet sensors, scripts & templates
    • Trainings
      PRTG TrainingLearn how to work with PRTG
  • Partners
    • icon star
      New Partners and MSPBecome a new partner or MSP
    • icon partner
      Partner PortalLog in to your partner account
    • Deal Registration
      Deal RegistrationRegister your sales opportunities
    • icon search
      Find a PartnerFind partners selling Paessler products
    • icon technology
      Technology AlliancesSee Paessler technology partnerships
  • Company
    • About Us
    • Case Studies
    • Press Center
    • Events
    • Careers
    • Blog
    • Contact us
  • Contact us
  • Login
  • English
    • Deutsch
    • Español
    • Français
    • Italiano
    • Português
  • Get a quote
  • Free trial
  1. Home>
  2. IT Explained>
  3. SNMP, MIBs and OIDs
PRTG Logo


SNMP, MIBs and OIDs

  • MIBs and OIDs define what SNMP can monitor on a device
  • Essential to interpreting data from network hardware
  • Get a high-level grasp of how SNMP “knows what to look for”

What you will find on this page

Table of content
  • What are MIBs and OIDs?
  • Definition: What SNMP stands for
  • SNMP MIBs, SNMP OIDs etc. – a deeper view
  • IP Check server monitor - network up-/downtime monitoring tool
  • Sources

PRTG is compatible with all major vendors, products, and systems

compatible with all major vendors, products, and systems

SNMP, MIBs and OIDs – all you have to know

SNMP is one of the most commonly used technologies when it comes to network monitoring.
Bandwidth monitoring programs like Paessler PRTG use it.
But how does SNMP work?

Start SNMP monitoring with PRTG and see how it can make your network more reliable and your job easier.

free downLoad

What are MIBs and OIDs?

SNMP MIB

MIB stands for Management Information Base and is a collection of information organized hierarchically. These are accessed using a protocol such as SNMP. There are two types of MIBs: scalar and tabular.

Scalar objects define a single object instance whereas tabular objects define multiple related object instances grouped in MIB tables.

MIBs are collections of definitions which define the properties of the managed object within the device to be managed.

MIB Example: The typical objects to monitor on a printer are the different cartridge states and maybe the number of printed files, and on a switch the typical objects of interest are the incoming and outgoing traffic as well as the rate of package loss or the number of packets addressed to a broadcast address.

SNMP OID

OIDs stands for Object Identifiers. OIDs uniquely identify managed objects in a MIB hierarchy. This can be depicted as a tree, the levels of which are assigned by different organizations. Top level MIB object IDs (OIDs) belong to different standard organizations.

Vendors define private branches including managed objects for their own products.

Samples

Here is a sample structure of an OID:

  • Iso(1).org(3).dod(6).internet(1).private(4).transition(868).products(2).chassis(4).card(1).slotCps(2)-cpsSlotSummary(1).cpsModuleTable(1).cpsModuleEntry(1).cpsModuleModel(3).3562.3

or just:

  • 1.3.6.1.4.868.2.4.1.2.1.1.1.3.3562.3

These SNMP OID numbers are the ones used in PRTG when setting up custom sensors, in order to access the appropriate elements of the device desired to be monitored. OIDs are generally provided by the hardware manufacturers or can be found in so-called OID repositories, where collections of MIB trees and the respective OIDs can be accessed.

PRTG reads these OIDs and appoints them to the pertinent device, respectively monitoring the selected device and its OID specific. More information about PRTG...

Example

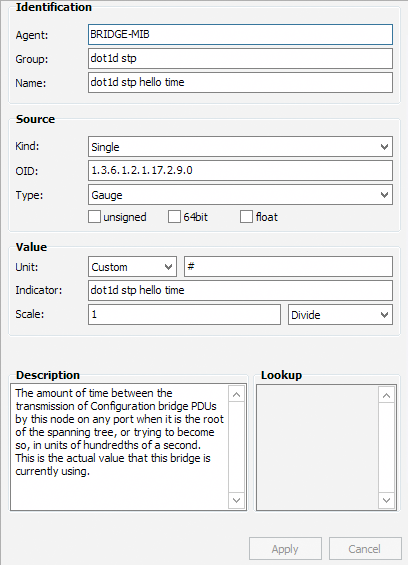
Properties of an OID

Example

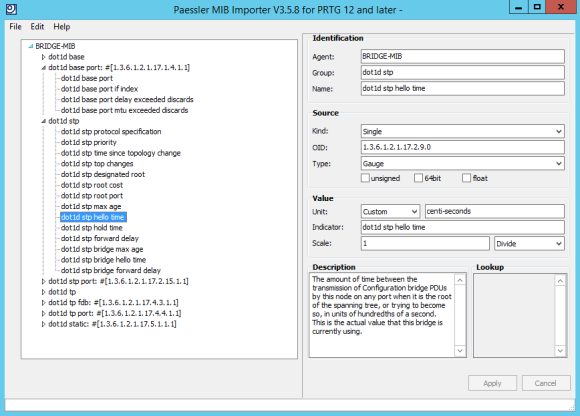
OID library opened in the MIB importer

Find the root cause of the problem with our PRTG SNMP monitoring tool

Real-time notifications mean faster troubleshooting so that you can act before more serious issues occur.

free downLoad

Definition: What SNMP stands for

SNMP stands for Simple Network Management Protocol. Its usefulness in network administration comes from the fact that it allows information to be collected about network-connected devices in a standardized way across a large variety of hardware and software types. SNMP is a protocol for management information transfer in networks, for use in LANs especially, depending on the chosen version.

Read more

Example

Our users give top ratings for monitoring with Paessler PRTG

Gartner peer insights
spiceworks
G2
Capterra

SNMP MIBs, SNMP OIDs etc. – a deeper view

SNMP basics

SNMP version 1, which is the SNMP standard supported by PRTG, was the initial development of the SNMP protocol. A description can be found in Request for Comments (RFC) 1157 and it functions within the specification of the Structure of Management Information (SMI).

It operates over User Datagram Protocol (UDP), Internet Protocol (IP), OSI Connectionless Network Services (CLNS), AppleTalk Datagram Delivery Prtocol (DDP), and Novell Internet Packet Exchange (IPX). SNMP v1 is considered the de facto network management protocol in the Internet community.

SNMP works on the basis that network management systems send out a request and the managed devices return a response. This is implemented using one of four operations: Get, GetNext, Set, and Trap. SNMP messages consist of a header and a PDU (protocol data units). The headers consist of the SNMP version number and the community name. The community name is used as a form of security in SNMP. The PDU depends on the type of message that is being sent. The Get, GetNext, and Set, as well as the response PDU, consist of PDU type, Request ID, Error status, Error index and Object/variable fields. The Trap consist of Enterprise, Agent, Agent address, Generic trap type, Specific trap code, Timestamp and Object/Value fields.

MIBs

MIBs are a collection of definitions which define the properties of the managed object within the device to be managed (such as a router, switch, etc.) Each managed device keeps a database of values for each of the definitions written in the MIB. As such, it is not actually database but implementation dependant. Each vendor of SNMP equipment has an exclusive section of the MIB tree structure under their control.

OIDs

In order for all of this to be properly organized, all of the manageable features of all products (from each vendor) are arranged in this tree. Each “branch” of this tree has a number and a name, and the complete path from the top of the tree down to the point of interest forms the name of that point. This is the OID. Nodes near the top of the tree are extremely general I nature. For example, to get to the Internet, one has to reach to the fourth tier. As one moves further down, the names get more and more specific, until one gets to the bottom, where each node represents a particular feature on a specific device (or agent).

Do you need a professional SNMP monitoring solution?

PRTG is a comprehensive network monitoring software and keeps track of your entire IT infrastructure.

free downLoad

Hundreds of thousands of customers worldwide love Paessler PRTG

customer success stories


What customers say about us

IP Check server monitor - network up-/downtime monitoring tool

This Windows-based network monitor software and multi-platform ASP service makes it easy and affordable to detect network and website failures early, minimizing downtime and avoiding economic impact. The server monitor helps organizations monitor critical network resources and immediately detect system failures or performance problems. Freeware available! More...

Sources

Discover more
  • SNMP Monitoring with PRTG
  • MIB Browser with PRTG
  • SNMP Trap Receiver with PRTG
PRTG Logo

Start monitoring with PRTG and see how it can make your network more reliable and your job easier.

Free download
PRODUCT OVERVIEW

Products

  • Paessler PRTG
    Paessler PRTGMonitor your whole IT infrastructure
    • PRTG Network Monitor
    • PRTG Enterprise Monitor
    • PRTG Hosted Monitor
    • PRTG extensions
      Extensions for Paessler PRTGExtend your monitoring to a new level
  • Icon Features
    FeaturesExplore all monitoring features

Monitoring with PRTG

  • Network monitoring
  • Bandwidth monitoring
  • SNMP monitoring
  • Network mapping
  • Wi-Fi monitoring
  • Server monitoring
  • Network traffic analyzer
  • NetFlow monitoring
  • Syslog server

Useful Links

  • PRTG Manual
  • Knowledge Base
  • Customer Success Stories
  • About Paessler
  • Subscribe to newsletter
  • PRTG Support
  • PRTG Consulting
  • PRTG Feedback & Roadmap

Contact

Paessler GmbH
Thurn-und-Taxis-Str. 14, 
90411 Nuremberg 
Germany

info@paessler.com

+49 911 93775-0

  • Contact us
©2025 Paessler GmbHTerms & ConditionsPrivacy PolicyImprintReport VulnerabilityDownload & InstallSitemap
404 - Page not found 404 - Page not found 404 - Page not found