• Company
    • About Us
    • Case Studies
    • Press Center
    • Events
    • Careers
    • Blog
    • Contact us
  • Contact us
  • Login
 
  • English
    • Deutsch
    • Español
    • Français
    • Italiano
    • Português
Paessler
                    - The Monitoring Experts
  • Products
    • Paessler PRTG
      Paessler PRTGMonitor your whole IT infrastructure
      • PRTG Network Monitor
      • PRTG Enterprise Monitor
      • PRTG Hosted Monitor
      • PRTG extensionsExtensions for Paessler PRTGExtend your monitoring to a new level
    • Icon Features
      FeaturesExplore all monitoring features
      • Maps & dashboards
      • Alerts & notifications
      • Multiple user interfaces
      • Distributed monitoring
      • Customizable reporting
  • Solutions
    • Industries
      IndustriesMonitor various industry sectors
      • Industrial
      • Healthcare
      • Data Center
      • Education
      • Finance
      • Government
    • IT Topics
      IT TopicsMonitor all areas of IT
      • Network Monitoring
      • Bandwidth Monitoring
      • SNMP Monitor
      • Network Mapping
      • WiFi Monitoring
      • Server Monitoring
  • Pricing
  • Resources
    • Getting Started
      Getting StartedModules for self-paced learning
    • How-to Guides
      How-to GuidesGet the most out of PRTG
    • Videos & Webinars
      Videos & WebinarsLearn from Paessler experts
    • IT  Knowledge
      IT KnowledgeExpand your IT knowledge
    • PRTG Manual
      PRTG ManualFull documentation
    • Knowledge Base
      Knowledge BaseShare community knowledge
    • PRTG Sensor Hub
      PRTG Sensor HubGet sensors, scripts & templates
    • Trainings
      PRTG TrainingLearn how to work with PRTG
  • Partners
    • icon star
      New Partners and MSPBecome a new partner or MSP
    • icon partner
      Partner PortalLog in to your partner account
    • icon search
      Find a PartnerFind partners selling Paessler products
    • icon technology
      Technology AlliancesSee Paessler technology partnerships
  • Company
    • About Us
    • Case Studies
    • Press Center
    • Events
    • Careers
    • Blog
    • Contact us
  • Contact us
  • Login
  • English
    • Deutsch
    • Español
    • Français
    • Italiano
    • Português
  • Get a quote
  • Free trial
  1. Home>
  2. IT Topics>
  3. Technology>
  4. SNMP Port Analyzer
PRTG Logo

SNMP Port Analyzer with PRTG

Analyze your ports and maximize network security & performance

  • Monitor individual TCP/IP and UDP ports, and your entire network
  • Track port bandwidth usage and other key port health stats
  • Get alerted about performance issues and security risks
Free download
product overview

Our users give top ratings for monitoring with Paessler PRTG

Gartner peer insights
spiceworks
Capterra
G2
Trustpilot

PRTG SNMP port analyzer: What you will find on this page

Table of content
  • Are you expecting too much from your ports?
  • Keep data flowing safely at speed with your SNMP port analyzer
  • What SNMP port analyzer looks like in PRTG
  • Explore our preconfigured PRTG sensors for SNMP port analysis
  • SNMP port analyzer: FAQ

PRTG makes SNMP port analysis as easy as it gets

Custom alerts and data visualizations let you quickly identify and prevent port congestion, security vulnerabilities, and other network performance  issues.

Free download
PRODUCT OVERVIEW

Are you expecting too much from your ports?

Emails that won't send. Frozen screens. Dropped connections.

Overloaded or underperforming ports cause all sorts of annoying and disruptive issues. And that's before we even talk about the security risks…

Paessler PRTG port analyzer uses SNMP to monitor the health of all ports across your network, so you can prevent outages, keep your colleagues productive, and shut bad actors out of your network.

Table of content

Keep data flowing safely at speed with your SNMP port analyzer

icon boost

Optimize your infrastructure

Manage your network and the communication between all elements in your infrastructure more effectively. PRTG works tirelessly in the background, tracking key stats and letting you know a port is close to overloading before it actually happens, so you can prevent outages.

icon lock

Strengthen network security

With so much on your plate, potentially critical security issues can easily go unnoticed. PRTG keeps a close eye on switch ports, router ports, server ports, and other network infrastructure, rooting out weak spots like open ports before bad actors can exploit them.

icon database

Troubleshoot with ease

PRTG stores raw data for a year by default. That means you can go back as far as you need to pinpoint when a problem started. Plus, you can spot trends and take proactive action. Like ensuring you don't find yourself with too many devices and not enough ports.

What SNMP port analysis looks like in PRTG

Diagnose network issues by continuously tracking ports across your network. Show port status, data transfer speed, and other key metrics in real time. Visualize monitoring data in clear graphs and dashboards to identify problems more easily. Gain the overview you need to troubleshoot speed issues, security vulnerabilities, and other network performance problems.

PRTG screenshot graph live data traffic

Live traffic data graph in PRTG

PRTG Screenshot device tree view

Device tree view of the complete monitoring setup

PRTG screenshot map entire it infrastructure

Custom PRTG dashboard for keeping an eye on the entire IT infrastructure

PRTG screenshot graph live data traffic

Live traffic data graph in PRTG

PRTG Screenshot device tree view

Device tree view of the complete monitoring setup

Start conducting SNMP port analysis with PRTG and see how it can make your network more reliable and your job easier.

Free download
PRODUCT OVERVIEW

IT experts agree: Paessler PRTG is a great solution for IT infrastructure monitoring

PCMag

“All-around winning
 network monitor”

IT Brief

“The real beauty of PRTG is the endless possibilities it offers”

ITPro

“PRTG Network Monitor 
is very hard to beat”

Explore our preconfigured PRTG sensors for SNMP port analysis

PRTG comes with more than 250 native sensor types for monitoring your entire on-premises, cloud, and hybrid cloud environment out of the box. Check out some examples below!

SNMP Traffic v2

The SNMP Traffic v2 sensor monitors bandwidth and traffic on a device. It can show the following:

  • Number of incoming and outgoing broadcast, multicast, unicast, and non-unicast packets
  • Number of incoming and outgoing discards and errors
  • Total, incoming, and outgoing traffic
  • Number of incoming, unknown protocols
SNMP Traffic v2
SNMP Traffic v2

Port v2

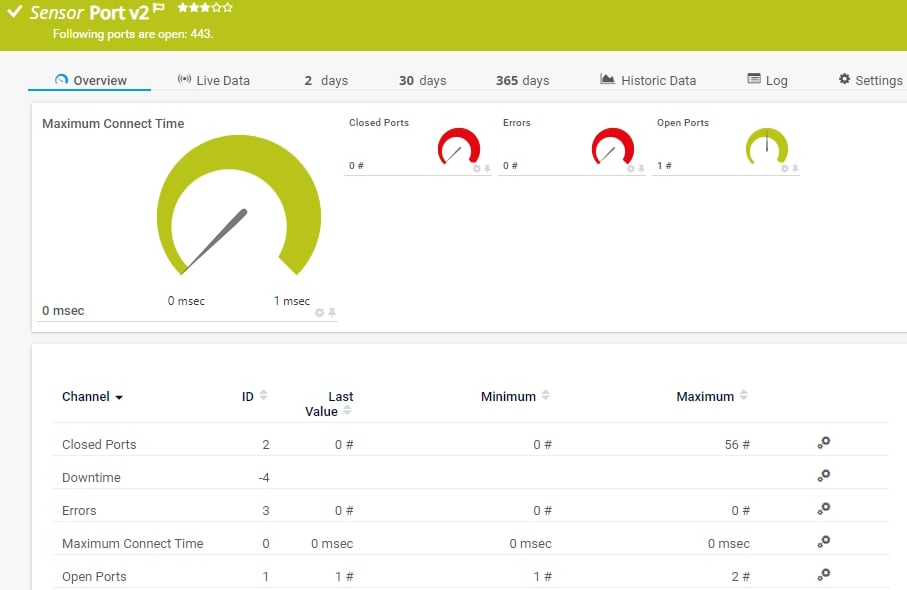
The Port v2 sensor monitors a network service by connecting to one or more of its TCP/IP ports. It can show the following:

  • Number of open and closed ports
  • Number of errors
  • Maximum time until a request to connect to a port was accepted
Port v2
Port v2

Port Range

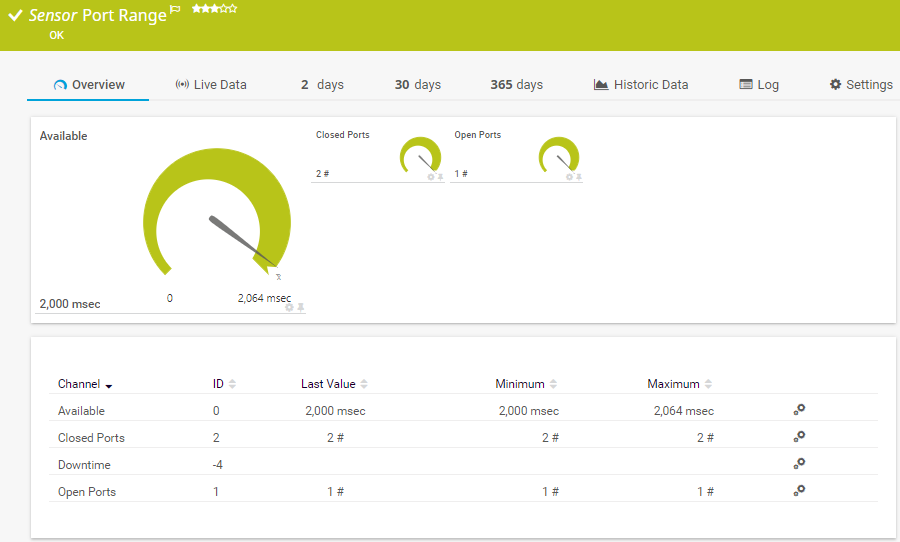
The Port Range sensor monitors a network service by connecting to various TCP/IP ports. It tries to connect to the specified TCP/IP port numbers of a device in succession and waits for the device to accept each request. It can show the following:

  • Time until requests to ports are accepted
  • Number of open and closed ports
Port Range
Port Range

Sensor Factory

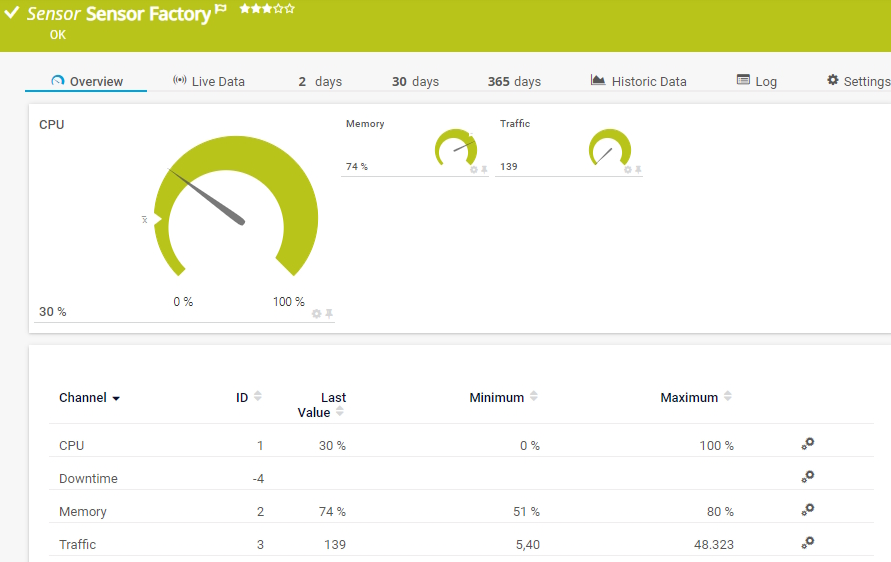
The Sensor Factory sensor monitors entire business processes that involve several components. You can create a customized sensor with channels based on data from other sensors. It can show the following:

  • Downtime
  • Various monitoring results from other sensors or devices
Sensor Factory
Sensor Factory

See the PRTG Manual for a list of all available sensor types.

PRTG is compatible with all major vendors, products, and systems

compatible with all major vendors, products, and systems

PRTG makes SNMP port analysis as easy as it gets

Custom alerts and data visualizations let you quickly identify and prevent port congestion, security vulnerabilities, and other network performance  issues.

Free download
PRODUCT OVERVIEW

“The reactivity, know-how, and technical solutions of Paessler are outstanding in every situation. For me, no monitoring tool compares to PRTG.”

Andreas Reimann, Senior Networking Communication Architect
Zurich Airport

“We strive to equip our systems with state-of-the-art technology to safeguard our educational practices for the future. Part of this includes ensuring that all our systems run smoothly at all times. On any given day, we rarely have time to keep an eye on all our systems. We therefore decided to monitor our school’s IT environment with a centralized network monitoring tool.”

Stefan Roschewitz, IT administrator
BBS Holzminden

“We want to include the tool in our set of solutions in order to solve problems more proactively in our technology infrastructure. PRTG has exceeded all our expectations because it is a reliable, extremely easy-to-use solution. There is no doubt that it lives up to the renowned quality of German technology.”

Esbin Saúl Lázaro García, IT Infrastructure and Security Engineer
Hospital El Pilar

“The reactivity, know-how, and technical solutions of Paessler are outstanding in every situation. For me, no monitoring tool compares to PRTG.”

Andreas Reimann, Senior Networking Communication Architect
Zurich Airport

“We strive to equip our systems with state-of-the-art technology to safeguard our educational practices for the future. Part of this includes ensuring that all our systems run smoothly at all times. On any given day, we rarely have time to keep an eye on all our systems. We therefore decided to monitor our school’s IT environment with a centralized network monitoring tool.”

Stefan Roschewitz, IT administrator
BBS Holzminden

Your SNMP port analyzer at a glance – even on the go

Set up PRTG in minutes and use it on almost any mobile device.

device overview
Gartner peer insights

“Excellent tool for detailed monitoring. Alarms and notifications work greatly. Equipment addition is straight forward and server initial setup is very easy. ...feel safe to purchase it if you intend to monitor a large networking landscape.”

Read the complete review at Gartner Peer Insights

Create innovative solutions with Paessler’s IT partners

Partnering with innovative IT vendors, Paessler unleashes synergies to create
new and additional benefits for joined customers.

Martello

Martello 

By integrating PRTG with Martello iQ, you can add a fast analytics layer to improve uptime, visualize your IT environment, and integrate all of your IT systems into a single pane of glass.

Read more
NetBrain

NetBrain

Integrating monitoring results from PRTG into NetBrain maps makes the foundation for network automation.

Read more
Siemon

Siemon

Siemon and Paessler bring together intelligent building technology and advanced monitoring and make your vision of intelligent buildings and data centers become reality.

Read more

Find the root cause of the problem with our PRTG SNMP port analyzer solution

Real-time notifications mean faster troubleshooting so that you can act before more serious issues occur.

Free download
PRODUCT OVERVIEW
Paessler PRTG

Paessler PRTG

Network Monitoring Software – Version 25.2.106.1114 (May 05th, 2025)

Hosting icon

Hosting

Download for Windows and cloud-based version PRTG Hosted Monitor available

Languages icon

Languages

English, German, Spanish, French, Portuguese, Dutch, Russian, Japanese, and Simplified Chinese

test

Monitor everything

Network devices, bandwidth, servers, applications, virtual environments, remote systems, IoT, and more

test

Pricing

Choose the PRTG Network Monitor subscription that's best for you

Discover more monitoring insights and stories

Resources Solution

Solutions for all your monitoring needs

  • Debug your SNMP configuration with SNMP Tester
  • SNMP monitoring software
  • SNMP Trap Receiver
Resources Content

Powerful stories from the monitoring world

  • Sensor of the Week: SNMP RMON Sensor
  • SNMP Doesn’t Work! Can Somebody Out There Please Help?!
  • Disabling ICMP and SNMP won’t increase security, but will impact network monitoring
Resources Solutions

Resources to master your monitoring challenges

  • PRTG and SNMP monitoring: same device, two SNMP ports
  • SNMP and NAT/PAT
  • My SNMP sensors don’t work. What can I do?

SNMP Port Analyzer: FAQ


What is a port?

Ports are endpoints that make it easier for all the different processes and services on your network to talk to each other. When ports are working as they should, data flows freely and your network runs smoothly. But when ports are misconfigured or have other issues, they can slow your network down and make you more vulnerable to trojans and other security risks.

What is SNMP?

The SNMP protocol (Simple Network Management Protocol) is a standard protocol used to manage and monitor network devices such as routers, switches, servers, printers, and other hardware connected to a network. SNMP allows network administrators to remotely monitor device performance, collect and analyze data, and even modify configurations on these devices to ensure the network runs smoothly and efficiently.

Key components of SNMP include:

  • Managed devices: These are the network devices that are monitored or managed using SNMP, such as routers, switches, servers, and printers. Each device must run SNMP-compatible software (called an agent) to communicate with the management system.
  • SNMP agents: The SNMP agent is software running on the managed device that collects and stores data about the device's performance and status (e.g., CPU usage, memory, network traffic). It responds to requests from the SNMP manager and can send notifications (called "traps") when certain events occur.
  • SNMP manager: Also known as the Network Management System (NMS), this is software (or sometimes hardware) that communicates with SNMP agents to gather and analyze information about managed devices. The SNMP manager can request data, receive notifications (traps), and sometimes send commands to modify the behavior or configuration of a device.

SNMP allows for several key operations:

  • Get request: The SNMP manager can request specific information from an agent, such as the CPU usage of a router.
  • Set request: The SNMP manager can change certain configuration settings on the managed device, such as modifying a network setting.
  • GetNext request: This is used to retrieve the next object in the MIB, often for iterating through a list of items (e.g., interface statistics).
  • SNMP trap: The SNMP agent can send unsolicited messages (traps) to the manager when predefined conditions occur, such as a device failure, threshold breaches, or other significant events.

Versions of SNMP:

There are three major versions of SNMP, each offering different levels of security and functionality.

  • SNMPv1: The original version, with basic functionality but minimal security. It only uses plain-text community strings for authentication.
  • SNMPv2c: An improved version that offers better performance and more efficient data retrieval. However, it still lacks strong security features.
  • SNMPv3: The latest version, which provides enhanced security features like encryption and secure authentication, making it suitable for use in more sensitive environments.
What's the difference between port monitoring and port scanning?

Port monitoring is like surveillance, while port scanning is an inspection. A port monitoring tool helps you track overall performance and identify long-term trends. A port scanner, on the other hand, is how you spot potentially imminent threats, such as port numbers that are open when they should be closed.

How does PRTG SNMP port analyzer work?

PRTG SNMP port analyzer continuously collects information about the ports on your network polling SNMP metrics. It can identify how many ports are open, how many are closed, which devices, applications, or other services are connected to them, and each port's response time.

How can I monitor ports using SNMP?

Monitoring ports using Simple Network Management Protocol (SNMP) involves configuring SNMP on the network devices and then using an SNMP port analyzer tool to collect and analyze data. Here are the general steps to monitor ports using SNMP:

  1. Enable SNMP on network devices:
  • Access the device's management interface (often a web interface or command line).
  • Locate the SNMP settings and enable SNMP.
  • Configure SNMP community strings (read-only and read-write) for security.


    2. Identify OIDs for port monitoring:

  • Object Identifiers (OIDs) represent different parameters you can monitor with SNMP.
  • Common OIDs for port monitoring are in the IF-MIB (Interface Management Information Base). The main OID for interface statistics is ifTable (1.3.6.1.2.1.2.2).


    3. Set up PRTG as your SNMP port analyzer:

  • Install and configure PRTG’s sensors for port analysis with the SNMP community strings and target device IP addresses.
What is a sensor in PRTG?

In PRTG, “sensors” are the basic monitoring elements. One sensor usually monitors one measured value in your network, for example the traffic of a switch port, the CPU load of a server, or the free space on a disk drive. On average, you need about 5-10 sensors per device or one sensor per switch port.

We asked: would you recommend PRTG? Over 95% of our customers say yes!

Paessler conducted trials in over 600 IT departments worldwide to tune its network monitoring software closer to the needs of sysadmins. The result of the survey: over 95% of the participants would recommend PRTG – or already have.

recommendation

Still not convinced?

Love

More than 500,000 sysadmins love PRTG

Paessler PRTG is used by companies of all sizes. Sysadmins love PRTG because it makes their job a whole lot easier.

PRTG

Monitor your entire IT infrastructure

Bandwidth, servers, virtual environments, websites, VoIP services – PRTG keeps an eye on your entire network.

test

Try Paessler PRTG for free

Everyone has different monitoring needs. That’s why we let you try PRTG for free.

PRTG Logo

Start conducting SNMP port analysis with PRTG and see how it can make your network more reliable and your job easier.

Free download
PRODUCT OVERVIEW

Products

  • Paessler PRTG
    Paessler PRTGMonitor your whole IT infrastructure
    • PRTG Network Monitor
    • PRTG Enterprise Monitor
    • PRTG Hosted Monitor
  • PRTG extensions
    Extensions for Paessler PRTGExtend your monitoring to a new level
  • Icon Features
    FeaturesExplore all monitoring features

Monitoring with PRTG

  • Network monitoring
  • Bandwidth monitoring
  • SNMP monitoring
  • Network mapping
  • Wi-Fi monitoring
  • Server monitoring
  • Network traffic analyzer
  • NetFlow monitoring
  • Syslog server

Useful Links

  • PRTG Manual
  • Knowledge Base
  • Customer Success Stories
  • About Paessler
  • Subscribe to newsletter
  • PRTG Support
  • PRTG Consulting

Contact

Paessler GmbH
Thurn-und-Taxis-Str. 14, 
90411 Nuremberg 
Germany

info@paessler.com

+49 911 93775-0

  • Contact us
©2025 Paessler GmbHTerms & ConditionsPrivacy PolicyImprintReport VulnerabilityDownload & InstallSitemap
404 - Page not found 404 - Page not found 404 - Page not found