Custom alerts and data visualization let you quickly identify and prevent downtime.
Data center admins are constantly battling mysterious performance issues and downtime, trying to juggle multiple monitoring tools like they’re in some IT circus. Finding the actual problem can feel like hunting for a needle in a haystack. Enter Paessler PRTG, the all-in-one monitoring superhero that consolidates your entire IT infrastructure into one neat platform. PRTG gives you a clear view of everything, so you can track down problems fast and get back to being the office legend.
Diagnose network issues by continuously tracking data center performance and security. Show power usage, temperature, physical security of your data center, and other key metrics in real time. Visualize monitoring data in clear graphs and dashboards to identify problems more easily. Gain the overview you need to troubleshoot data center issues effectively.

Device tree view of the complete monitoring setup
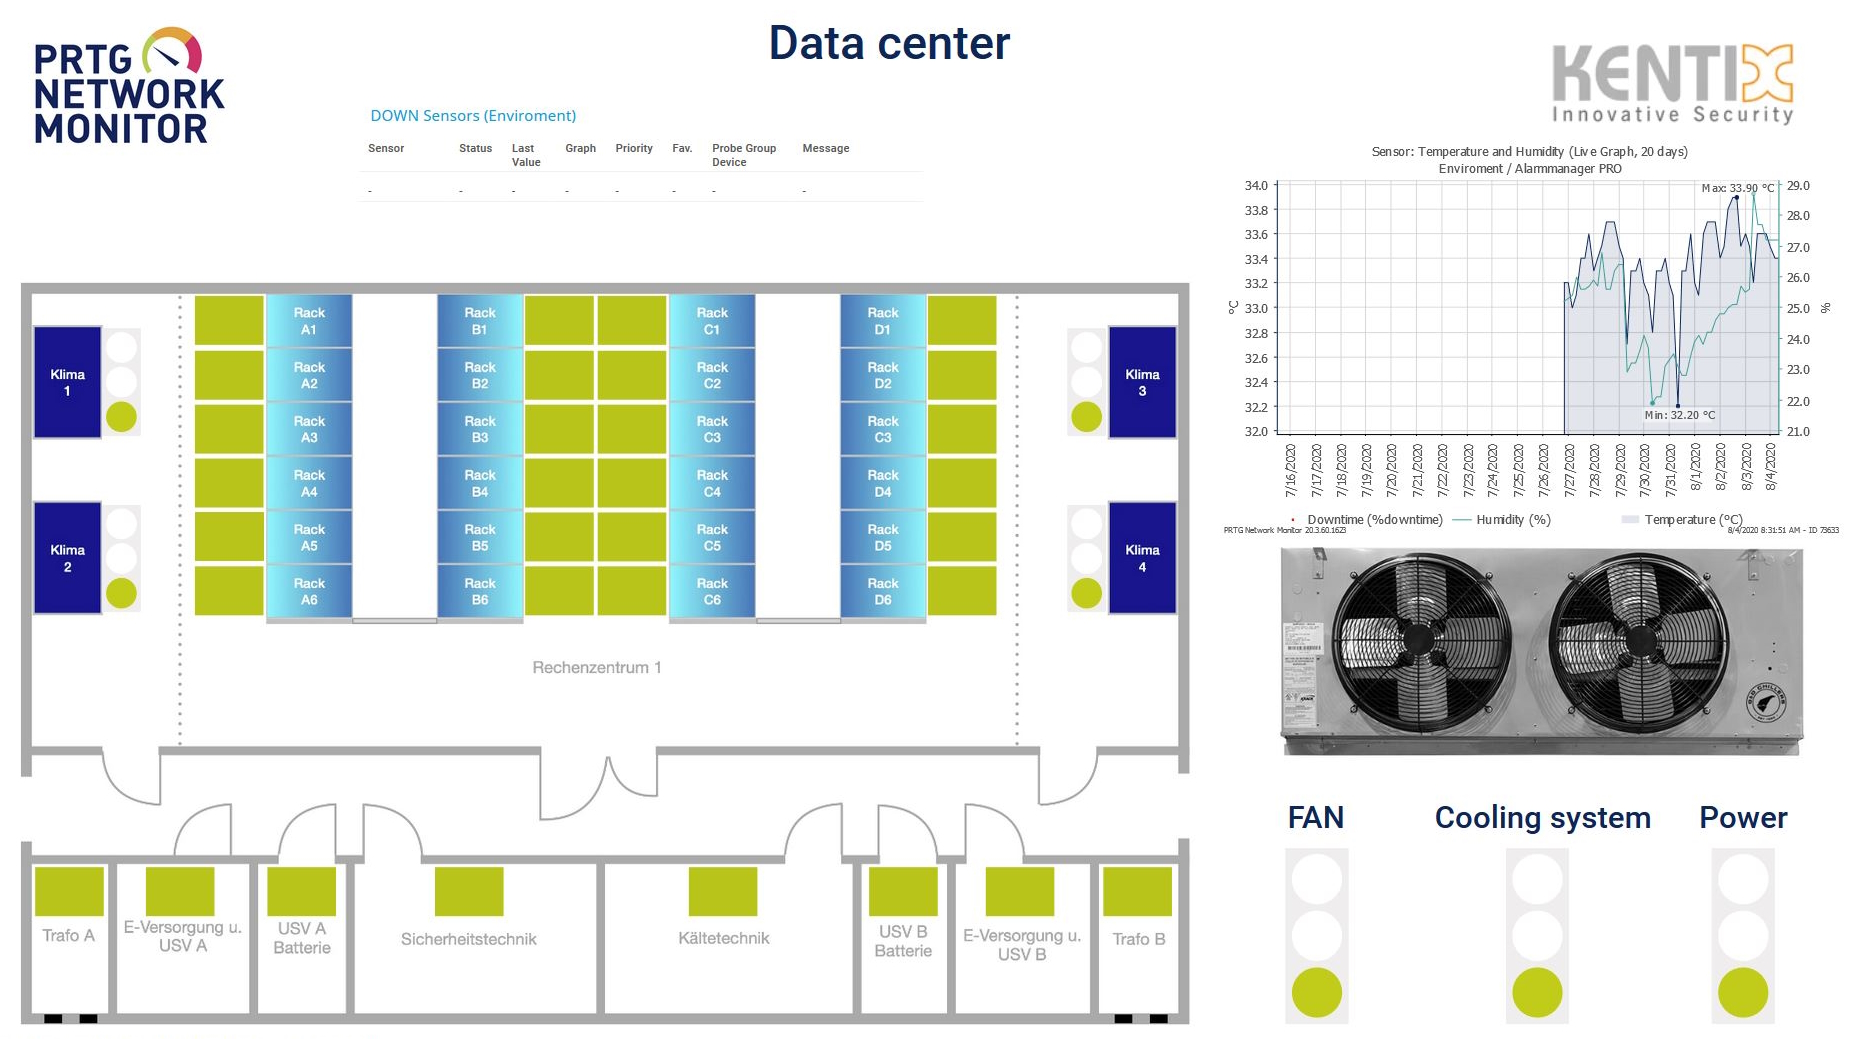
Custom PRTG dashboard of a Kentix data center
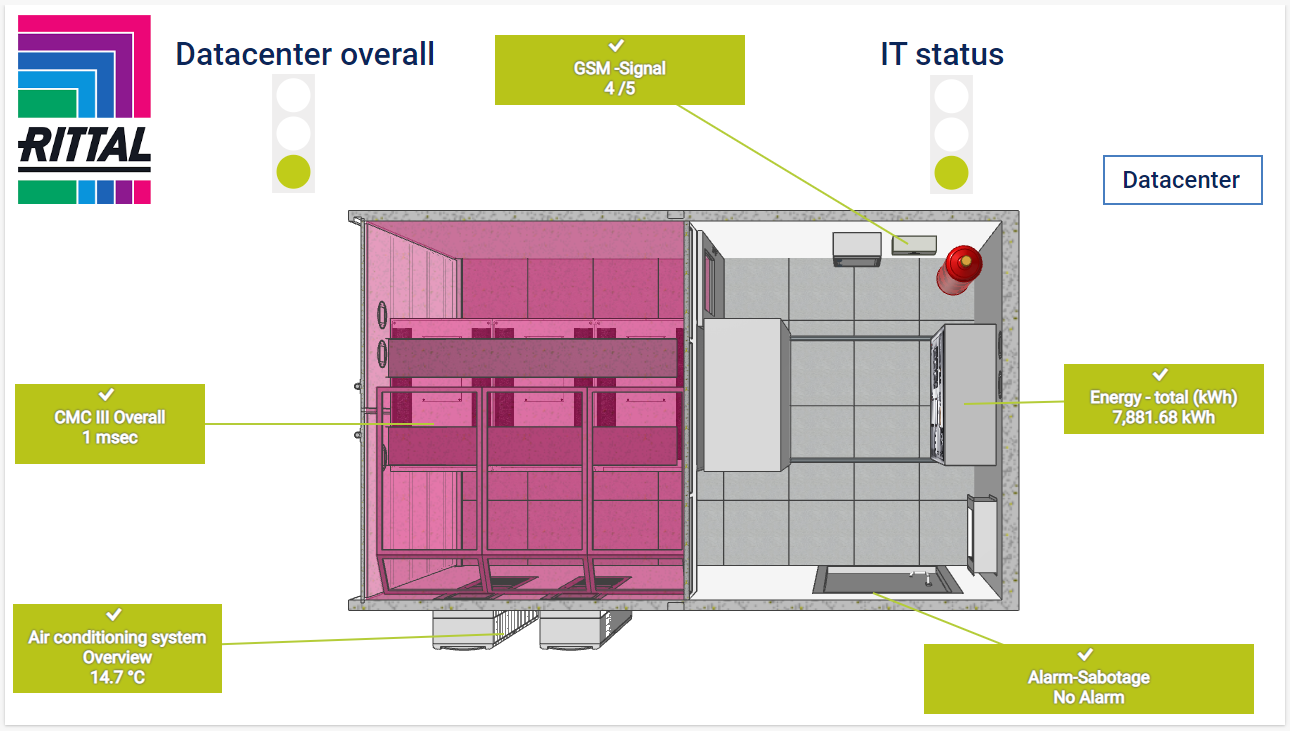
Rittal data center map in PRTG
“All-around winning
network monitor”
“The real beauty of PRTG is the endless possibilities it offers”
“PRTG Network Monitor
is very hard to beat”
PRTG doesn't just monitor your data center, it gives you detailed insights into historical data. This means you can plan for future capacity needs without flying blind.
No more guessing how much power or space you'll need next month – PRTG has the data to back you up. Because who has time for IT crystal balls?
Your network grows, and guess what? So does PRTG. With a massive sensor library, PRTG adapts as your infrastructure expands.
It’s like having a monitoring tool that grows with you, minus the annoying growing pains. Adding devices and services? Easy peasy. You’ve got enough to juggle, let PRTG handle the rest.
Ever get blindsided by a system crash? Not anymore. PRTG’s real-time alerts mean you’ll know about issues before they blow up.
Customizable notifications can be sent via email, Slack, push notifications, Microsoft Teams, and more, so you’re always in the loop. No more "surprise!" downtime – because who likes those kinds of surprises?
Your servers hate the heat just as much as you do, which is why we’ve taken the extra steps to help you keep your on-premise, physical environments healthy.
PRTG monitors temperature, humidity, and air quality in your data center, ensuring that nothing overheats or malfunctions due to environmental factors. You’ll get warnings before things get sweaty.
Away from your desk? No problem. With PRTG’s mobile apps, you can keep an eye on your data center from your phone or tablet.
Whether you're at the coffee shop or on vacation, you’ll still get alerts and see real-time data. Monitoring on the go has never been easier!
PRTG comes with more than 250 native sensor types for monitoring your entire on-premises, cloud, and hybrid cloud environment out of the box. Check out some examples below!
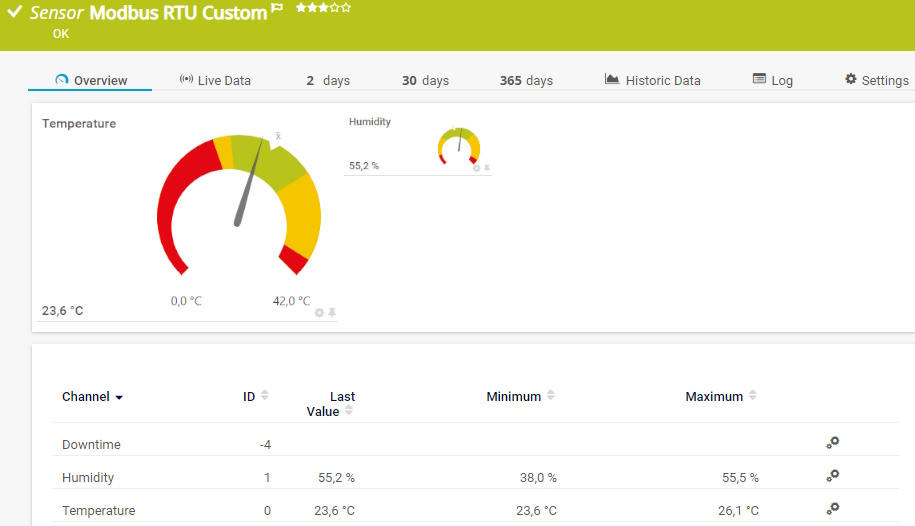
The Modbus RTU Custom sensor connects to a Modbus Remote Terminal Unit (RTU) server and monitors up to ten returned numeric values. It can show the following:
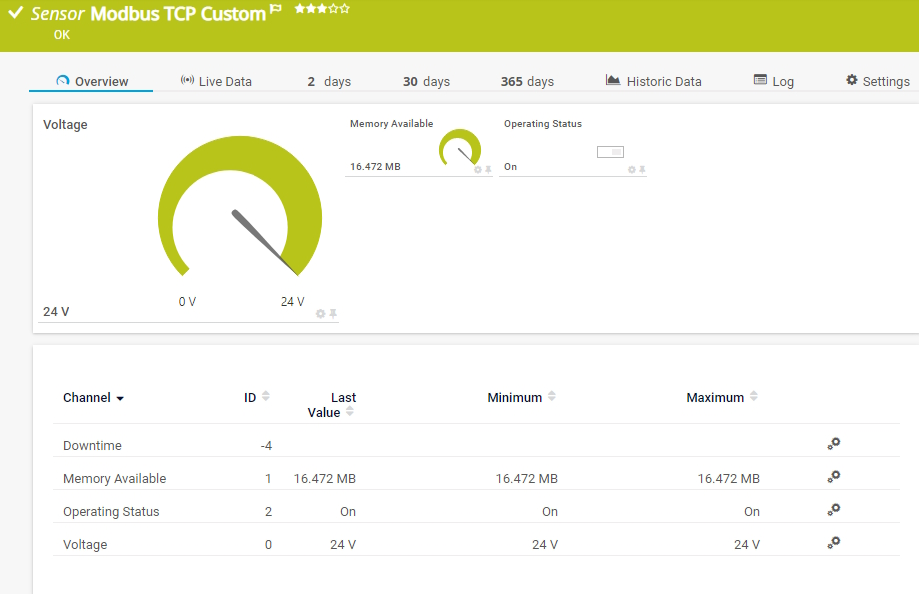
The Modbus TCP Custom sensor connects to a Modbus Transmission Control Protocol (TCP) server and monitors up to ten returned numeric values. It can show the following:
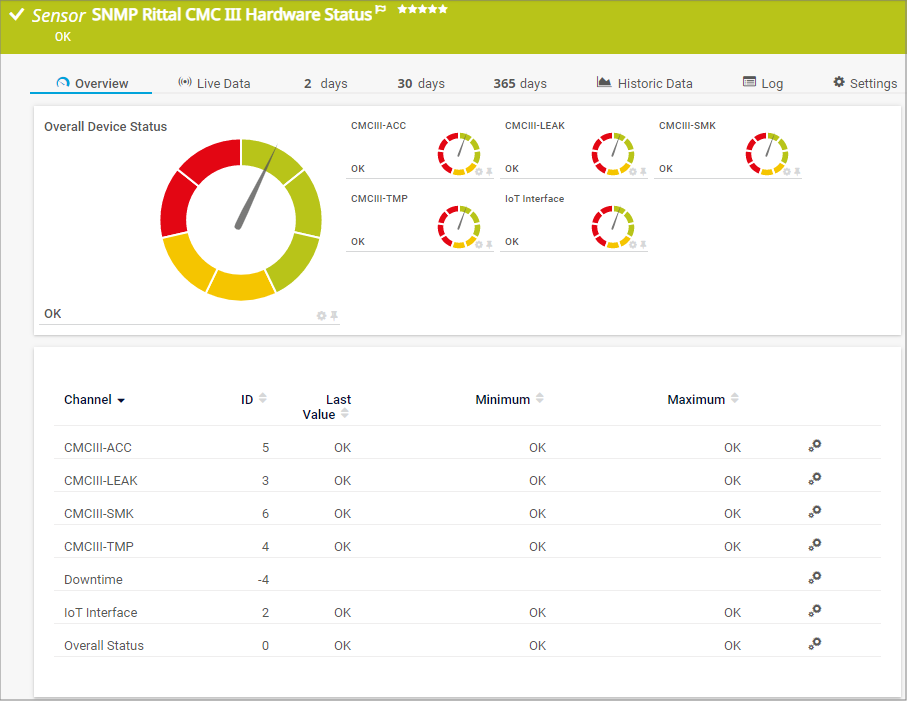
The SNMP Rittal CMC III Hardware Status sensor monitors the overall status of Rittal data center hardware, for example Rittal Computer Multi Control version 3 (CMC III) processing units, Rittal power distribution units (PDU), or Rittal IoT interfaces. It can show the following:
See the PRTG Manual for a list of all available sensor types.

Custom alerts and data visualization let you quickly identify and prevent downtime.
PRTG is set up in a matter of minutes and can be used on a wide variety of mobile devices.


“Excellent tool for detailed monitoring. Alarms and notifications work greatly. Equipment addition is straight forward and server initial setup is very easy. ...feel safe to purchase it if you intend to monitor a large networking landscape.”
Partnering with innovative IT vendors, Paessler unleashes synergies to create
new and additional benefits for joined customers.
IT that works constitutes a business-critical basis for a company's success. Availability and security must be defined for the respective purpose and closely monitored – by OT and IT alike.
Combining their tools to a powerful solution for advanced analysis and automation, KnowledgeRiver and Paessler enable IT teams to ensure best performance for their infrastructure and networks.
Siemon and Paessler bring together intelligent building technology and advanced monitoring and make your vision of intelligent buildings and data centers become reality.
Real-time notifications mean faster troubleshooting so that you can act before more serious issues occur.
Network Monitoring Software – Version 25.3.110.1313 (August 27, 2025)
Download for Windows and cloud-based version PRTG Hosted Monitor available
English, German, Spanish, French, Portuguese, Dutch, Russian, Japanese, and Simplified Chinese
Network devices, bandwidth, servers, applications, virtual environments, remote systems, IoT, and more
Choose the PRTG Network Monitor subscription that's best for you


Data Center Infrastructure Management (DCIM) focuses on monitoring and managing the physical infrastructure of a data center, primarily targeting server rooms and IT equipment like servers, switches, and routers. It also monitors critical infrastructure elements like power distribution units (PDUs), cooling systems, and fire protection mechanisms. The goal is to track the energy consumption, functionality, and performance of these components, enabling IT teams to take proactive steps when issues arise, optimize resource usage, and reduce operational costs.
Data Center Management (DCM) takes this concept further by addressing how a data center should be designed and managed for optimal long-term performance and sustainability. DCM involves capacity planning, IT equipment scalability, power management, and server room space optimization, aiming for a future-proof infrastructure. It includes mock scenarios for planning and incorporates best practices for energy and resource efficiency.
PRTG monitors all the usual DCIM suspects—power, temperature, IT systems—while sending out real-time alerts faster than a gossip chain. But it doesn’t stop there. For DCM, PRTG helps you spot inefficiencies, manage growth, and make sure you’re not wasting power (or money) by leaving servers running cold. In short, PRTG’s got your back for both managing the chaos now (DCIM) and planning for an even smoother future (DCM).
Proper data center management ensures maximized uptime, optimized resource use, reduced energy consumption, and the ability to quickly resolve performance or security issues. Without it, data centers could face inefficiencies, security vulnerabilities, and costly downtime.
Temperature, humidity, and air quality play critical roles in the health of data center equipment. Excess heat or humidity can damage sensitive equipment, while poor air quality can lead to hardware malfunctions. Monitoring these factors is essential to prevent overheating and avoid downtime.
Improving energy efficiency involves monitoring power consumption, optimizing cooling systems, and regularly maintaining hardware. Data center managers can use historical data to analyze trends and spot inefficiencies in energy use, adjusting operations to reduce waste and lower costs.
PRTG provides real-time monitoring and alerts for all key components of the data center. When any part of your infrastructure—whether it's a server, power unit, or cooling system—shows signs of failure, PRTG sends immediate notifications, allowing you to take action before downtime occurs.
Yes, PRTG supports centralized monitoring of distributed or remote data centers. You can view all your locations on one dashboard, making it easier to track performance and handle issues from anywhere, even on mobile devices.
Absolutely! PRTG comes with vendor-agnostic sensors that work with hardware and systems from major vendors like Cisco, VMware, and Rittal. This makes it easy to monitor all your data center components through one platform.
In PRTG, “sensors” are the basic monitoring elements. One sensor usually monitors one measured value in your network, for example the traffic of a switch port, the CPU load of a server, or the free space on a disk drive. On average, you need about 5-10 sensors per device or one sensor per switch port.
Paessler conducted trials in over 600 IT departments worldwide to tune its network monitoring software closer to the needs of sysadmins. The result of the survey: over 95% of the participants would recommend PRTG – or already have.

Paessler PRTG is used by companies of all sizes. Sysadmins love PRTG because it makes their job a whole lot easier.
Bandwidth, servers, virtual environments, websites, VoIP services – PRTG keeps an eye on your entire network.
Everyone has different monitoring needs. That’s why we let you try PRTG for free.