• Company
    • About Us
    • Case Studies
    • Press Center
    • Events
    • Careers
    • Blog
    • Contact us
  • Login
 
  • English
    • Deutsch
    • Español
    • Français
    • Italiano
    • Português
Paessler
                    - The Monitoring Experts
  • Products
    • Paessler PRTG
      Paessler PRTGMonitor your whole IT infrastructure
      • PRTG Network Monitor
      • PRTG Enterprise Monitor
      • PRTG Hosted Monitor
      • PRTG extensionsExtensions for Paessler PRTGExtend your monitoring to a new level
    • Icon Features
      FeaturesExplore all monitoring features
      • Maps & dashboards
      • Alerts & notifications
      • Multiple user interfaces
      • Distributed monitoring
      • Customizable reporting
  • Solutions
    • Industries
      IndustriesMonitor various industry sectors
      • Industrial
      • Healthcare
      • Data Center
      • Education
      • Finance
      • Government
    • IT Topics
      IT TopicsMonitor all areas of IT
      • Network Monitoring
      • Bandwidth Monitoring
      • SNMP Monitor
      • Network Mapping
      • WiFi Monitoring
      • Server Monitoring
  • Pricing
  • Resources
    • Getting Started
      Getting StartedModules for self-paced learning
    • How-to Guides
      How-to GuidesGet the most out of PRTG
    • Videos & Webinars
      Videos & WebinarsLearn from Paessler experts
    • IT  Knowledge
      IT KnowledgeExpand your IT knowledge
    • PRTG Manual
      PRTG ManualFull documentation
    • Knowledge Base
      Knowledge BaseShare community knowledge
    • PRTG Sensor Hub
      PRTG Sensor HubGet sensors, scripts & templates
    • Trainings
      PRTG TrainingLearn how to work with PRTG
  • Partners
    • icon star
      New Partners and MSPBecome a new partner or MSP
    • icon partner
      Partner PortalLog in to your partner account
    • icon search
      Find a PartnerFind partners selling Paessler products
    • icon technology
      Technology AlliancesSee Paessler technology partnerships
  • Company
    • About Us
    • Case Studies
    • Press Center
    • Events
    • Careers
    • Blog
    • Contact us
  • Login
  • English
    • Deutsch
    • Español
    • Français
    • Italiano
    • Português
  • Get a quote
  • Free trial
  1. Home>
  2. IT Topics>
  3. Hardware>
  4. Cisco Monitoring
PRTG Logo

Cisco Monitoring with PRTG

Get in-depth insights into your Cisco network – fully-integrated

  • Monitor your Cisco routers and switches out of the box
  • Includes preconfigured sensors designed just for Cisco device integration
  • Increase the security of your network and the quality of your service
Free download
product overview

Our users give top ratings for monitoring with Paessler PRTG

Gartner peer insights
spiceworks
Capterra
G2
Trustpilot

PRTG Cisco monitoring: What you will find on this page

Table of content
  • Get in-depth insight into your Cisco network with PRTG sensors
  • Cisco performance monitoring: Keep an eye on routers, switches, and ports
  • What Cisco network monitoring looks like in PRTG
  • Get started in minutes with our predefined Cisco sensors
  • 7 reasons to choose PRTG as your Cisco monitoring tool
  • Cisco monitoring: FAQ

PRTG makes Cisco network monitoring as easy as it gets

Custom alerts and data visualization let you quickly identify and prevent Cisco network health, availability, and performance issues.

Free download
PRODUCT OVERVIEW

Get in-depth insight into your Cisco network with PRTG sensors

As a Cisco Development Select Partner, Paessler PRTG is fully integrated with the Cisco ecosystem and comes with specially developed sensors for Cisco devices out of the box. By professionally monitoring Cisco-related parameters, you can exhaust all its possibilities:

  • Effortlessly obtain an overview of the Cisco system status
  • Get comprehensive reports on device status and your Cisco hardware like routers or switches
  • Gain valuable information on network traffic, connections, and users
  • Ensure system health, high performance, connection stability, and application security in your Cisco networks

Additional sensors use Cisco-specific NetFlow technology for traffic monitoring. From ADSL to VPN connections, all the way to VoIP applications: PRTG ensures the quality of your service and helps everyone work with peace of mind.

Table of content

Cisco performance monitoring: Keep an eye on routers, switches, and ports

Cisco router monitoring

Cisco routers are extremely stable and offer high levels of security, which makes them popular with network administrators. With PRTG, you can easily monitor your Cisco routers using NetFlow or SNMP.

Cisco switch monitoring

Cisco switches can often cause bottlenecks in a network. If a Cisco switch malfunctions or becomes overloaded, the entire network can suffer. Avoid this with professional switch monitoring, which automatically alerts you if problems arise and helps you avoid downtime.

Cisco port monitoring

PRTG uses NetFlow, SNMP, and packet sniffing to monitor open and closed ports. This helps you know if your Cisco ports are working properly, and determines how much (and which) traffic is flowing through the ports.

Cisco QoS monitoring

Monitor the quality of service of your Cisco devices with our built-in sensor for keeping an eye on Cisco CBQoS metrics, which uses data from Cisco’s Class-Based Quality of Service.

Cisco IP SLA monitoring

For Cisco devices that support IP SLA, you can use a preconfigured PRTG sensor for checking Cisco IP SLA parameters. Easily monitor your service level agreements and quality of service with PRTG.

What Cisco network monitoring looks like in PRTG

Diagnose network issues by continuously tracking the performance and health of your Cisco devices. Show bandwidth, traffic, VoIP, application performance, hardware health, and other key performance metrics in real time. Visualize monitoring data in clear graphs and dashboards to identify problems more easily. Gain the overview you need to troubleshoot outages and all kinds of other issues with your Cisco network.

Hardware monitoring in PRTG

Hardware monitoring in PRTG

PRTG Screenshot device tree view

Device tree view of the complete monitoring setup

PRTG screenshot map entire it infrastructure

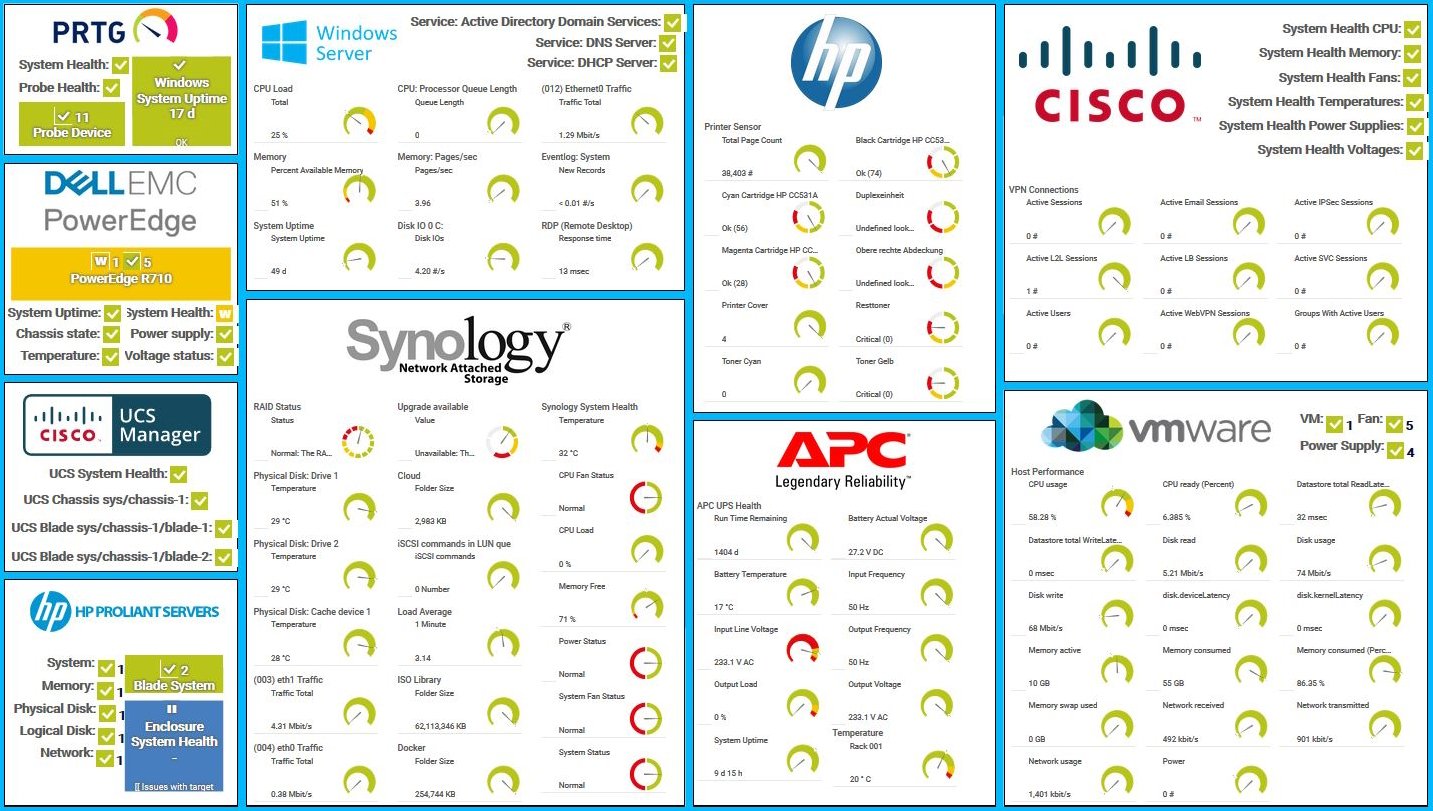
Custom PRTG dashboard for keeping an eye on the entire IT infrastructure

PRTG screenshot graph live data traffic

Live traffic data graph in PRTG

Start monitoring your Cisco network infrastructure with PRTG and see how it can make your network more reliable and your job easier.

Free download
PRODUCT OVERVIEW

IT experts agree: Paessler PRTG is a great solution for IT infrastructure monitoring

PCMag

“All-around winning
 network monitor”

IT Brief

“The real beauty of PRTG is the endless possibilities it offers”

ITPro

“PRTG Network Monitor 
is very hard to beat”

Get started in minutes with our predefined Cisco sensors

PRTG comes with more than 250 native sensor types for monitoring your entire on-premises, cloud, and hybrid cloud environment out of the box. Check out some examples below!

SNMP Cisco ADSL

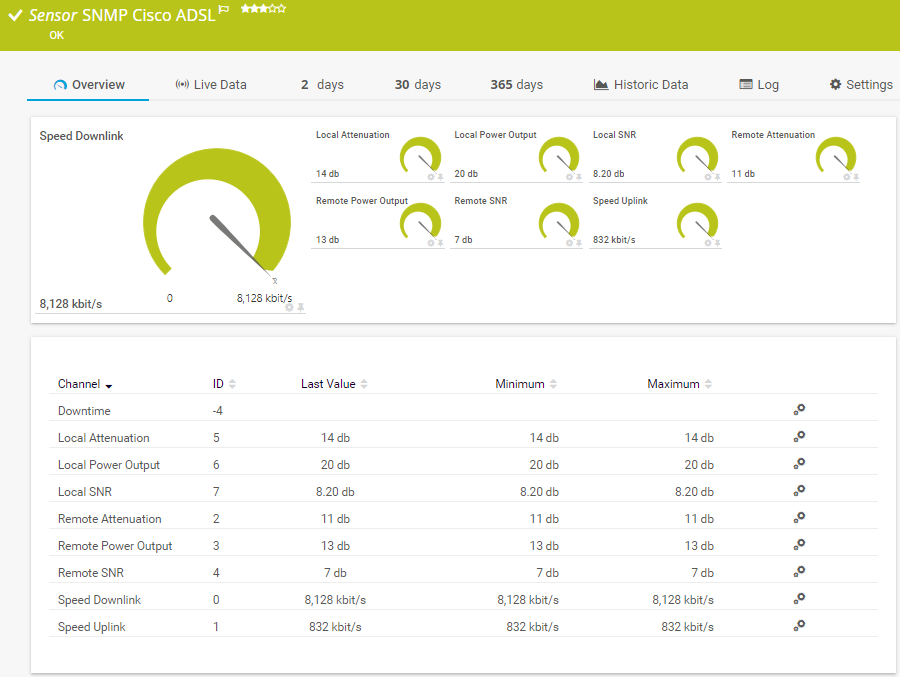
The SNMP Cisco ADSL sensor monitors asymmetric digital subscriber line (ADSL) statistics of a Cisco router. It can show the following:

  • Local and remote attenuation
  • Local and remote power output
  • Local and remote SNR
  • Downlink and uplink speed
SNMP Cisco ADSL
SNMP Cisco ADSL

SNMP Cisco System Health

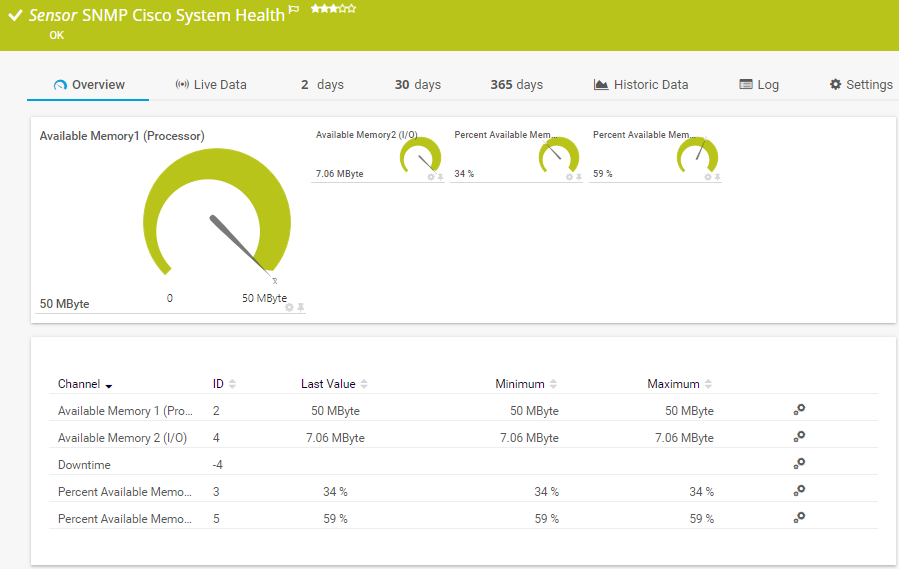
The SNMP Cisco System Health sensor monitors the system health of a Cisco device. It can show the following:

  • Available memory
  • CPU load
  • Fan status
  • Power supply status
SNMP Cisco System Health

SNMP Cisco UCS Blade

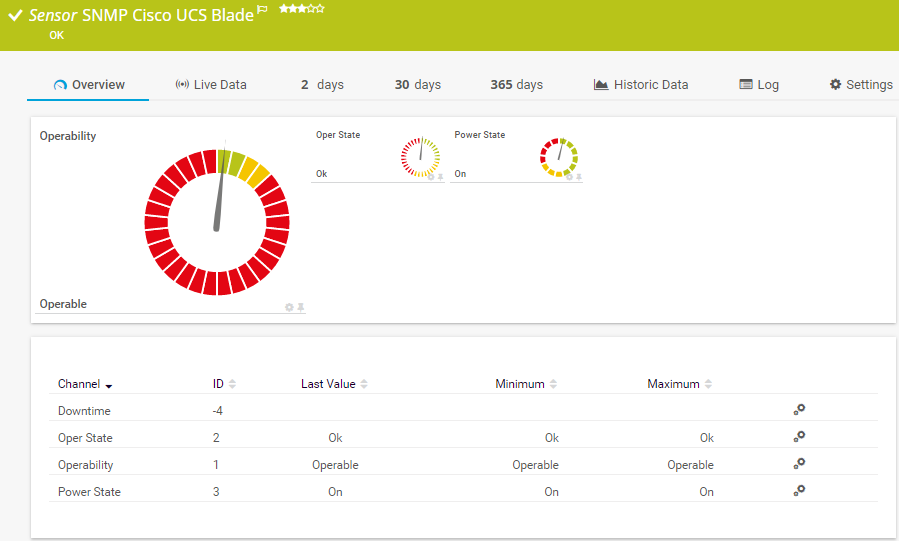
The SNMP Cisco UCS Blade sensor monitors the health status of a Cisco Unified Computing System blade server. It can show the following:

  • Oper status
  • Operability status
  • Power status
SNMP Cisco UCS Blade

SNMP Cisco UCS System Health

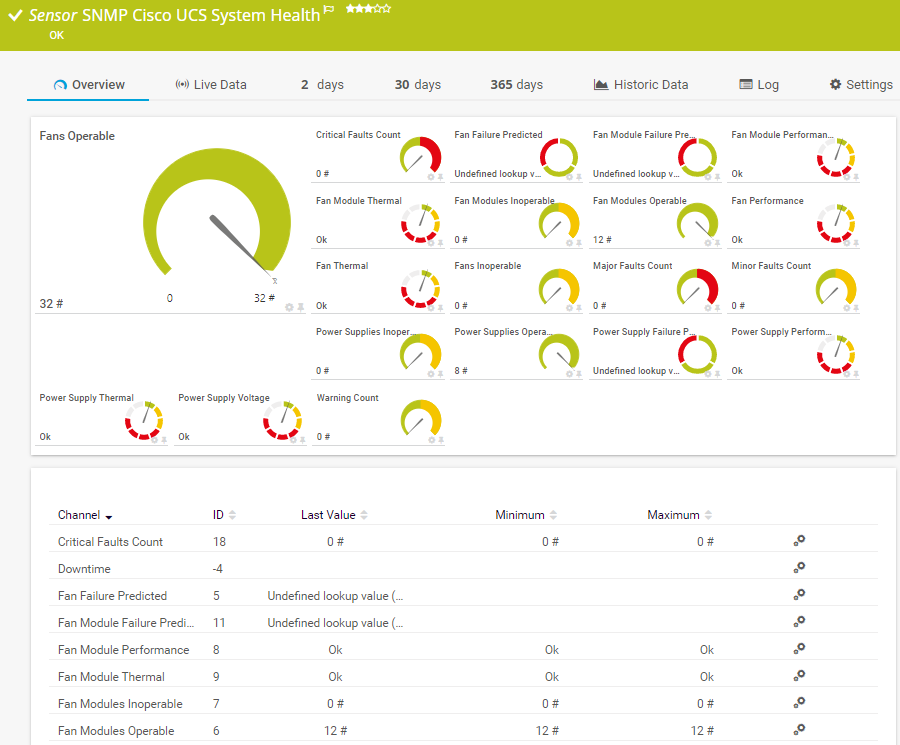
The SNMP Cisco UCS System Health sensor monitors the system health of a Cisco Unified Computing System device. It can show the following:

  • Number of minor, major, and critical faults
  • Predicted fan, fan module, and power supply failure status
  • Power supply performance, thermal, and voltage status
  • Number of operable and inoperable fan modules and power supplies
  • Fan performance and thermal status
SNMP Cisco UCS System Health

See the PRTG Manual for a list of all available sensor types.

Find the root cause of the problem with our PRTG Cisco monitoring solution

Real-time notifications mean faster troubleshooting so that you can act before more serious issues occur.

Free download
PRODUCT OVERVIEW

PRTG is compatible with all major vendors, products, and systems

compatible with all major vendors, products, and systems

7 reasons to choose PRTG as your Cisco monitoring tool

Easy VoIP benchmarking

PRTG pre-calculates specific parameters (e.g. ICPIF, MOS) right from the analysis stage because they are especially prone to data delays and losses. This makes it easier to directly perform benchmarking without additional calculations.

Complete quality assurance

By merging all relevant parameters in just a few PRTG sensors, you can easily measure the service quality of your Cisco network and use your findings to make sound future planning decisions.

IPsec VPN connections overview

For Cisco devices with Adaptive Security Appliance (ASA), you get an easy-to-read overviewof traffic, users, and IPsec-secured VPN connections. Finding out which users are online and offline is a cinch with PRTG.

System health at a glance

With PRTG, you get a clear and reliable overview of all necessary system health metrics, including temperature, CPU load, power supply status, fan status, and available memory.

Custom alerts & notifications

If an error occurs in your network or if one of your self-defined warning or error thresholds is exceeded, you’ll be notified immediately the way you want, including email, SMS, or in-app push notification.

Automation for a lighter workload

You no longer need to take the time to check each and every Cisco device manually due to PRTG’s easily configured sensors, customizable notifications, and individually created dashboards and maps.

Enhanced network security

Thanks to our Cisco-specific and clear-cut monitoring, you’ll be quicker to spot network security loopholes in your Cisco devices and prevent emergencies.

PRTG makes Cisco network monitoring as easy as it gets

Custom alerts and data visualization let you quickly identify and prevent Cisco network health, availability, and performance issues.

Free download
PRODUCT OVERVIEW

“From a server perspective, we're monitoring all of the key components of our service such as CPU usage, RAM disk space, the Windows services that it's running, and network connectivity of that server. In terms of networks, we’re monitoring all of our switches, firewalls, and access points. It’s really useful to be able to easily pull performance metrics from the PRTG dashboard.”

Ollie Kerslake, Infrastructure Lead
Riverford Organic Farmers

“The tool has given us greater control over all types of devices connected to the network (switches, IP telephony, security cameras, IoT, WiFi) that previously remained opaque when dealing with service incidents. This has improved our ability to diagnose and resolve problems, which has translated into greater efficiency and a better user experience in both internal and public services.”

Jordi Tolosà Bel, New Technologies Technician
Vinaroz City Council

“Our objective was to be able to monitor the health of our most critical servers containing data and applications, but also the flows and bandwidth between headquarters, our 50 servers in the cloud and the 15 servers at our production sites. For us, it is essential to have a proactive approach to understand where the weaknesses of the IT system are to be able to improve them.”

Marc Boullier, CIO
Carambar & Co

Your Cisco monitor at a glance – even on the go

PRTG is set up in a matter of minutes and can be used on a wide variety of mobile devices.

device overview
Cisco

We are a Cisco Select Developer Partner  

As a member of the Cisco Partner Program, Paessler is one of the market leaders that enhances the Cisco technology portfolio with products that are proven to easily integrate with Cisco devices.

What does this mean for you?

  • Easy integration of Cisco hardware and software with PRTG
  • State-of-the-art features for monitoring your Cisco environment
  • Expert technical support around your Cisco monitoring setup

Create innovative solutions with Paessler’s IT partners

Partnering with innovative IT vendors, Paessler unleashes synergies to create
new and additional benefits for joined customers.

baramundi

baramundi

baramundi and PRTG create a secure, reliable and powerful IT infrastructure where you have everything under control - from the traffic in your firewall to the configuration of your clients.

Read more
INSYS icom

INSYS icom

With the combination of PRTG and Insys, the monitoring specialist Paessler and the industrial gateway manufacturer INSYS icom offer a practical possibility to merge IT and OT.

Read more
Siemon

Siemon

Siemon and Paessler bring together intelligent building technology and advanced monitoring and make your vision of intelligent buildings and data centers become reality.

Read more

Find the root cause of the problem with our PRTG Cisco monitoring solution

Real-time notifications mean faster troubleshooting so that you can act before more serious issues occur.

Free download
PRODUCT OVERVIEW
Paessler PRTG

Paessler PRTG

Network Monitoring Software – Version 24.4.102.1351 (November 12th, 2024)

Hosting icon

Hosting

Download for Windows and cloud-based version PRTG Hosted Monitor available

Languages icon

Languages

English, German, Spanish, French, Portuguese, Dutch, Russian, Japanese, and Simplified Chinese

test

Monitor everything

Network devices, bandwidth, servers, applications, virtual environments, remote systems, IoT, and more

test

Pricing

Choose the PRTG Network Monitor subscription that's best for you

Discover more monitoring insights and stories

Resources Solution

Solutions for all your monitoring needs

  • Cisco Meraki monitoring
  • Cisco switch monitoring
  • Technology Partners: Cisco
Resources Content

Powerful stories from the monitoring world

  • Monitoring Cisco Devices With PRTG – Part 2/3
  • How to easily add and use Cisco Meraki sensors in PRTG
  • Monitoring Cisco Devices With PRTG – Part 1/3
Resources Solutions

Resources to master your monitoring challenges

  • Monitoring Cisco WLC, AP's, SSIDs
  • How can I monitor Cisco Webex with PRTG?
  • Monitoring CISCO UCS

Cisco Monitoring: FAQ


What is Cisco monitoring?

Cisco monitoring refers to the process of observing and managing Cisco network devices and services to ensure optimal performance, reliability, and security. This involves using specialized software tools like Paessler PRTG to track the health, status, and activity of routers, switches, firewalls, and other network components.

Key metrics include bandwidth usage, device uptime, latency, and error rates. Cisco network monitoring tools help detect issues earlier and become more proactive in troubleshooting.

How does Cisco monitoring with PRTG work?

PRTG uses SNMP and flow technologies to monitor Cisco devices.

SNMP

The Simple Network Management Protocol (SNMP) is the easiest way to monitor your network. Network and CPU loads are minimal, however an analysis with regard to protocol or an IP address is impossible. Use this protocol whenever you can for the most efficient monitoring.

NetFlow

NetFlow is a Cisco technology which minimizes bandwidth consumption by determining bandwidth usage within a device and collectively transmitting it to PRTG. NetFlow offers a higher degree of detail (e.g. per network protocol/IP address) than SNMP, and because of its low consumption, it is ideal for Cisco networks with a large amount of traffic.

How should I configure my Cisco devices to provide for the smoothest possible monitoring?

Find frequent questions and answers about Cisco monitoring also in our Knowledge Base:

  • Does my Cisco device (Router/Switch) support NetFlow Export?
  • Do you have any configuration tips for Cisco routers and PRTG?
  • Is it possible to monitor Cisco ASA Firewalls using Netflow 9 and PRTG?
  • How do I monitor Cisco ASA Firewalls using Netflow 9 and PRTG?
  • What are the right NetFlow settings? Ingress vs. Egress
Why should I use PRTG instead of Cisco Prime Network Analysis?

Cisco’s own monitoring software, Cisco Prime Network Analysis Module, cannot monitor hardware from other manufacturers the way PRTG can. Since many sysadmins manage IT infrastructures that contain hardware from a variety of manufacturers, it’s essential to use a monitoring tool like PRTG which incorporates the technology you’ll need to monitor almost any hardware. And with PRTG, you can view all monitoring data together on an easy-to-read dashboard.

What is a sensor in PRTG?

In PRTG, “sensors” are the basic monitoring elements. One sensor usually monitors one measured value in your network, for example the traffic of a switch port, the CPU load of a server, or the free space on a disk drive. On average, you need about 5-10 sensors per device or one sensor per switch port.

We asked: would you recommend PRTG? Over 95% of our customers say yes!

Paessler conducted trials in over 600 IT departments worldwide to tune its network monitoring software closer to the needs of sysadmins. The result of the survey: over 95% of the participants would recommend PRTG – or already have.

recommendation

Still not convinced?

Love

More than 500,000 sysadmins love PRTG

Paessler PRTG is used by companies of all sizes. Sysadmins love PRTG because it makes their job a whole lot easier.

PRTG

Monitor your entire IT infrastructure

Bandwidth, servers, virtual environments, websites, VoIP services – PRTG keeps an eye on your entire network.

test

Try Paessler PRTG for free

Everyone has different monitoring needs. That’s why we let you try PRTG for free.

PRTG Logo

Start monitoring Cisco devices with PRTG and see how it can make your network more reliable and your job easier.

Free download
PRODUCT OVERVIEW

Products

  • Paessler PRTG
    Paessler PRTGMonitor your whole IT infrastructure
    • PRTG Network Monitor
    • PRTG Enterprise Monitor
    • PRTG Hosted Monitor
    • PRTG extensions
      Extensions for Paessler PRTGExtend your monitoring to a new level
  • Icon Features
    FeaturesExplore all monitoring features

Monitoring with PRTG

  • Network monitoring
  • Bandwidth monitoring
  • SNMP monitoring
  • Network mapping
  • Wi-Fi monitoring
  • Server monitoring
  • Network traffic analyzer
  • NetFlow monitoring
  • Syslog server

Useful Links

  • PRTG Manual
  • Knowledge Base
  • Customer Success Stories
  • About Paessler
  • Subscribe to newsletter
  • PRTG Support
  • PRTG Consulting

Contact

Paessler GmbH
Thurn-und-Taxis-Str. 14, 
90411 Nuremberg 
Germany

info@paessler.com

+49 911 93775-0

  • Contact us
©2025 Paessler GmbHTerms & ConditionsPrivacy PolicyImprintReport VulnerabilityDownload & InstallSitemap
404 - Page not found 404 - Page not found 404 - Page not found