• Company
    • About Us
    • Case Studies
    • Press Center
    • Events
    • Careers
    • Blog
    • Contact us
  • Contact us
  • Login
 
  • English
    • Deutsch
    • Español
    • Français
    • Italiano
    • Português
Paessler
                    - The Monitoring Experts
  • Products
    • Paessler PRTG
      Paessler PRTGMonitor your whole IT infrastructure
      • PRTG Network Monitor
      • PRTG Enterprise Monitor
      • PRTG Hosted Monitor
      • PRTG extensionsExtensions for Paessler PRTGExtend your monitoring to a new level
    • Icon Features
      FeaturesExplore all monitoring features
      • Maps & dashboards
      • Alerts & notifications
      • Multiple user interfaces
      • Distributed monitoring
      • Customizable reporting
  • Solutions
    • Industries
      IndustriesMonitor various industry sectors
      • Industrial
      • Healthcare
      • Data Center
      • Education
      • Finance
      • Government
    • IT Topics
      IT TopicsMonitor all areas of IT
      • Network Monitoring
      • Bandwidth Monitoring
      • SNMP Monitor
      • Network Mapping
      • WiFi Monitoring
      • Server Monitoring
  • Pricing
  • Resources
    • Getting Started
      Getting StartedModules for self-paced learning
    • How-to Guides
      How-to GuidesGet the most out of PRTG
    • Videos & Webinars
      Videos & WebinarsLearn from Paessler experts
    • IT  Knowledge
      IT KnowledgeExpand your IT knowledge
    • PRTG Manual
      PRTG ManualFull documentation
    • Knowledge Base
      Knowledge BaseShare community knowledge
    • PRTG Sensor Hub
      PRTG Sensor HubGet sensors, scripts & templates
    • Trainings
      PRTG TrainingLearn how to work with PRTG
  • Partners
    • icon star
      New Partners and MSPBecome a new partner or MSP
    • icon partner
      Partner PortalLog in to your partner account
    • Deal Registration
      Deal RegistrationRegister your sales opportunities
    • icon search
      Find a PartnerFind partners selling Paessler products
    • icon technology
      Technology AlliancesSee Paessler technology partnerships
  • Company
    • About Us
    • Case Studies
    • Press Center
    • Events
    • Careers
    • Blog
    • Contact us
  • Contact us
  • Login
  • English
    • Deutsch
    • Español
    • Français
    • Italiano
    • Português
  • Get a quote
  • Free trial
  1. Home>
  2. IT Topics>
  3. Application>
  4. IIS Monitoring
PRTG Logo

IIS Monitoring with PRTG

Keep a 24/7 eye on your web servers, applications, and websites

  • Receive customizable alerts and notifications in real time
  • Secure the performance of your web pages and web transactions
  • Choose between out-of-the-box and custom IIS sensors
Free download
product overview

Our users give top ratings for monitoring with Paessler PRTG

Gartner peer insights
spiceworks
G2
Capterra

PRTG IIS monitoring: What you will find on this page

Table of content
  • Why IIS monitoring with PRTG is important
  • 4 ways PRTG makes IIS monitoring more effective
  • What IIS performance monitoring looks like in PRTG
  • 3 more reasons why to choose PRTG as your IIS monitoring tool
  • Explore our preconfigured PRTG sensors for IIS monitoring
  • IIS Monitoring: FAQ

PRTG makes Microsoft IIS monitoring as easy as it gets

Custom alerts and data visualization let you quickly identify and prevent IIS application and web server issues.

Free download
PRODUCT OVERVIEW

Why IIS monitoring with PRTG is important

Most companies depend on a high-performing, always available website, whether it means sales, customer acquisition, or customer care. No company can afford long response times or failures of its internet presence without risking serious losses.

IIS monitoring with Paessler PRTG helps secure your company website’s optimal performance by detecting malfunctions and warning you quickly so you can eliminate the problem and avoid costly downtime.

Table of content

4 ways PRTG makes IIS monitoring more effective

icon dashboard

Beyond website loading time

A ping to the website measures its response time – however, this does not necessarily indicate anything vital about the actual user experience.

PRTG monitors far more, such as the loading time of the source code or even the complete website including all content. It can also simulate logon or purchase processes.

icon server

Global web server monitoring

If your company operates internationally, accessibility of an IIS web server in the U.S. does not mean that customers from Europe or Asia have fast access.

PRTG allows monitoring of the web page from globally distributed locations. This goes beyond informing you that something is wrong and helps you figure out what is not working properly.

icon search

One solution to monitor everything

Many applications, such as IIS web servers and databases, also have a great impact on the performance of a website.

PRTG monitors everything at a glance – from web application performance to the health and availability of the underlying server hardware to load balancers that control data streams.

icon alarm

Avoid problems before they occur

With "classic" web page monitoring, the problem occurs and then you have to search for the cause of the problem. But PRTG reverses that.

Instead of reacting to existing problems, it alerts you before problems occur to empower you to proactively address the issue, making it easier to troubleshoot and saving costs.

What IIS performance monitoring looks like in PRTG

Diagnose network issues by continuously tracking the availability and performance of IIS web servers, applications, and IIS logs. Show response times, web service status, CPU usage, execution time, uptime, and other key metrics in real time. Visualize monitoring data in clear graphs and dashboards to identify problems more easily. Gain the overview you need to troubleshoot all issues with Microsoft IIS servers and applications that rely on them.

PRTG Screenshot device tree view

Device tree view of the complete monitoring setup

PRTG screenshot map entire it infrastructure

Custom PRTG dashboard for keeping an eye on the entire IT infrastructure

PRTG screenshot graph live data traffic

Live traffic data graph in PRTG

Start monitoring IIS servers with PRTG and see how it can make your network more reliable and your job easier.

Free download
PRODUCT OVERVIEW

IT experts agree: Paessler PRTG is a great solution for IT infrastructure monitoring

PCMag

“All-around winning
 network monitor”

IT Brief

“The real beauty of PRTG is the endless possibilities it offers”

ITPro

“PRTG Network Monitor 
is very hard to beat”

3 more reasons why to choose PRTG as your IIS monitoring tool

PRTG includes all functions for direct monitoring of your IIS servers, applications, and website, plus features for monitoring your entire network.

icon one

Web monitoring features

  • Website monitoring: website availability via ping; loading time for the complete page; transaction monitoring
  • Web server monitoring: Microsoft Internet Information Services (IIS), Apache
  • Email monitoring
  • Windows Performance Counter monitoring: locating network bottlenecks
icon two

Network monitoring features

  • Out-of-box monitoring of common devices (servers, switches, routers, firewalls, and more)
  • Support of standard protocols (SNMP, WMI, NetFlow, packet sniffing, and more)
  • Monitoring of virtual environments (VMware, Hyper-V, Citrix) and cloud environments (AWS, Azure)
icon three

General monitoring features

  • Documented API and templates for the simple creation of custom queries
  • Comprehensive alerting functionality with different notification methods (SMS, email, push notification, and more)
  • Great visualization options, for example customizable dashboards and maps
  • Storage of monitoring data in the original interval for precise long-term evaluations

Explore our preconfigured PRTG sensors for IIS monitoring

PRTG comes with more than 250 native sensor types for monitoring your entire on-premises, cloud, and hybrid cloud environment out of the box. Check out some examples below!

Windows IIS Application

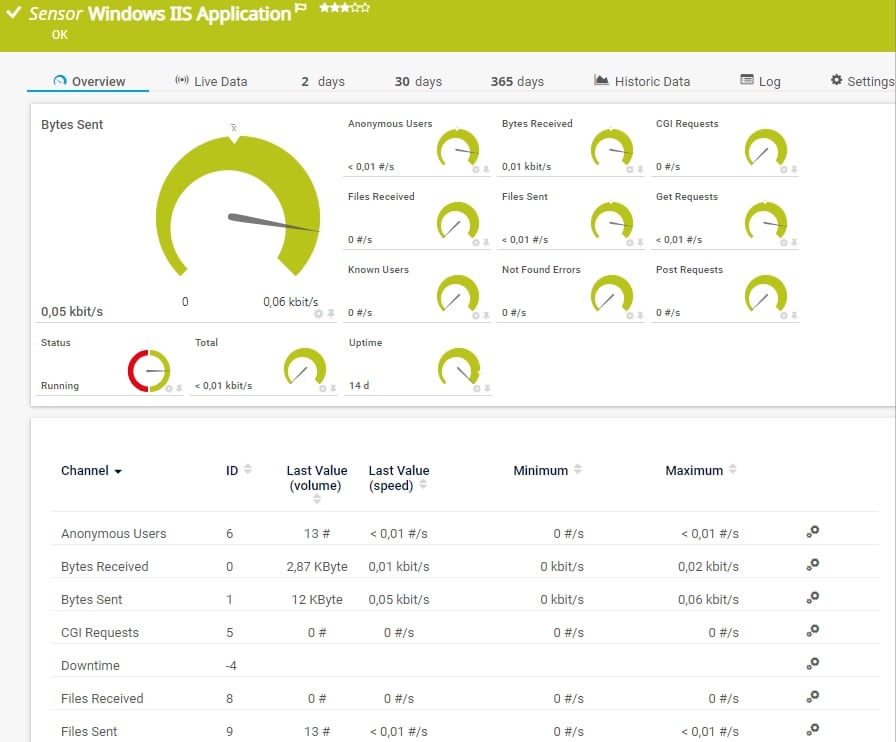
The Windows IIS Application sensor monitors a Microsoft Internet Information Services (IIS) server via Windows Management Instrumentation (WMI). It can also monitor applications that use IIS, such as Microsoft SharePoint or Microsoft Reporting Services (SSRS). It can show the following and more:

  • Number of anonymous and known users
  • Number of bytes and files sent and received
  • Number of CGI, GET, and POST requests
  • Web service status
  • Uptime
Windows IIS Applicatio

PerfCounter IIS Application Pool

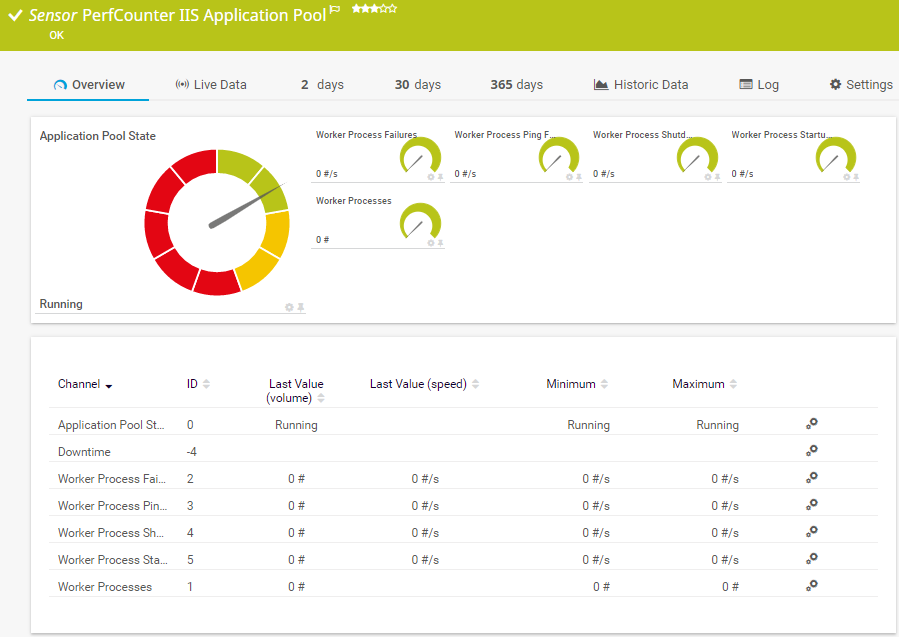
The PerfCounter IIS Application Pool sensor monitors a Microsoft Internet Information Services (IIS) application pool via Windows performance counters. It can show the following:

  • Overall application pool status
  • Number of failures in worker processes
  • Number of failures in worker process pings, startups, and shutdowns
  • Number of worker processes
PerfCounter IIS Application Poo

WMI Service

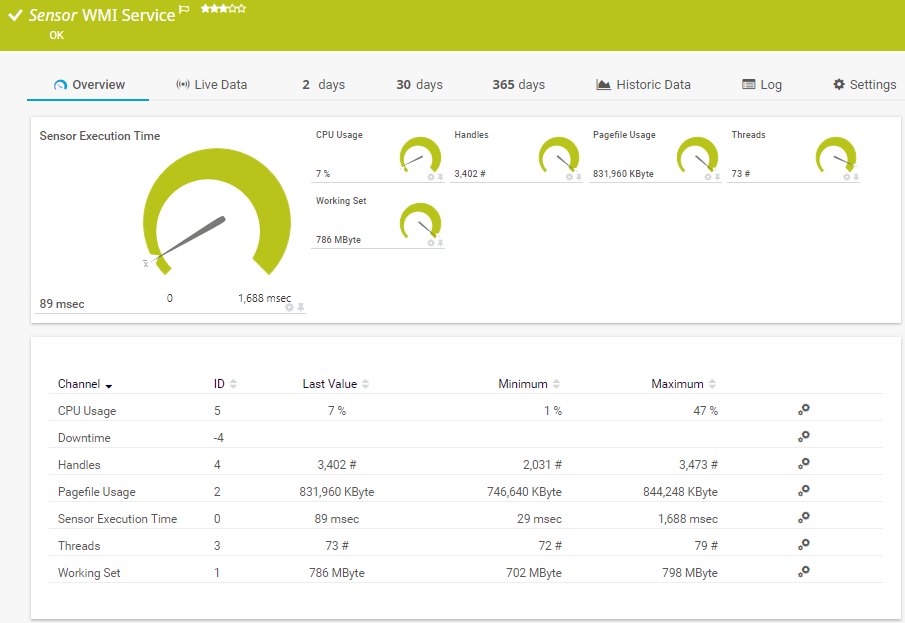
The WMI Service sensor monitors a Windows service. It can show the following:

  • CPU usage
  • Number of handles and threads
  • Pagefile usage
  • Execution time of the monitoring request
  • Working set
WMI Service
WMI Service

SNMP Windows Service

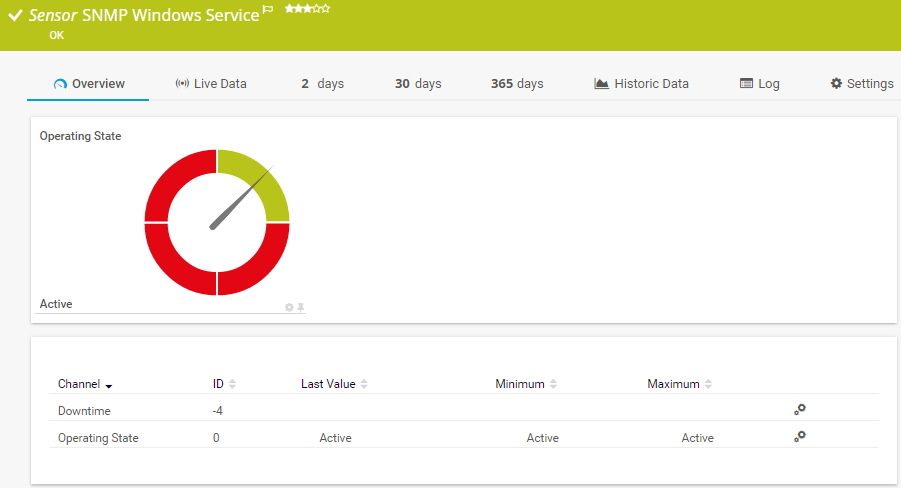
The SNMP Windows Service sensor monitors a Windows service. It can show the following:

  • Downtime
  • Operating state
SNMP Windows Service

See the PRTG Manual for a list of all available sensor types.

PRTG is compatible with all major vendors, products, and systems

compatible with all major vendors, products, and systems

PRTG makes Microsoft IIS monitoring as easy as it gets

Custom alerts and data visualization let you quickly identify and prevent IIS application and web server issues.

Free download
PRODUCT OVERVIEW

“Since using PRTG, we have matured how we report out overall application uptime, maintenance, and mean time between failure for all critical applications to our board of directors. PRTG allows us to not just look at a single event, but to leverage historical data to prevent future failures and to measure how we are making improve­ments over time.”

Bill Sorrells, CTO
Dayton Children's Hospital

“We have found these sophisticated levels of monitoring to be highly effective, improving the end user’s experience of the systems and applications in use, giving us the opportunity to provide a proactive resolution rather than having the end user raise issues.”

Saif Akil, Head of Service Management
Acurus

“Before PRTG, applications and hardware all gave messages, but all separately, so we had to search through hundreds of e-mails to find the problem. It was always only afterwards that we saw that something was going on within the infrastructure. To mitigate the issue, we also considered other software. PRTG stood out because of its user-friendliness, flexibility and minimal consultancy investment.”

Wim Vandenberghe, ICT Manager
Soenen Golfkarton

Your IIS monitor at a glance – even on the go

PRTG is set up in a matter of minutes and can be used on a wide variety of mobile devices.

device overview
Gartner peer insights

“Excellent tool for detailed monitoring. Alarms and notifications work greatly. Equipment addition is straight forward and server initial setup is very easy. ...feel safe to purchase it if you intend to monitor a large networking landscape.”

Read the complete review at Gartner Peer Insights

Create innovative solutions with Paessler’s IT partners

Partnering with innovative IT vendors, Paessler unleashes synergies to create
new and additional benefits for joined customers.

IP Fabric

IP Fabric

Combining PRTG’s broad monitoring feature set with IP Fabric’s automated network assurance creates a new level of network visibility and reliability.

Read more
Plixer

Plixer

Paessler and Plixer provide a complete solution adding flow and metadata analysis to a powerful network monitoring tool.

Read more
ScriptRunner

ScriptRunner

With ScriptRunner Paessler integrates a powerful event automation platform into PRTG Network Monitor.

Read more

Find the root cause of the problem with our PRTG IIS monitoring solution

Real-time notifications mean faster troubleshooting so that you can act before more serious issues occur.

Free download
PRODUCT OVERVIEW
Paessler PRTG

Paessler PRTG

Network Monitoring Software – Version 25.2.106.1114 (May 05th, 2025)

Hosting icon

Hosting

Download for Windows and cloud-based version PRTG Hosted Monitor available

Languages icon

Languages

English, German, Spanish, French, Portuguese, Dutch, Russian, Japanese, and Simplified Chinese

test

Monitor everything

Network devices, bandwidth, servers, applications, virtual environments, remote systems, IoT, and more

test

Pricing

Choose the PRTG Network Monitor subscription that's best for you

Discover more monitoring insights and stories

Resources Solution

Solutions for all your monitoring needs

  • Web server monitoring with PRTG: For Apache, IIS, NGINX, and more
  • Windows performance counter monitoring
  • Keep a constant eye on web server performance
Resources Content

Powerful stories from the monitoring world

  • Using Paessler PRTG to monitor applications and services
  • Monitor bandwidth consumption in a PRTG Enterprise Monitor environment
  • PRTG & The Exchange Admin (Part 2/6): Your Secret Weapon for Monitoring Exchange: Custom Sensors
Resources Solutions

Resources to master your monitoring challenges

  • Windows IIS Application Sensor
  • Is IIS required or something ?
  • PerfCounter IIS Application Pool Sensor

IIS Monitoring: FAQ


What is IIS?

IIS, or Internet Information Services, is a flexible, secure, and manageable web server developed by Microsoft. It is used to host websites, services, and applications on the Windows operating system. IIS supports various protocols, including HTTP, HTTPS, FTP, FTPS, SMTP, and NNTP, making it a versatile platform for web hosting and communication. Typical use cases include hosting static and dynamic websites, running web APIs and microservices, providing content delivery for applications, enabling secure file transfers via FTP/FTPS, and supporting enterprise applications, including SharePoint and Microsoft Exchange.

What is IIS monitoring?

IIS monitoring refers to the process of observing, analyzing, and managing the performance, availability, and health of an Internet Information Services (IIS) web server and the applications it hosts. Monitoring IIS helps ensure that websites and services are running efficiently, errors are minimized, and potential issues are detected before they impact users. Key aspects of IIS monitoring include:

  • CPU and memory usage: Monitors how much system resources IIS processes consume
  • Request processing time: Measures how long it takes to process HTTP requests
  • Network throughput: Tracks data sent and received, which indicates traffic levels
  • Worker processes (w3wp.exe): Monitors the health and behavior of IIS worker processes
  • Error rates: Keeps track of HTTP error codes (e.g., 404, 500).
  • Request queues: Measures the number of requests waiting to be processed
  • Availability: Monitors whether websites and applications are up and responsive
  • Transactions: Uses synthetic transactions to simulate user behavior and measure response times
  • Security: Monitors SSL/TLS certificate validity and encryption settings
Why should I monitor IIS?

Regular IIS monitoring is essential for maintaining the reliability and effectiveness of web applications hosted on IIS servers:

  • Proactive issue detection: Identifies problems before they impact users
  • Optimized performance: Helps fine-tune server and application performance
  • Improved availability: Minimizes downtime and ensures high availability
  • Enhanced security: Detects suspicious activity and potential vulnerabilities
  • Insightful reporting: Provides data for capacity planning and performance optimization
What is a sensor in PRTG?

In PRTG, “sensors” are the basic monitoring elements. One sensor usually monitors one measured value in your network, for example the traffic of a switch port, the CPU load of a server, or the free space on a disk drive. On average, you need about 5-10 sensors per device or one sensor per switch port.

We asked: would you recommend PRTG? Over 95% of our customers say yes!

Paessler conducted trials in over 600 IT departments worldwide to tune its network monitoring software closer to the needs of sysadmins. The result of the survey: over 95% of the participants would recommend PRTG – or already have.

recommendation

Still not convinced?

Love

More than 500,000 sysadmins love PRTG

Paessler PRTG is used by companies of all sizes. Sysadmins love PRTG because it makes their job a whole lot easier.

PRTG

Monitor your entire IT infrastructure

Bandwidth, servers, virtual environments, websites, VoIP services – PRTG keeps an eye on your entire network.

test

Try Paessler PRTG for free

Everyone has different monitoring needs. That’s why we let you try PRTG for free.

PRTG Logo

Start monitoring IIS servers with PRTG and see how it can make your network more reliable and your job easier.

Free download
PRODUCT OVERVIEW

Products

  • Paessler PRTG
    Paessler PRTGMonitor your whole IT infrastructure
    • PRTG Network Monitor
    • PRTG Enterprise Monitor
    • PRTG Hosted Monitor
    • PRTG extensions
      Extensions for Paessler PRTGExtend your monitoring to a new level
  • Icon Features
    FeaturesExplore all monitoring features

Monitoring with PRTG

  • Network monitoring
  • Bandwidth monitoring
  • SNMP monitoring
  • Network mapping
  • Wi-Fi monitoring
  • Server monitoring
  • Network traffic analyzer
  • NetFlow monitoring
  • Syslog server

Useful Links

  • PRTG Manual
  • Knowledge Base
  • Customer Success Stories
  • About Paessler
  • Subscribe to newsletter
  • PRTG Support
  • PRTG Consulting

Contact

Paessler GmbH
Thurn-und-Taxis-Str. 14, 
90411 Nuremberg 
Germany

info@paessler.com

+49 911 93775-0

  • Contact us
©2025 Paessler GmbHTerms & ConditionsPrivacy PolicyImprintReport VulnerabilityDownload & InstallSitemap
404 - Page not found 404 - Page not found 404 - Page not found