• Company
    • About Us
    • Case Studies
    • Press Center
    • Events
    • Careers
    • Blog
    • Contact us
  • Login
 
  • English
    • Deutsch
    • Español
    • Français
    • Italiano
    • Português
Paessler
                    - The Monitoring Experts
  • Products
    • Paessler PRTG
      Paessler PRTGMonitor your whole IT infrastructure
      • PRTG Network Monitor
      • PRTG Enterprise Monitor
      • PRTG Hosted Monitor
      • PRTG extensionsExtensions for Paessler PRTGExtend your monitoring to a new level
    • Icon Features
      FeaturesExplore all monitoring features
      • Maps & dashboards
      • Alerts & notifications
      • Multiple user interfaces
      • Distributed monitoring
      • Customizable reporting
  • Solutions
    • Industries
      IndustriesMonitor various industry sectors
      • Industrial
      • Healthcare
      • Data Center
      • Education
      • Finance
      • Government
    • IT Topics
      IT TopicsMonitor all areas of IT
      • Network Monitoring
      • Bandwidth Monitoring
      • SNMP Monitor
      • Network Mapping
      • WiFi Monitoring
      • Server Monitoring
  • Pricing
  • Resources
    • Getting Started
      Getting StartedModules for self-paced learning
    • How-to Guides
      How-to GuidesGet the most out of PRTG
    • Videos & Webinars
      Videos & WebinarsLearn from Paessler experts
    • IT  Knowledge
      IT KnowledgeExpand your IT knowledge
    • PRTG Manual
      PRTG ManualFull documentation
    • Knowledge Base
      Knowledge BaseShare community knowledge
    • PRTG Sensor Hub
      PRTG Sensor HubGet sensors, scripts & templates
    • Trainings
      PRTG TrainingLearn how to work with PRTG
  • Partners
    • icon star
      New Partners and MSPBecome a new partner or MSP
    • icon partner
      Partner PortalLog in to your partner account
    • icon search
      Find a PartnerFind partners selling Paessler products
    • icon technology
      Technology AlliancesSee Paessler technology partnerships
  • Company
    • About Us
    • Case Studies
    • Press Center
    • Events
    • Careers
    • Blog
    • Contact us
  • Login
  • English
    • Deutsch
    • Español
    • Français
    • Italiano
    • Português
  • Get a quote
  • Free trial
  1. Home>
  2. IT Topics>
  3. Technology>
  4. Windows Performance Counter Monitoring
PRTG Logo

Windows Performance Counter Monitoring with PRTG

Supercharge your Windows performance

  • Identify & resolve Windows performance issues before they impact productivity
  • Make informed decisions on system enhancements, upgrades, and resource allocation
  • Ensure system security and compliance by identifying anomalies or vulnerabilities
Free download
product overview

Our users give top ratings for monitoring with Paessler PRTG

Gartner peer insights
spiceworks
Capterra
G2
Trustpilot

PRTG Windows performance counter monitoring: What you will find on this page

Table of content
  • Elevate your Windows performance monitoring game
  • What Windows performance counter monitoring looks like in PRTG
  • 3 reasons to choose PRTG as your Windows performance monitoring tool
  • Explore our preconfigured PRTG sensors for Windows performance data
  • Monitoring Windows performance counters: FAQ

PRTG makes Windows performance counter monitoring as easy as it gets

Custom alerts and data visualization let you quickly identify and prevent hardware, application, and service issues.

Free download
PRODUCT OVERVIEW

Elevate your Windows performance monitoring game

Ensuring your Windows Servers and applications are running smoothly isn’t just an IT task – it’s the backbone that keeps your digital world spinning. Enter Paessler PRTG’s Windows performance counter monitoring, your round-the-clock champion for keeping those critical systems in top shape.

Icon clock

Dive deep with detailed metrics in real time

Peek under the hood of your Windows infrastructure with the precision only PRTG can offer. Leveraging Windows performance counters, PRTG becomes the Sherlock Holmes of monitoring.

Deduct the health and performance of your system by analyzing everything from CPU load to memory usage. You get a comprehensive overview of your servers without the complications.

Icon alarm bell

Custom alerts: The early bird catches the worm

Why wait for trouble to knock on your door? With PRTG’s customizable alerts, you’re the early bird. Set up your monitoring thresholds to fit the unique needs of your IT landscape.

Whether it's a spike in memory usage or a bandwidth bottleneck, PRTG sends you a nudge via email, SMS, push notification, and more, so you can act before it becomes a headache.

Icon boost arrows

Keep it simple & smart with all-in-one monitoring

Embrace the simplicity of monitoring with PRTG. Instead of juggling multiple tools that barely talk to each other, get a comprehensive view of your IT environment.

PRTG slices through the complexity quickly, providing a seamless monitoring experience that covers all your hardware, services, and applications – on-premises or in the cloud – with zero fuss.

Icon chat

Secure and streamline your communications

With PRTG, your data’s security is non-negotiable. Rest easy knowing that communication between your PRTG server and monitored devices is encrypted and secure.

We use only top-tier encryption methods, ensuring that your data stays private and protected.

What Windows performance counter monitoring looks like in PRTG

Diagnose network issues by continuously tracking your Microsoft Windows machines with performance counters, WMI, SNMP, PowerShell, and more. Show physical disk usage, disk read and write speed, log file data, Active Directory replication, and other key Windows performance metrics in real time. Visualize monitoring data in clear graphs and dashboards to identify problems more easily. Gain the overview you need to troubleshoot your Windows systems and optimize resource usage.

PRTG Screenshot device tree view

Device tree view of the complete monitoring setup

PRTG screenshot map entire it infrastructure

Custom PRTG dashboard for keeping an eye on the entire IT infrastructure

PRTG screenshot graph live data traffic

Live traffic data graph in PRTG

Start monitoring Windows performance with PRTG and see how it can make your network more reliable and your job easier.

Free download
PRODUCT OVERVIEW

IT experts agree: Paessler PRTG is a great solution for IT infrastructure monitoring

PCMag

“All-around winning
 network monitor”

IT Brief

“The real beauty of PRTG is the endless possibilities it offers”

ITPro

“PRTG Network Monitor 
is very hard to beat”

3 reasons to choose PRTG as your Windows performance monitoring tool

Icon click

Full coverage

Monitor not just your Windows system and services, but also the performance of applications running on an IIS server, making sure nothing slips through the cracks. PRTG Windows performance monitoring gives you as much or as little detail as necessary.

Icon Statistics Graph

Critical insights

Get the lowdown on important performance metrics like CPU usage, memory load, or processor time, and drill deeper to find out where the root cause of an issue lies – in the network, hardware, or application itself. PRTG is the high-tech crystal ball for your IT environment.

Icon update

Real-time updates

Stay informed with live monitoring that keeps you in the loop, whether you’re in the office or making a midnight snack run. With PRTG’s alert system, you’re always the first to know when something’s amiss, allowing you to take action faster and proactively.

Explore our preconfigured PRTG sensors for Windows performance data

PRTG comes with more than 250 native sensor types for monitoring your entire on-premises, cloud, and hybrid cloud environment out of the box. Check out some examples below!

PerfCounter Custom

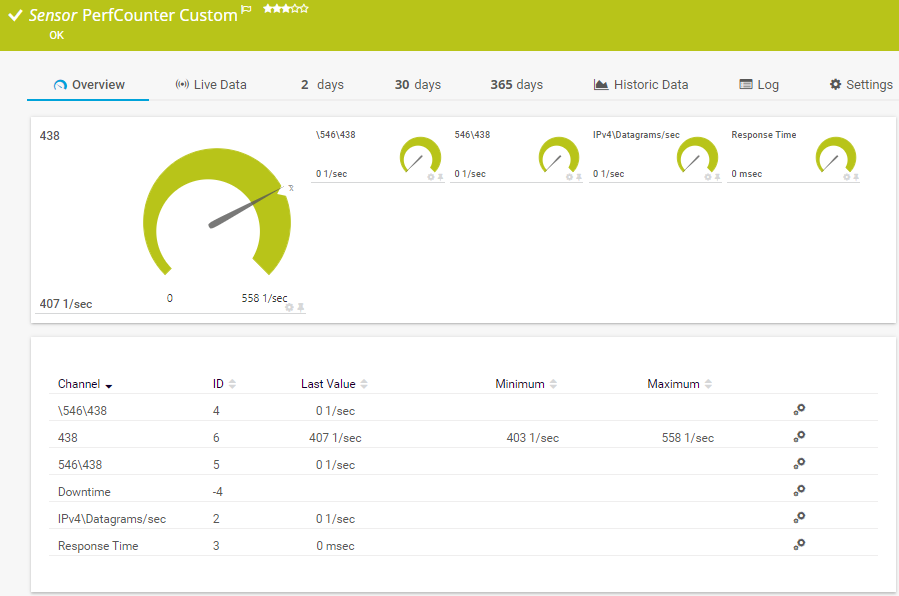
The PerfCounter Custom sensor monitors a configured set of Windows performance counters. You can define your own channels. It can show the following:

  • Downtime
  • Windows performance counters in different channels
PerfCounter Custom
PerfCounter Custom

PerfCounter IIS Application Pool

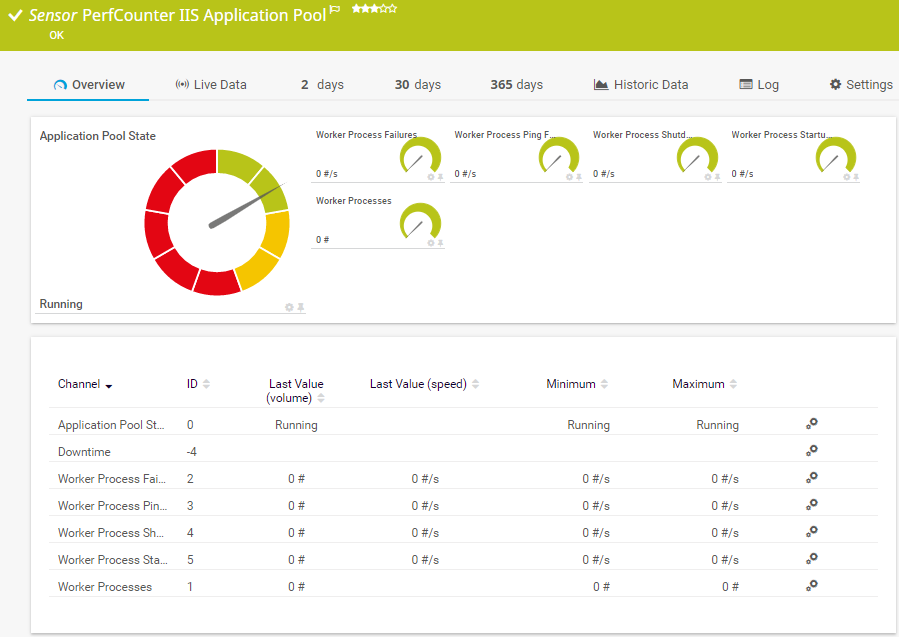
The PerfCounter IIS Application Pool sensor monitors a Microsoft Internet Information Services (IIS) application pool via Windows performance counters. It can show the following:

  • Overall application pool status
  • Number of failures in worker processes
  • Number of failures in worker process pings, startups, and shutdowns
  • Number of worker processes
PerfCounter IIS Application Poo

Windows IIS Application

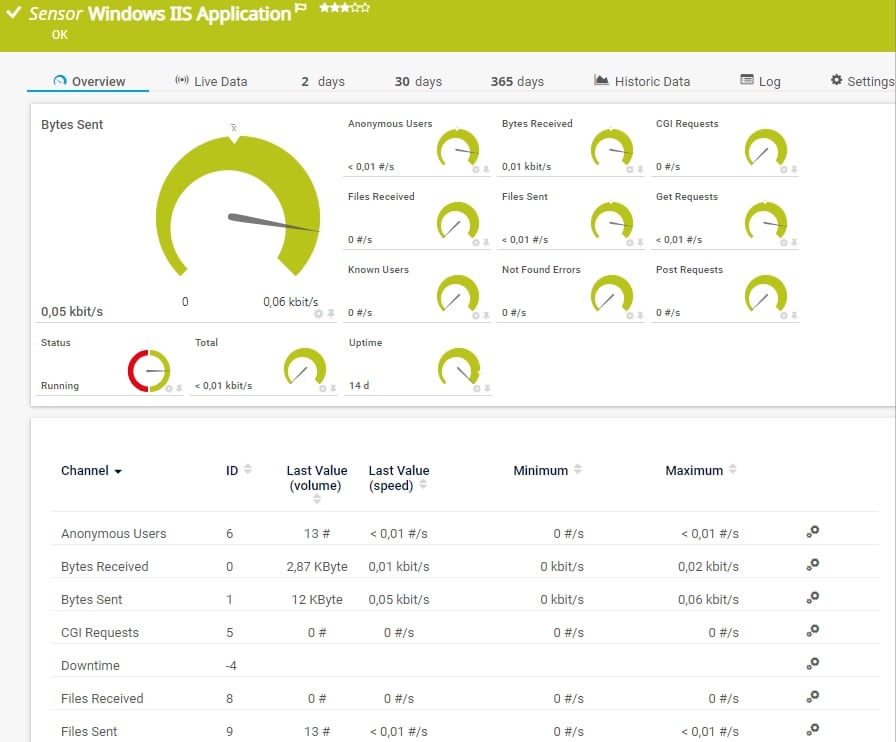
The Windows IIS Application sensor monitors a Microsoft Internet Information Services (IIS) server via Windows Management Instrumentation (WMI). It can also monitor applications that use IIS, such as Microsoft SharePoint or Microsoft Reporting Services (SSRS). It can show the following and more:

  • Number of anonymous and known users
  • Number of bytes and files sent and received
  • Number of CGI, GET, and POST requests
  • Web service status
  • Uptime
Windows IIS Applicatio

See the PRTG Manual for a list of all available sensor types.

PRTG is compatible with all major vendors, products, and systems

compatible with all major vendors, products, and systems

PRTG makes Windows performance counter monitoring as easy as it gets

Custom alerts and data visualization let you quickly identify and prevent hardware, application, and service issues.

Free download
PRODUCT OVERVIEW

“We strive to equip our systems with state-of-the-art technology to safeguard our educational practices for the future. Part of this includes ensuring that all our systems run smoothly at all times. On any given day, we rarely have time to keep an eye on all our systems. We therefore decided to monitor our school’s IT environment with a centralized network monitoring tool.”

Stefan Roschewitz, IT administrator
BBS Holzminden

“We want to include the tool in our set of solutions in order to solve problems more proactively in our technology infrastructure. PRTG has exceeded all our expectations because it is a reliable, extremely easy-to-use solution. There is no doubt that it lives up to the renowned quality of German technology.”

Esbin Saúl Lázaro García, IT Infrastructure and Security Engineer
Hospital El Pilar

“The reactivity, know-how, and technical solutions of Paessler are outstanding in every situation. For me, no monitoring tool compares to PRTG.”

Andreas Reimann, Senior Networking Communication Architect
Zurich Airport

Your Windows performance counter monitor at a glance – even on the go

PRTG is set up in a matter of minutes and can be used on a wide variety of mobile devices.

device overview
Gartner peer insights

“Great interface, intuitive, full REST support. custom scripts, rest sensors add extra value. We have been using PRTG for 10 years now in multiple environments and use cases. it has by far the best interface and very easy to setup without prior experience.”

Read the complete review at Gartner Peer Insights

Create innovative solutions with Paessler’s IT partners

Partnering with innovative IT vendors, Paessler unleashes synergies to create
new and additional benefits for joined customers.

Rittal

Rittal

IT that works constitutes a business-critical basis for a company's success. Availability and security must be defined for the respective purpose and closely monitored – by OT and IT alike.

Read more
NetBrain

NetBrain

Integrating monitoring results from PRTG into NetBrain maps makes the foundation for network automation.

Read more
ScriptRunner

ScriptRunner

With ScriptRunner Paessler integrates a powerful event automation platform into PRTG Network Monitor.

Read more

Find the root cause of the problem with our PRTG performance counter monitoring solution

Real-time notifications mean faster troubleshooting so that you can act before more serious issues occur.

Free download
PRODUCT OVERVIEW
Paessler PRTG

Paessler PRTG

Network Monitoring Software – Version 24.4.102.1351 (November 12th, 2024)

Hosting icon

Hosting

Download for Windows and cloud-based version PRTG Hosted Monitor available

Languages icon

Languages

English, German, Spanish, French, Portuguese, Dutch, Russian, Japanese, and Simplified Chinese

test

Monitor everything

Network devices, bandwidth, servers, applications, virtual environments, remote systems, IoT, and more

test

Pricing

Choose the PRTG Network Monitor subscription that's best for you

Discover more monitoring insights and stories

Resources Solution

Solutions for all your monitoring needs

  • Network performance monitoring
  • Windows monitoring
  • PRTG Microsoft server monitoring
Resources Content

Powerful stories from the monitoring world

  • Sensor of the Week: WMI Microsoft SQL Server Sensor
  • PRTG & The Exchange Admin (Part 2/6): Your Secret Weapon for Monitoring Exchange: Custom Sensors
  • Get more visibility into Hyper-V Server
Resources Solutions

Resources to master your monitoring challenges

  • How can I find out the names of available performance counters?
  • PerfCounter Custom Sensor
  • WMI, Performance Counters and local credentials

Windows Performance Counter Monitoring: FAQ


What are Windows performance counters?

Performance counters are specialized tools within an operating system that collect and measure data about the system’s performance. In the context of Windows, performance counters track a wide array of system and application metrics, such as CPU usage, disk I/O, memory usage, network activity, and more.

This data provides valuable insights into how well the system and its components are functioning, helping identify bottlenecks, inefficiencies, or potential issues before they escalate. Essentially, performance counters serve as the pulse check for your IT environment, offering a real-time glimpse into the health and performance of your Windows systems.

What is the preferred technology for monitoring Windows performance with PRTG?

There are a few good reasons for using performance counters as monitoring technology for Windows Server: WMI, Microsoft's default method for monitoring Windows systems, uses an excessive amount of network resources and is sometimes unstable.

PRTG offers so-called "hybrid sensors" by default, which first attempt to request the desired data (such as CPU load) via performance counters, and only resort to WMI if performance counters are unavailable or cannot be read for some other reason.

From the point of view of performance, SNMP is definitely our top choice for monitoring Windows devices, but in certain cases this monitoring technology is inappropriate. Some data is simply not available on Windows machines via SNMP; in such cases, performance counters are often the better bet.

Why should I monitor Windows performance counters with PRTG?

All performance counters built into Windows are fully supported by PRTG. Take a look at your Windows Performance Monitor as described in our Knowledge Base article: Sometimes it's incredible to think of just how many performance counters there are for Windows apps! These also include those which do not come from Microsoft itself, for such counters often provide surprising insights into applications and processes.

Does PRTG only monitor basic Windows metrics?

No way! PRTG dives deep, offering detailed insights into a wide range of performance counters delivered by Window’s own performance monitor (perfmon.exe). Whether it's for a server, application, or hardware component, if Windows can track it, PRTG can monitor it.

Will PRTG alert me if there’s an issue with my Windows performance?

Yes, indeed. PRTG doesn’t just keep an eye on things; it also gives you a heads-up with customizable alerts. Keep your Windows servers and applications performing like a well-oiled machine with PRTG’s Windows performance counter monitoring. It’s the smarter, simpler way to ensure your IT infrastructure is surviving and thriving.

What is a sensor in PRTG?

In PRTG, “sensors” are the basic monitoring elements. One sensor usually monitors one measured value in your network, for example the traffic of a switch port, the CPU load of a server, or the free space on a disk drive. On average, you need about 5-10 sensors per device or one sensor per switch port.

We asked: would you recommend PRTG? Over 95% of our customers say yes!

Paessler conducted trials in over 600 IT departments worldwide to tune its network monitoring software closer to the needs of sysadmins. The result of the survey: over 95% of the participants would recommend PRTG – or already have.

recommendation

Still not convinced?

Love

More than 500,000 sysadmins love PRTG

Paessler PRTG is used by companies of all sizes. Sysadmins love PRTG because it makes their job a whole lot easier.

PRTG

Monitor your entire IT infrastructure

Bandwidth, servers, virtual environments, websites, VoIP services – PRTG keeps an eye on your entire network.

test

Try Paessler PRTG for free

Everyone has different monitoring needs. That’s why we let you try PRTG for free.

PRTG Logo

Start monitoring Windows performance with PRTG and see how it can make your network more reliable and your job easier.

Free download
PRODUCT OVERVIEW

Products

  • Paessler PRTG
    Paessler PRTGMonitor your whole IT infrastructure
    • PRTG Network Monitor
    • PRTG Enterprise Monitor
    • PRTG Hosted Monitor
    • PRTG extensions
      Extensions for Paessler PRTGExtend your monitoring to a new level
  • Icon Features
    FeaturesExplore all monitoring features

Monitoring with PRTG

  • Network monitoring
  • Bandwidth monitoring
  • SNMP monitoring
  • Network mapping
  • Wi-Fi monitoring
  • Server monitoring
  • Network traffic analyzer
  • NetFlow monitoring
  • Syslog server

Useful Links

  • PRTG Manual
  • Knowledge Base
  • Customer Success Stories
  • About Paessler
  • Subscribe to newsletter
  • PRTG Support
  • PRTG Consulting

Contact

Paessler GmbH
Thurn-und-Taxis-Str. 14, 
90411 Nuremberg 
Germany

info@paessler.com

+49 911 93775-0

  • Contact us
©2025 Paessler GmbHTerms & ConditionsPrivacy PolicyImprintReport VulnerabilityDownload & InstallSitemap
404 - Page not found 404 - Page not found 404 - Page not found