Custom alerts and data visualization let you quickly identify and prevent downtime, unauthorized access, and traffic anomalies.
Gain complete visibility into your IIS log files to help diagnose server issues, prevent security threats, and improve performance. PRTG transforms log data into actionable insights, enabling you to respond quickly and efficiently to keep your web servers running smoothly and securely.
PRTG automates the creation of reports, giving you insight into key metrics such as status codes, IP addresses and traffic patterns. These reports help you monitor server performance and ensure compliance with internal or external standards.
Custom alerts notify you immediately when critical thresholds are exceeded, such as unauthorized access attempts or high error rates. This real-time feedback allows you to respond quickly to potential issues, significantly reducing downtime.
Consolidate IIS log monitoring with data from other systems such as Apache and NGINX into one intuitive dashboard, simplifying the log management process. This integration makes it easier for IT teams to troubleshoot and analyze performance across multiple platforms.
Transforming raw IIS log data into visually appealing graphs and dashboards allows you to identify trends and quickly locate bottlenecks. This clarity provides a comprehensive view of server health, enabling proactive problem resolution.
Diagnose network issues by continuously tracking IIS log data. Show status codes, IP addresses and other key metrics in real time. Visualize monitoring data in clear graphs and dashboards to identify problems more easily. Gain the overview you need to troubleshoot web server performance and security threats.

Device tree view of the complete monitoring setup
Custom PRTG dashboard for keeping an eye on the entire IT infrastructure
Live traffic data graph in PRTG
“All-around winning
network monitor”
“The real beauty of PRTG is the endless possibilities it offers”
“PRTG Network Monitor
is very hard to beat”
PRTG is more than just a monitoring tool; it is designed to fit seamlessly into your workflow. With flexible licensing, responsive support and a proven track record of reliability, our monitoring solution ensures you get the most out of your storage infrastructure without unnecessary complexity.
PRTG makes it easy to get started. With minimal configuration required, you can start monitoring your IIS logs right away. The intuitive interface allows you to set up custom dashboards, alerts and reports without requiring extensive technical knowledge.
PRTG offers a simple and flexible subscription model that fits companies of all sizes. Whether you're a small IT team or managing a large infrastructure, PRTG offers scalable licensing options that allow you to expand monitoring as your network grows.
When you choose PRTG, you get more than just a tool - you get a dedicated team ready to help whenever you need it. Our support team provides fast, expert assistance, whether you have technical questions or need guidance for your specific environment.
PRTG comes with more than 250 native sensor types for monitoring your entire on-premises, cloud, and hybrid cloud environment out of the box. Check out some examples below!
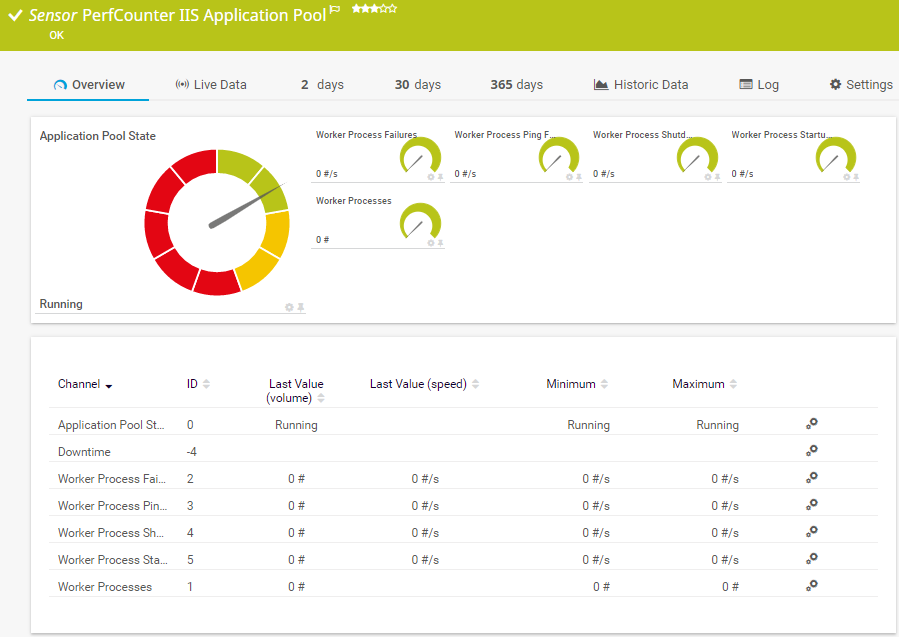
The PerfCounter IIS Application Pool sensor monitors a Microsoft Internet Information Services (IIS) application pool via Windows performance counters. It can show the following:
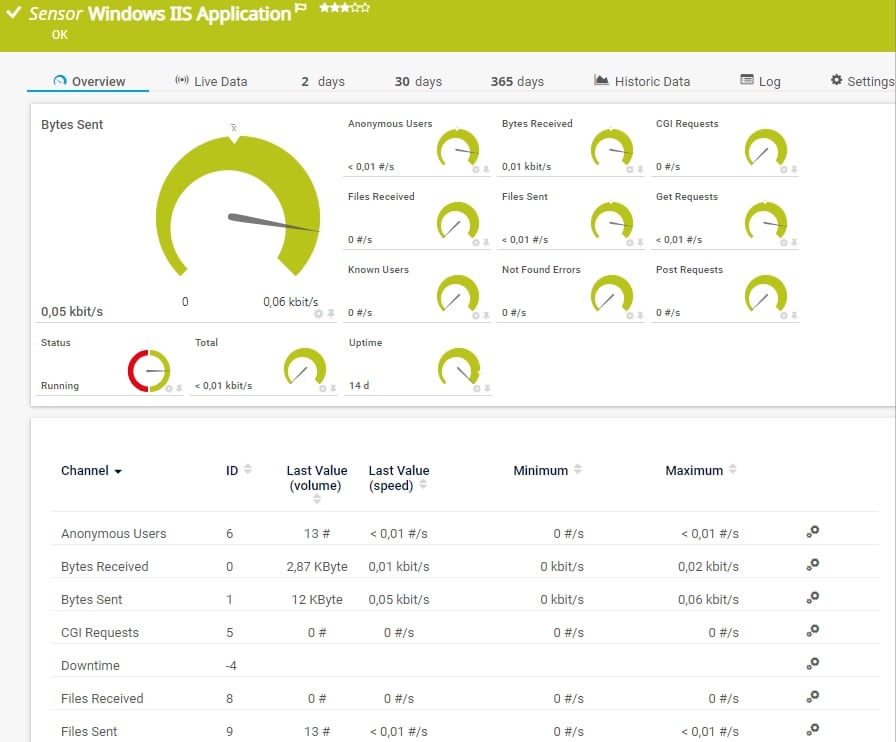
The Windows IIS Application sensor monitors a Microsoft Internet Information Services (IIS) server via Windows Management Instrumentation (WMI). It can also monitor applications that use IIS, such as Microsoft SharePoint or Microsoft Reporting Services (SSRS). It can show the following and more:
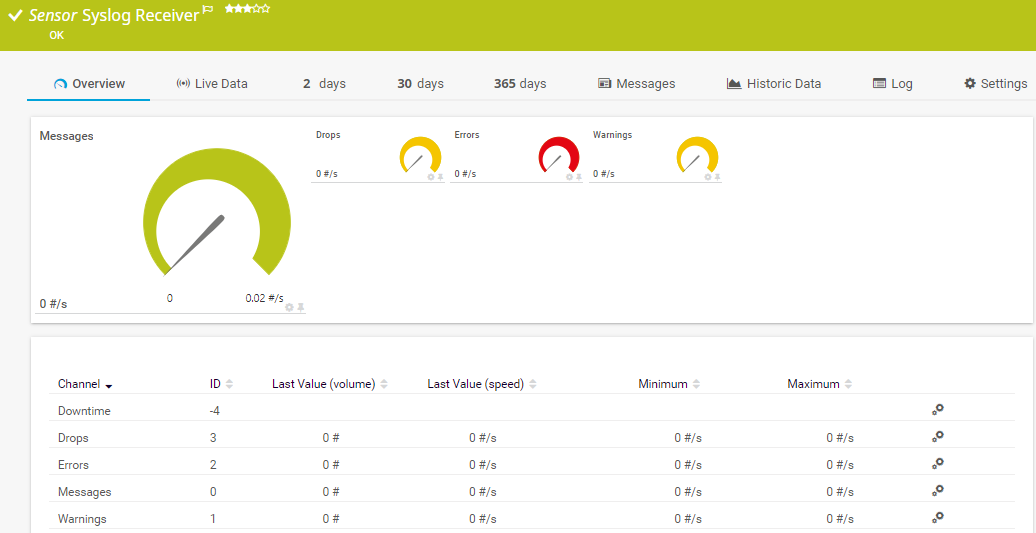
The Syslog Receiver sensor receives and analyzes Syslog messages. It can show the following:
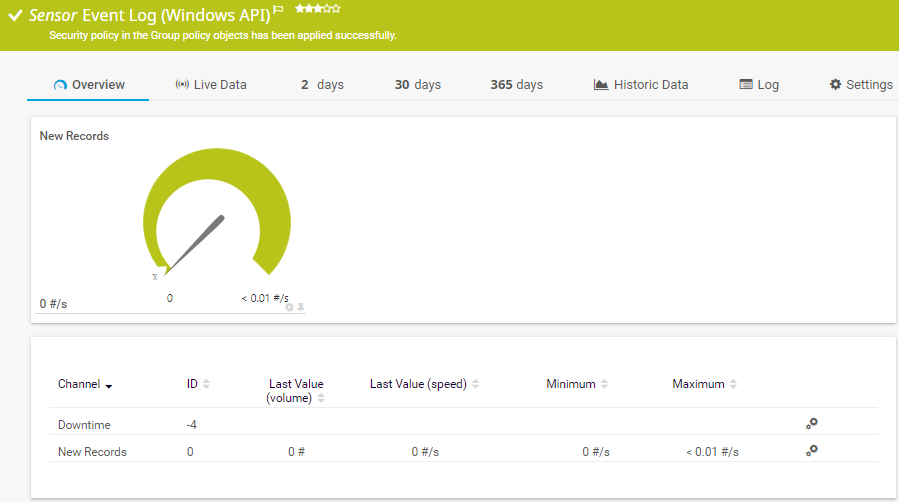
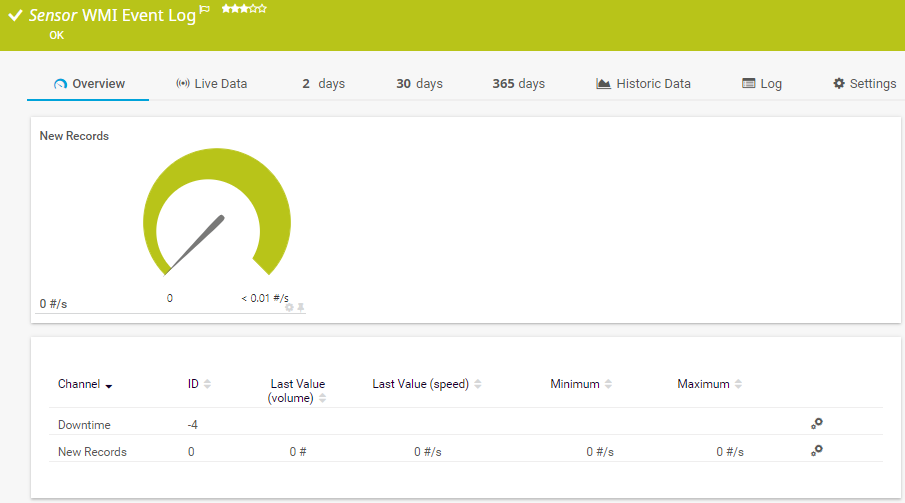
The WMI Event Log sensor monitors a Windows log file. It can show the following:
See the PRTG Manual for a list of all available sensor types.

Custom alerts and data visualization let you quickly identify and prevent downtime, unauthorized access, and traffic anomalies.
PRTG is set up in a matter of minutes and can be used on a wide variety of mobile devices.

As a member of the Cisco Partner Program, Paessler is one of the market leaders that enhances the Cisco technology portfolio with products that are proven to easily integrate with Cisco devices.
What does this mean for you?
Partnering with innovative IT vendors, Paessler unleashes synergies to create
new and additional benefits for joined customers.
UVexplorer integrates tightly with PRTG to bring fast and accurate network discovery, detailed device inventory, and automatic network mapping to the PRTG platform.
Combining PRTG’s broad monitoring feature set with IP Fabric’s automated network assurance creates a new level of network visibility and reliability.
baramundi and PRTG create a secure, reliable and powerful IT infrastructure where you have everything under control - from the traffic in your firewall to the configuration of your clients.
Network Monitoring Software – Version 25.3.110.1313 (August 27, 2025)
Download for Windows and cloud-based version PRTG Hosted Monitor available
English, German, Spanish, French, Portuguese, Dutch, Russian, Japanese, and Simplified Chinese
Network devices, bandwidth, servers, applications, virtual environments, remote systems, IoT, and more
Choose the PRTG Network Monitor subscription that's best for you
An IIS log monitoring and analysis tool collects, parses, and analyzes log files generated by IIS Web servers. These tools help IT teams track key metrics such as user activity, status codes, and server performance. With real-time monitoring and data visualization, they enable you to identify problems, optimize server performance, and improve security by reviewing logs for unusual patterns or potential threats.
PRTG simplifies IIS log monitoring by collecting data from your IIS web server logs and transforming it into actionable insights. It allows you to track key metrics such as response times, user agent data, and referer logs to monitor the performance and security of your web applications. Customizable dashboards and alerts make it easy to stay on top of any issues that may arise and ensure that your web server is running smoothly.
Yes, PRTG supports logs from different web servers, including Microsoft IIS, Apache, and NGINX. It centralizes log data across different operating systems and servers, providing a unified view of your entire web server environment. By using PRTG as a multi-purpose log analysis tool, you can manage logs from all your web servers and monitor them effectively within a single platform.
PRTG supports various log formats, including IIS logs, event logs, syslog and more. It can also handle formats such as CSV files, making it compatible with multiple data sources and systems. This flexibility ensures that you can monitor logs from different devices and applications, whether you're using Microsoft IIS, firewalls or other network infrastructure components.
Yes, you can integrate SQL databases to store, retrieve, and analyze large amounts of log data. This integration is especially useful for organizations that want to run custom queries or perform in-depth analysis of their IIS log data. The combination of SQL and monitoring capabilities helps you gain valuable insights from your logs and fine-tune server performance.
PRTG provides robust security monitoring by tracking IIS log data related to authentication and access control. It monitors failed login attempts, unauthorized access and potential security threats. By analyzing authentication logs such as user-agent data and referer logs, PRTG helps identify suspicious activity and alerts your team in real-time.
In PRTG, “sensors” are the basic monitoring elements. One sensor usually monitors one measured value in your network, for example the traffic of a switch port, the CPU load of a server, or the free space on a disk drive. On average, you need about 5-10 sensors per device or one sensor per switch port.
Paessler conducted trials in over 600 IT departments worldwide to tune its network monitoring software closer to the needs of sysadmins. The result of the survey: over 95% of the participants would recommend PRTG – or already have.

Paessler PRTG is used by companies of all sizes. Sysadmins love PRTG because it makes their job a whole lot easier.
Bandwidth, servers, virtual environments, websites, VoIP services – PRTG keeps an eye on your entire network.
Everyone has different monitoring needs. That’s why we let you try PRTG for free.