Custom alerts and data visualization let you quickly identify and prevent connection problems and downtimes.
APIs are the backbone of seamless communication between your systems. For organizations that rely on APIs, monitoring their performance is essential to avoid disruptions, ensure uptime, and deliver a seamless user experience. With Paessler PRTG, you can expect complete visibility into API performance, from tracking response times to proactive problem resolution.
PRTG generates detailed reports on API performance, helping you analyze trends and track performance metrics over time.
Set tailored notifications to be immediately informed of performance issues, response time delays, or API endpoint outages.
Visualize key API metrics like uptime, latency, and throughput in customizable, easy-to-read dashboards that provide instant insights.
PRTG supports integration with a wide range of third-party APIs and microservices, ensuring compatibility and flexibility for diverse environments.
Diagnose network issues by continuously tracking your API performance. Show latency, response time, and other key metrics in real time. Visualize monitoring data in clear graphs and dashboards to identify problems more easily. Gain the overview you need to troubleshoot API dependencies and performance issues.

Device tree view of the complete monitoring setup

Custom PRTG dashboard for keeping an eye on the entire IT infrastructure

Live traffic data graph in PRTG
“All-around winning
network monitor”
“The real beauty of PRTG is the endless possibilities it offers”
“PRTG Network Monitor
is very hard to beat”
Put some clear and concise content in here. Keep your reader in mind. What are they trying to do? What are they hoping to learn? Why are they reading this? Help them out and use the tone and voice of your organization.
The interface of PRTG allows you to set up and configure API monitoring with minimal effort. You can quickly create custom views, set thresholds, and track essential API metrics without needing advanced technical expertise. It’s designed to make monitoring easy for everyone, from IT experts to first-time users.
PRTG offers subscription plans that scale with your business needs, ensuring that you only pay for the features you need. Whether you're a small business or an enterprise, PRTG adapts to your growth, and with a free trial, you can explore its full potential before making a commitment.
With PRTG, you'll have access to exceptional customer support, ready to help you with any challenge. Whether you're troubleshooting API issues or learning to use advanced features, our support team is happy to help.
PRTG comes with more than 250 native sensor types for monitoring your entire on-premises, cloud, and hybrid cloud environment out of the box. Check out some examples below!
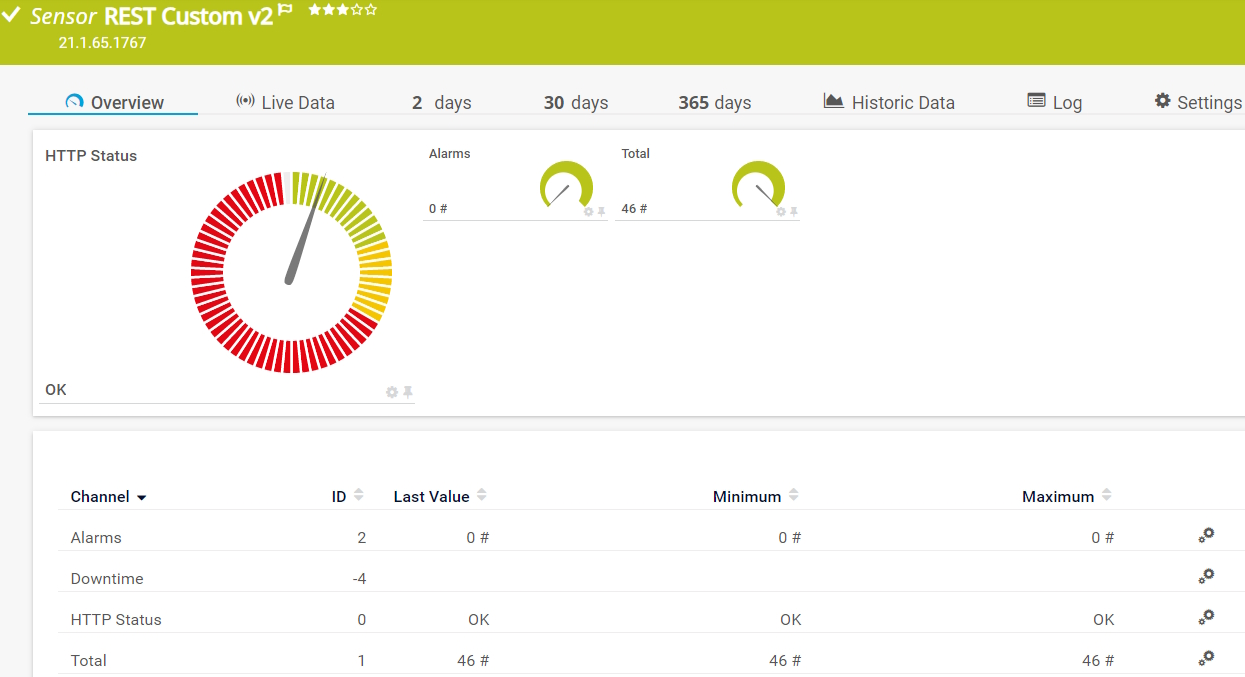
The REST Custom v2 sensor queries a REST API endpoint and maps the JSON or XML result to sensor values. It can show the following:
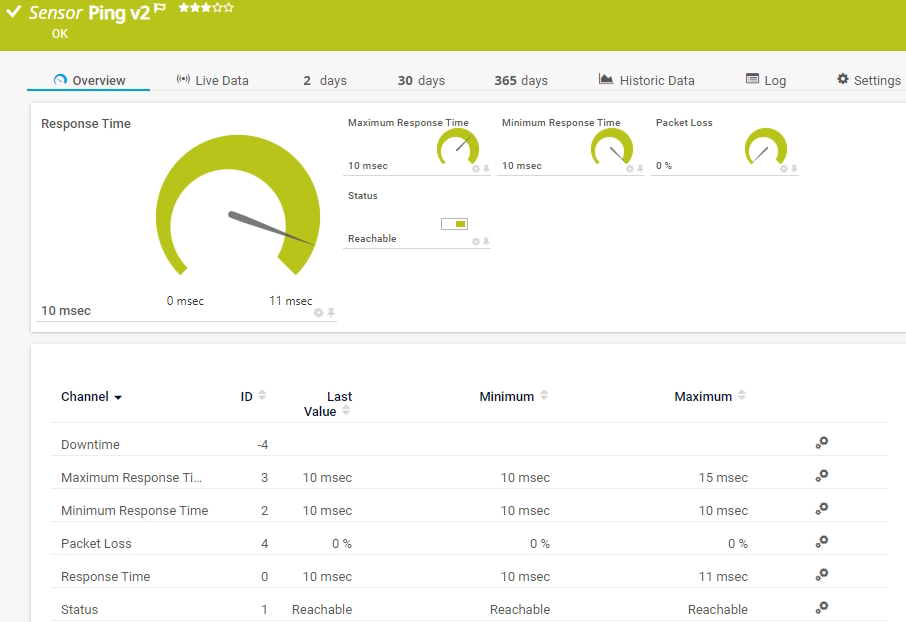
The Ping v2 sensor sends an Internet Control Message Protocol (ICMP) echo request ("ping") from the probe system to the parent device to monitor its availability. It can show the following:
• Response time
• Packet loss
• Target status
• Minimum and maximum ping time
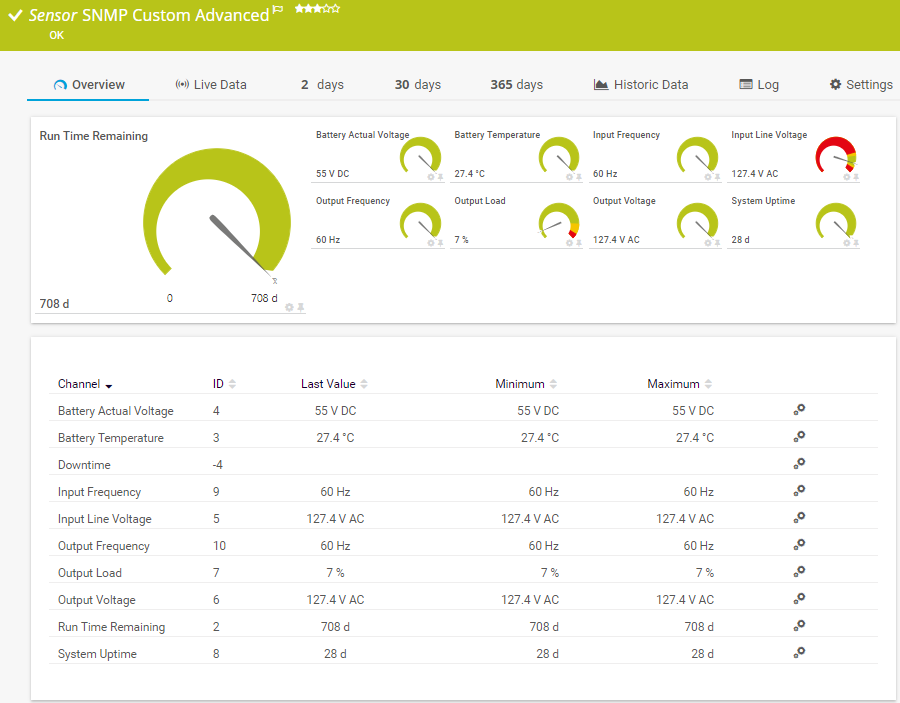
The SNMP Custom Advanced sensor monitors numeric values returned for object identifiers (OID). It can show the following:
See the PRTG Manual for a list of all available sensor types.

Custom alerts and data visualization let you quickly identify and prevent connection problems and downtimes.
PRTG is set up in a matter of minutes and can be used on a wide variety of mobile devices.

Partnering with innovative IT vendors, Paessler unleashes synergies to create
new and additional benefits for joined customers.
baramundi and PRTG create a secure, reliable and powerful IT infrastructure where you have everything under control - from the traffic in your firewall to the configuration of your clients.
Combining PRTG’s broad monitoring feature set with IP Fabric’s automated network assurance creates a new level of network visibility and reliability.
Siemon and Paessler bring together intelligent building technology and advanced monitoring and make your vision of intelligent buildings and data centers become reality.
Real-time notifications mean faster troubleshooting so that you can act before more serious issues occur.
Network Monitoring Software – Version 25.3.110.1313 (August 27, 2025)
Download for Windows and cloud-based version PRTG Hosted Monitor available
English, German, Spanish, French, Portuguese, Dutch, Russian, Japanese, and Simplified Chinese
Network devices, bandwidth, servers, applications, virtual environments, remote systems, IoT, and more
Choose the PRTG Network Monitor subscription that's best for you
An API monitoring tool tracks the performance and health of an application programming interface (API) to ensure it functions as expected. It monitors API endpoints, measures key metrics like response time and latency, and alerts you to any downtime or performance issues. API monitoring helps ensure uptime and reliability for users interacting with your applications and services.
Paessler PRTG monitors API performance by continuously tracking API calls, response times, and key metrics in real-time. It can monitor both internal and third-party APIs, helping you to identify issues such as slow response times or outages. PRTG provides custom notifications to alert you about performance problems, giving you the visibility needed to troubleshoot quickly. With powerful visualizations and easy configuration options, PRTG offers a comprehensive API monitoring solution for businesses of all sizes.
PRTG tracks essential API metrics such as latency, response time, API uptime, throughput, error rates, and API performance across various endpoints. It also supports integrations with third-party APIs and can track dependencies between services. By visualizing these metrics in customizable dashboards, PRTG gives you a detailed overview of API health and performance, helping you optimize workflows and resolve bottlenecks.
Yes, PRTG helps reduce API downtime by monitoring API availability in real time and sending immediate notifications when performance thresholds are breached. Its detailed performance monitoring ensures you can quickly detect and address API downtime, reducing the impact on end-user experience. You can also configure automated workflows to respond to certain types of outages or performance issues.
PRTG allows you to simulate API requests and responses, which helps to validate API functionality and performance under different conditions. It can test API endpoints and report back on their status, ensuring they meet service level agreements (SLAs). These synthetic monitoring capabilities enable proactive troubleshooting, allowing you to identify potential issues before they affect real users.
Paessler PRTG is a versatile monitoring solution that not only monitors APIs but also provides full visibility into your network, servers, and applications. It can monitor web services, DNS, microservices and backend infrastructure, offering seamless integration with other monitoring tools. Our monitoring solution offers scalability, flexibility, and a user-friendly interface, making it easy to configure for both API as well as network monitoring, ensuring comprehensive observability and real-time insights across your entire digital environment. Additionally, PRTG supports integrations with open-source tools, making it adaptable to different use cases, including DevOps and multi-cloud setups like AWS.
In PRTG, “sensors” are the basic monitoring elements. One sensor usually monitors one measured value in your network, for example the traffic of a switch port, the CPU load of a server, or the free space on a disk drive. On average, you need about 5-10 sensors per device or one sensor per switch port.
Paessler conducted trials in over 600 IT departments worldwide to tune its network monitoring software closer to the needs of sysadmins. The result of the survey: over 95% of the participants would recommend PRTG – or already have.

Paessler PRTG is used by companies of all sizes. Sysadmins love PRTG because it makes their job a whole lot easier.
Bandwidth, servers, virtual environments, websites, VoIP services – PRTG keeps an eye on your entire network.
Everyone has different monitoring needs. That’s why we let you try PRTG for free.