Custom alerts and data visualization let you quickly identify and prevent virtual desktop performance issues.
Are you struggling to maintain visibility across your VMware Horizon deployment? With PRTG, you gain complete insight into your virtual desktop infrastructure, from connection servers to end-user experience. You can identify and resolve issues before users even notice them.
PRTG offers ready-to-use sensors specifically designed for VMware Horizon monitoring. You can start monitoring connection servers, desktop pools, and virtual machines within minutes of installation. These sensors collect all critical metrics without requiring complex configuration or scripting.
Create personalized dashboards that display exactly the VMware Horizon metrics you need. You can arrange multiple monitoring elements on a single screen for at-a-glance visibility. These dashboards help you quickly identify patterns and troubleshoot issues across your entire VDI environment.
Set custom thresholds for all your VMware Horizon components to receive immediate notifications. You can define warning and critical levels based on your specific requirements and SLAs. These alerts ensure you know about potential problems before they impact your users.
Monitor your entire IT infrastructure, including VMware Horizon, from a single pane of glass. You can track physical servers, network devices, and virtual components simultaneously without switching tools. This unified approach simplifies troubleshooting and reduces mean time to resolution.
Diagnose network issues by continuously tracking Horizon deployment health, virtual desktop performance and endpoint resource utilization. Show virtual desktop response times, active sessions and other key metrics in real time. Visualize monitoring data in clear graphs and dashboards to identify problems more easily. Gain the overview you need to troubleshoot virtual machine bottlenecks and remote desktop connectivity issues.

Device tree view of the complete monitoring setup

Custom PRTG dashboard for keeping an eye on the entire IT infrastructure

Live traffic data graph in PRTG
“All-around winning
network monitor”
“The real beauty of PRTG is the endless possibilities it offers”
“PRTG Network Monitor
is very hard to beat”
Managing a VMware Horizon environment can quickly become overwhelming. When users complain about slow virtual desktops, you're left scrambling to figure out if it's a connection server issue, network bottleneck, or resource constraint. Without proper monitoring, troubleshooting becomes a frustrating guessing game that wastes your time and tests your users' patience.
Choose the licensing model that perfectly fits your VMware Horizon deployment size. You can start small and easily scale up as your VDI environment grows without complicated procurement processes. Adjust your subscription at any time to match your changing monitoring needs.
Access your VMware Horizon monitoring data from any device, whether you're at your desk or on the move. Use the PRTG desktop client, web interface, or mobile apps to check the status of your VDI environment anytime, anywhere. Respond to alerts immediately, even when you're away from the office.
Receive expert assistance whenever you encounter challenges with your VMware Horizon monitoring setup. Our technical support team responds quickly to your questions with clear, actionable solutions. Benefit from comprehensive documentation, video tutorials, and a knowledgeable community to help you maximize your monitoring potential.
Simplify the initial setup of your VMware Horizon monitoring with PRTG's auto-discovery feature. Let the system automatically detect your connection servers, desktop pools, and virtual machines without manual configuration. Save hours of setup time and ensure no critical components are overlooked in your monitoring strategy.
PRTG comes with more than 250 native sensor types for monitoring your entire on-premises, cloud, and hybrid cloud environment out of the box. Check out some examples below!
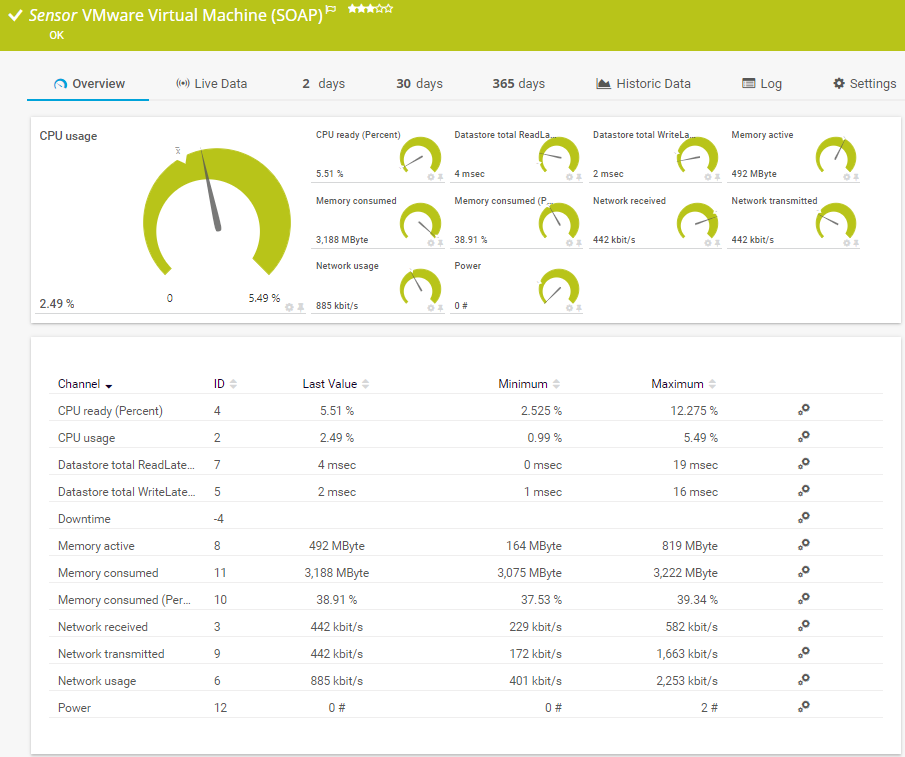
The VMware Virtual Machine (SOAP) sensor monitors a virtual machine (VM) on a VMware host server using the Simple Object Access Protocol (SOAP). It can show the following and more:
CPU readiness and usage
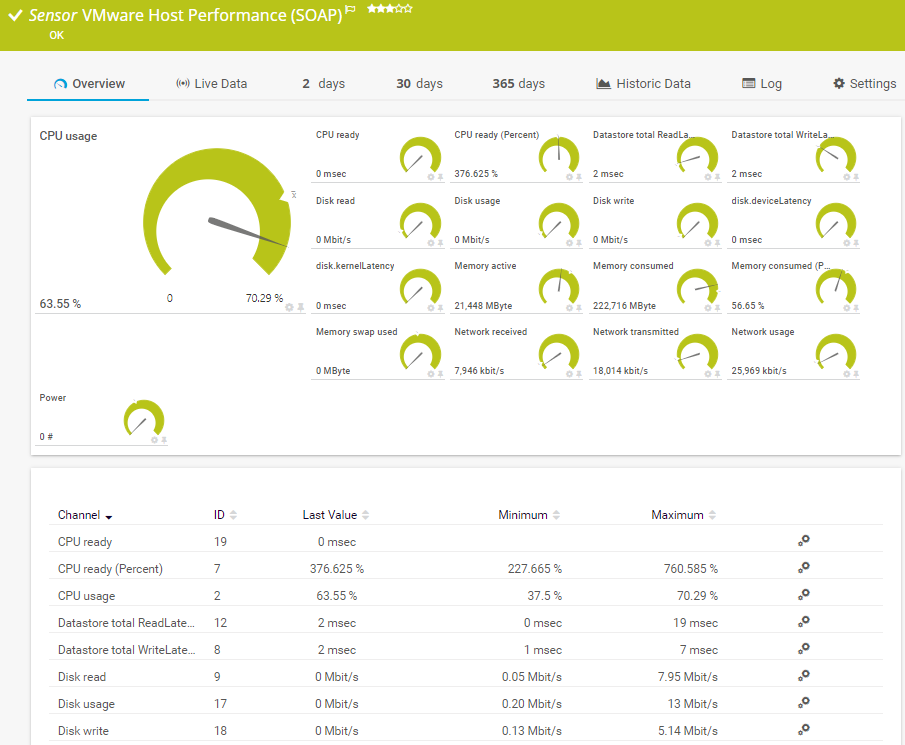
The VMware Host Performance (SOAP) sensor monitors a VMware host server using the Simple Object Access Protocol (SOAP). It can show the following and more:
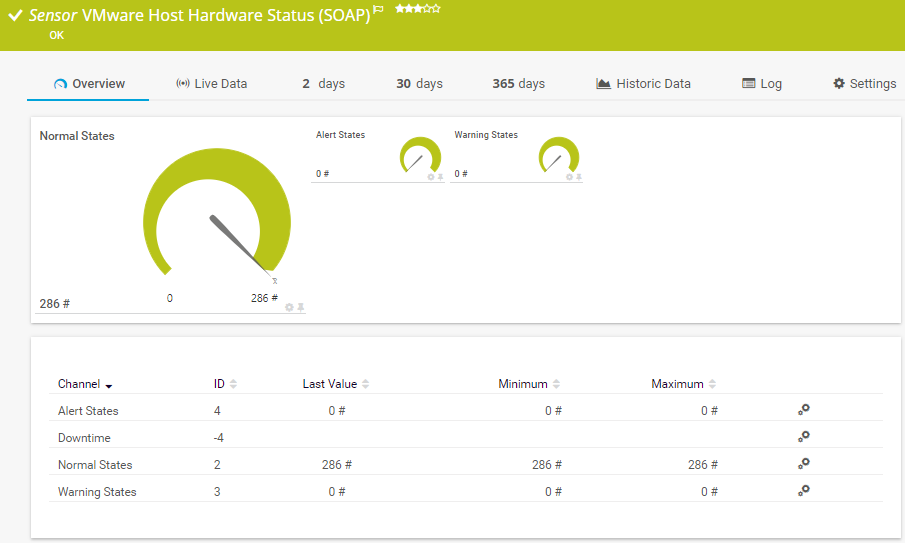
The VMware Host Hardware Status (SOAP) sensor monitors the hardware status of a VMware host server using the Simple Object Access Protocol (SOAP). It gives you a general status overview of the host. It can show the following:
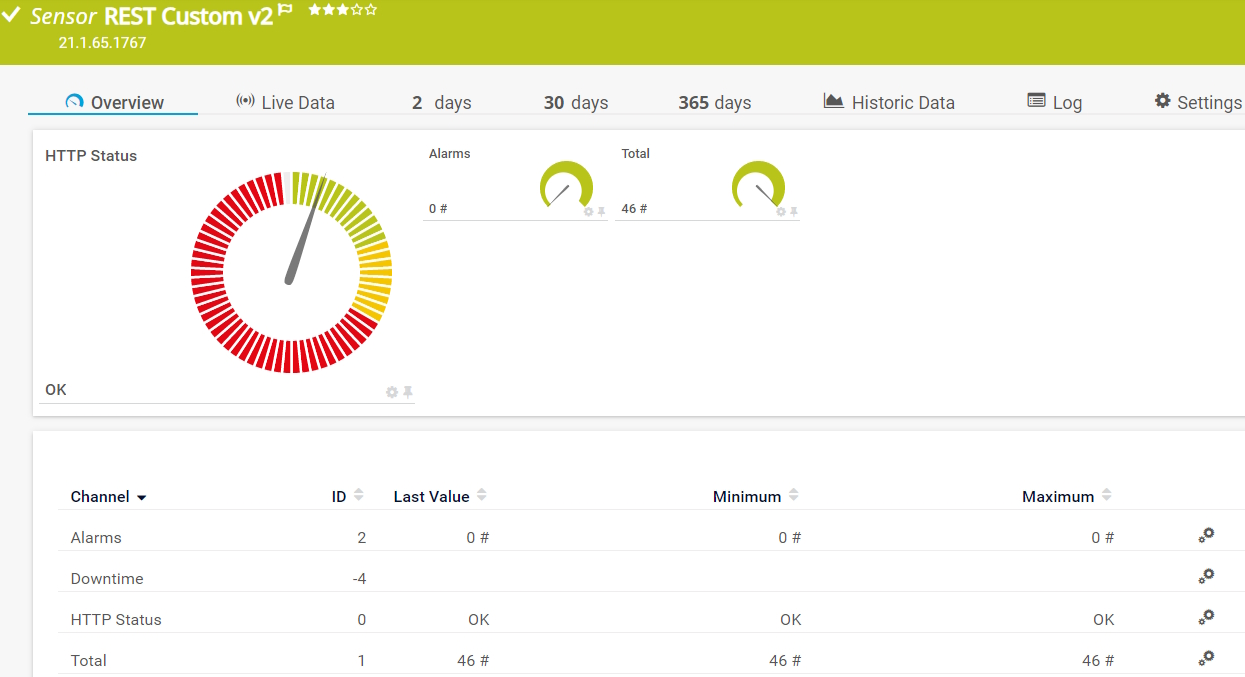
The REST Custom v2 sensor queries a REST API endpoint and maps the JSON or XML result to sensor values. It can show the following:
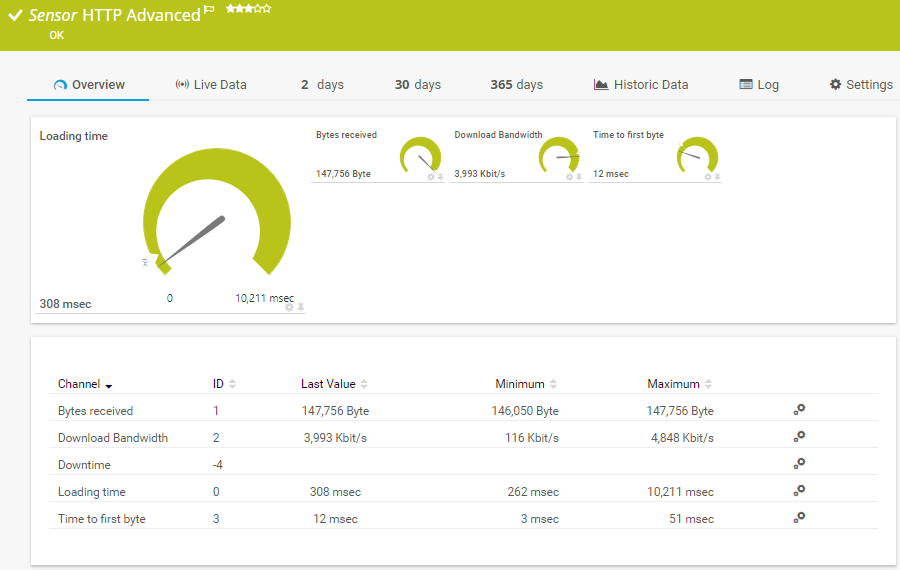
The HTTP Advanced sensor monitors the source code of a web page using HTTP. It supports authentication, content checks, and other advanced parameters. It can show the following:
See the PRTG Manual for a list of all available sensor types.

Custom alerts and data visualization let you quickly identify and prevent end-user experience degradation.
PRTG is set up in a matter of minutes and can be used on a wide variety of mobile devices.


“Excellent tool for detailed monitoring. Alarms and notifications work greatly. Equipment addition is straight forward and server initial setup is very easy. ...feel safe to purchase it if you intend to monitor a large networking landscape.”
Partnering with innovative IT vendors, Paessler unleashes synergies to create
new and additional benefits for joined customers.
By integrating PRTG with Martello iQ, you can add a fast analytics layer to improve uptime, visualize your IT environment, and integrate all of your IT systems into a single pane of glass.
Siemon and Paessler bring together intelligent building technology and advanced monitoring and make your vision of intelligent buildings and data centers become reality.
With ScriptRunner Paessler integrates a powerful event automation platform into PRTG Network Monitor.
Real-time notifications mean faster troubleshooting so that you can act before more serious issues occur.
Network Monitoring Software – Version 25.3.110.1313 (August 27, 2025)
Download for Windows and cloud-based version PRTG Hosted Monitor available
English, German, Spanish, French, Portuguese, Dutch, Russian, Japanese, and Simplified Chinese
Network devices, bandwidth, servers, applications, virtual environments, remote systems, IoT, and more
Choose the PRTG Network Monitor subscription that's best for you
A VMware Horizon monitoring tool is specialized software that tracks the performance, availability, and health of your VMware Horizon VDI environment. It monitors connection servers, desktop pools, virtual desktops, and user sessions to ensure optimal performance. PRTG offers comprehensive monitoring capabilities for VMware Horizon view deployments, allowing you to track metrics like active sessions, resource utilization, and logon times through a centralized dashboard.
PRTG monitors horizon connection servers by tracking key performance metrics including CPU usage, memory consumption, and network traffic. You can set up alerts for when connection servers experience high load or become unresponsive. PRTG also monitors the communication between connection servers and other components like Active Directory, vCenter, and ESX hosts. This comprehensive monitoring helps prevent authentication issues and ensures users can connect to their virtual desktops without interruption.
Yes, PRTG can monitor both PCoIP protocol performance and RDS hosts in VMware Horizon deployments. For PCoIP, PRTG tracks metrics like bandwidth usage, latency, and packet loss to ensure optimal remote display protocol performance. For RDS (Remote Desktop Services) hosts, PRTG monitors server health, session counts, and resource utilization. This monitoring capability helps identify performance bottlenecks in the display protocol or RDS infrastructure that might affect user experience.
PRTG provides detailed insights into horizon user sessions by tracking metrics such as logon duration, session length, and resource consumption. You can monitor the number of active users per desktop pool and identify users experiencing performance issues. PRTG also allows help desk teams to correlate user complaints with actual system performance data, making troubleshooting more efficient. This user-centric monitoring approach helps maintain high satisfaction levels among VDI users.
Yes, PRTG complements vRealize operations by providing additional monitoring perspectives. While vRealize Operations offers deep VMware-specific analytics, PRTG provides broader infrastructure monitoring including network devices, storage systems, and non-VMware components. PRTG can consume data from vRealize through API connections, allowing you to create a unified monitoring solution. This integration helps operations managers maintain visibility across multi-cloud environments that include both VMware and non-VMware resources.
PRTG offers comprehensive vSphere monitoring capabilities that track the health and performance of ESX hosts, vCenter servers, and virtual machines running Horizon components. It monitors CPU, memory, disk, and network metrics for all infrastructure components. PRTG also tracks datastore performance and capacity, which is crucial for VDI environments. By monitoring the entire vSphere stack, PRTG helps identify whether Horizon performance issues stem from the underlying virtualization layer or the Horizon components themselves.
Yes, PRTG can collect and analyze event logs from Windows-based Horizon components and syslog data from Linux-based components in your VDI environment. It can monitor the event database for critical errors and warnings, allowing for automated alerts when issues occur. PRTG supports monitoring of app volumes, Oracle databases, and other components that generate logs within the Horizon ecosystem. This centralized log monitoring function helps identify the root cause of issues by correlating events across multiple systems using their IP address identifiers.
In PRTG, “sensors” are the basic monitoring elements. One sensor usually monitors one measured value in your network, for example the traffic of a switch port, the CPU load of a server, or the free space on a disk drive. On average, you need about 5-10 sensors per device or one sensor per switch port.
Paessler conducted trials in over 600 IT departments worldwide to tune its network monitoring software closer to the needs of sysadmins. The result of the survey: over 95% of the participants would recommend PRTG – or already have.

Paessler PRTG is used by companies of all sizes. Sysadmins love PRTG because it makes their job a whole lot easier.
Bandwidth, servers, virtual environments, websites, VoIP services – PRTG keeps an eye on your entire network.
Everyone has different monitoring needs. That’s why we let you try PRTG for free.