• Company
    • About Us
    • Case Studies
    • Press Center
    • Events
    • Careers
    • Blog
    • Contact us
  • Contact us
  • Login
 
  • English
    • Deutsch
    • Español
    • Français
    • Italiano
    • Português
Paessler
                    - The Monitoring Experts
  • Products
    • Paessler PRTG
      Paessler PRTGMonitor your whole IT infrastructure
      • PRTG Network Monitor
      • PRTG Enterprise Monitor
      • PRTG Hosted Monitor
      • PRTG extensionsExtensions for Paessler PRTGExtend your monitoring to a new level
    • Icon Features
      FeaturesExplore all monitoring features
      • Maps & dashboards
      • Alerts & notifications
      • Multiple user interfaces
      • Distributed monitoring
      • Customizable reporting
  • Solutions
    • Industries
      IndustriesMonitor various industry sectors
      • Industrial
      • Healthcare
      • Data Center
      • Education
      • Finance
      • Government
    • IT Topics
      IT TopicsMonitor all areas of IT
      • Network Monitoring
      • Bandwidth Monitoring
      • SNMP Monitor
      • Network Mapping
      • WiFi Monitoring
      • Server Monitoring
  • Pricing
  • Resources
    • Getting Started
      Getting StartedModules for self-paced learning
    • How-to Guides
      How-to GuidesGet the most out of PRTG
    • Videos & Webinars
      Videos & WebinarsLearn from Paessler experts
    • IT  Knowledge
      IT KnowledgeExpand your IT knowledge
    • PRTG Manual
      PRTG ManualFull documentation
    • Knowledge Base
      Knowledge BaseShare community knowledge
    • PRTG Sensor Hub
      PRTG Sensor HubGet sensors, scripts & templates
    • Trainings
      PRTG TrainingLearn how to work with PRTG
  • Partners
    • icon star
      New Partners and MSPBecome a new partner or MSP
    • icon partner
      Partner PortalLog in to your partner account
    • icon search
      Find a PartnerFind partners selling Paessler products
    • icon technology
      Technology AlliancesSee Paessler technology partnerships
  • Company
    • About Us
    • Case Studies
    • Press Center
    • Events
    • Careers
    • Blog
    • Contact us
  • Contact us
  • Login
  • English
    • Deutsch
    • Español
    • Français
    • Italiano
    • Português
  • Get a quote
  • Free trial
  1. Home>
  2. IT Topics>
  3. Cloud>
  4. RDS Monitoring
PRTG Logo

RDS Monitoring with PRTG

Get real-time performance insights into your AWS Cloud environment

  • Monitor AWS RDS and other Amazon Web Services centrally
  • Use comprehensive alerting features for fast incident response
  • Have your AWS cost data at hand for better financial insight 
Free download
product overview

Our users give top ratings for monitoring with Paessler PRTG

Gartner peer insights
spiceworks
Capterra
G2
Trustpilot

PRTG RDS monitoring: What you will find on this page

Table of content
  • Keep a watchful eye on AWS RDS and your entire IT infrastructure
  • What AWS RDS monitoring looks like in PRTG
  • 5 reasons why PRTG is the RDS monitoring tool of your choice
  • Explore our preconfigured PRTG sensors for RDS monitoring
  • RDS Monitoring: FAQ

PRTG makes AWS RDS monitoring as easy as it gets

Custom alerts and data visualization let you quickly identify and prevent issues with your Amazon Relational Database Service.

Free download
PRODUCT OVERVIEW

Keep a watchful eye on AWS RDS and your entire IT infrastructure

One of the biggest pitfalls of Amazon’s RDS monitoring is that most environments include multiple vendor products. While CloudWatch and Enhanced Monitoring have their bonuses for monitoring Amazon relational databases, they aren’t so good at monitoring that Cisco server you have. With extensive multi-vendor support, Paessler PRTG is your one-stop shop for Amazon RDS performance monitoring.

Consolidate your dashboards

Amazon’s RDS monitoring only covers Amazon products, which means other vendor products – and their associated dashboards – are needed to extend coverage.

PRTG monitoring seamlessly integrates with your entire on-premises, cloud, and hybrid environment for a single, unified experience. Think of it: one dashboard for all your network monitoring needs. You’re welcome.

Stay calm and monitor 24/7/365

Constantly monitoring your IT infrastructure can be time-consuming and monotonous. PRTG stays on task with around-the-clock monitoring of your AWS RDS instances.

Automated alerts help you monitor the pulse of your network performance without requiring manual oversight. With 24/7 monitoring and comprehensive coverage, you can stay calm, knowing PRTG will inform you of any issues.

Extend data insight with better metrics

AWS monitoring tools provide basic metrics, but may not cover all the parameters your network needs. PRTG provides comprehensive coverage with an extensive sensor library.

Over 250 sensors allow you to monitor most network components, giving you detailed insight on a variety of key values. For example, the AWS RDS v2 sensor monitors values such as CPU credits, memory usage, database statistics, and network utilization.

Monitor other Amazon Cloud instances

In addition to Amazon RDS, use PRTG to monitor other Amazon Cloud services. These services include Amazon Elastic Cloud Computing (AWS EC2), Amazon Elastic Block Store (AWS EBS), Amazon Elastic Load Balancing (AWS ELB), and many more.

You’ll only need one tool to monitor your entire Amazon Cloud infrastructure, as well as all the other services and devices in your IT landscape.

Get real-time alerts and notifications

While native AWS monitoring tools provide basic alerting capabilities, these are often not flexible enough.

Our AWS RDS monitoring software allows highly customizable alerts based on the thresholds and conditions you define. Alerts can be sent to key people through various channels, including email, SMS, push notification, and more.

What AWS RDS monitoring looks like in PRTG

Diagnose network issues by continuously tracking the availability and performance of your AWS Relational Database Services. Show CPU usage and credit balance, database connections, storage space, network traffic, and other key metrics in real time. Visualize monitoring data in clear graphs and dashboards to identify problems more easily. Gain the overview you need to troubleshoot your Amazon Cloud database performance issues.

prtg-screenshot-map-aws-linux-windows-services

Map for AWS Linux Windows services in PRTG

PRTG Screenshot device tree view

Device tree view of the complete monitoring setup

PRTG screenshot map entire it infrastructure

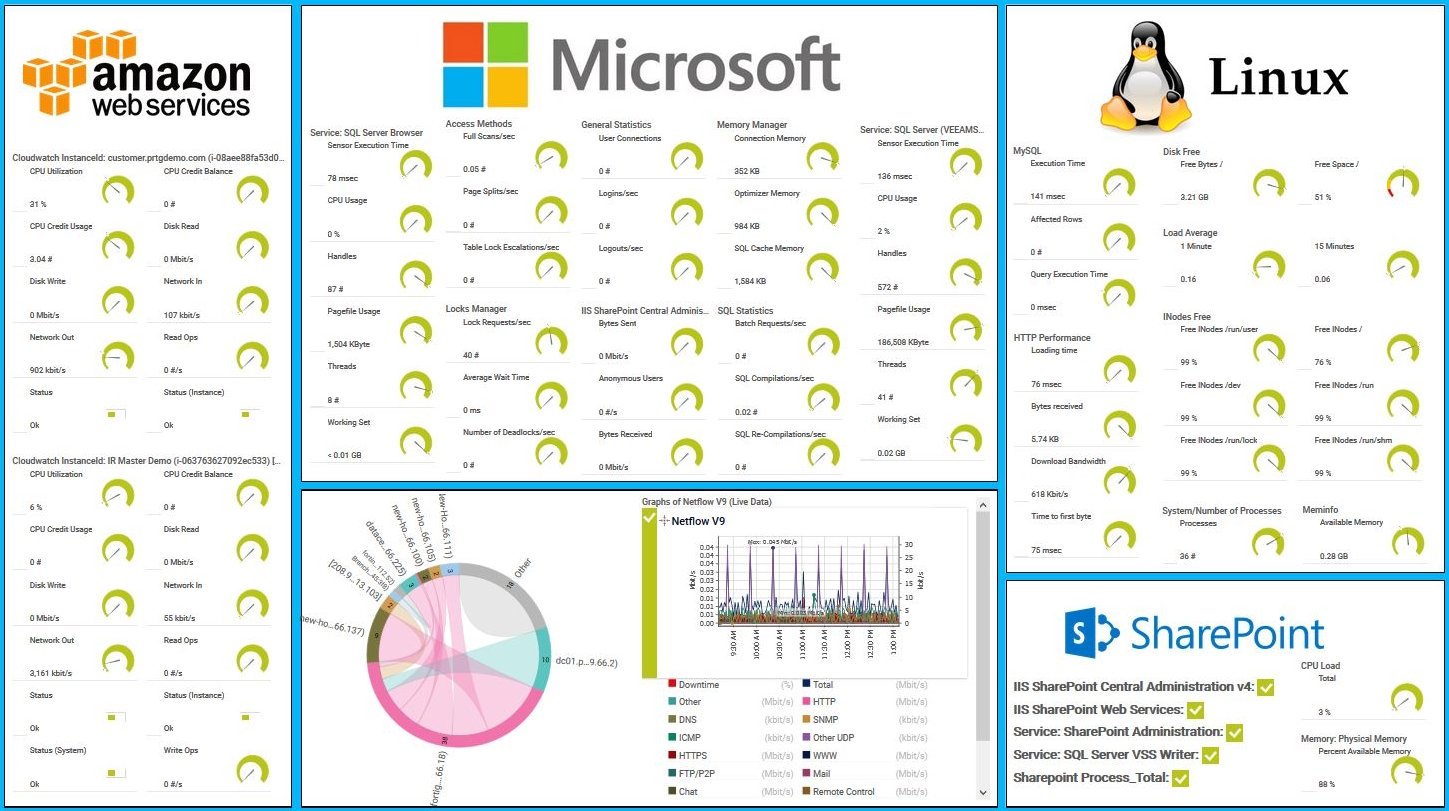
Custom PRTG dashboard for keeping an eye on the entire IT infrastructure

PRTG screenshot graph live data traffic

Live traffic data graph in PRTG

Start monitoring your RDS with PRTG and see how it can make your network more reliable and your job easier.

Free download
PRODUCT OVERVIEW

IT experts agree: Paessler PRTG is a great solution for IT infrastructure monitoring

PCMag

“All-around winning
 network monitor”

IT Brief

“The real beauty of PRTG is the endless possibilities it offers”

ITPro

“PRTG Network Monitor 
is very hard to beat”

5 reasons why PRTG is the RDS monitoring tool of your choice

We play well with others

Whether you have Amazon, Microsoft, Cisco, or a Frankenstein mix of vendor components, PRTG came to play.

PRTG integrates with multiple vendors and monitors all network devices and other endpoints you can think of, ensuring comprehensive network management across hybrid environments.

We are flexible and scale easily

Maybe we don’t do yoga, but PRTG network monitoring software is very flexible. 

Outgrowing your current monitoring solution? PRTG easily scales with your infrastructure and meets the needs of both small businesses and large enterprises. Licensing is based on the number of sensors, so you’ll get the monitoring solution that fits your budget.

Look into the past and the future

To properly manage your RDS database instances, you need historical data and predictive analytics.

PRTG provides detailed reports on AWS RDS performance, which helps you analyze trends accurately and plan future capacity. Historical data lets you identify patterns and predict potential issues before they become critical.

You believe in being proactive

PRTG provides real-time insights into AWS RDS performance. This way, you can always identify and resolve issues proactively, even before your phone starts ringing off the hook.

This proactive approach prevents issues before they impact your operations and ensures the performance of your database environments

You like to uncomplicate things

PRTG is well known for its user-friendly, intuitive interface. It’s easy for IT teams to set up, configure, and manage monitoring – no extensive training is needed.

With preconfigured sensors, you can quickly start monitoring your RDS DB instances. Custom maps allow you to visualize your entire infrastructure and easily understand how each component is related.

Explore our preconfigured PRTG sensors for RDS monitoring

PRTG comes with more than 250 native sensor types for monitoring your entire on-premises, cloud, and hybrid cloud environment out of the box. Check out some examples below!

AWS RDS v2

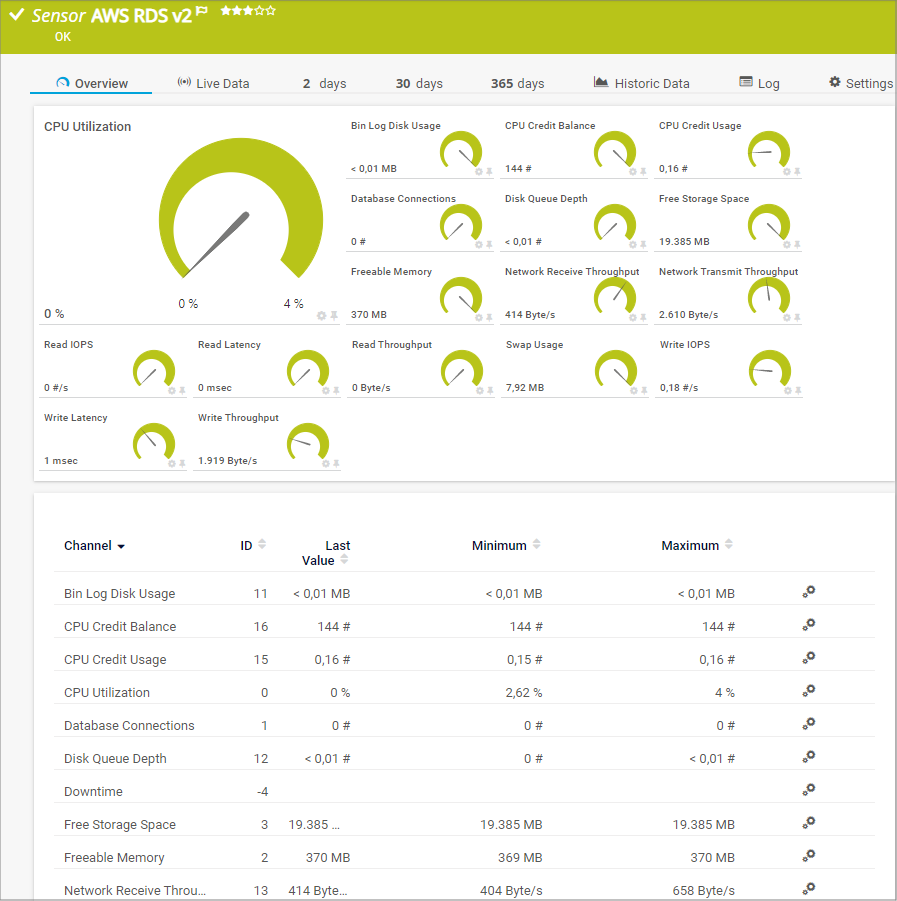
The AWS RDS v2 sensor monitors the performance of a Amazon Web Services (AWS) Relational Database Service (RDS) database by reading its data from Amazon CloudWatch via the AWS API. It can show the following and more:

  • CPU credit balance and usage
  • Average number of database connections in use
  • Number of (outstanding) disk read and write operations
  • Amount of available storage space
  • Incoming (receive) and outgoing (transmit) network traffic
AWS RDS v2
AWS RDS v2

AWS Alarm v2

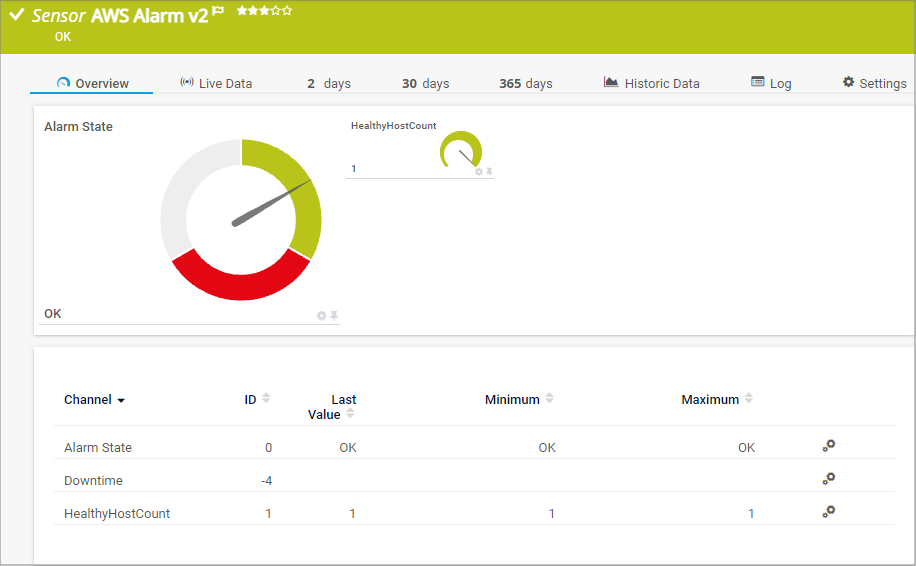
The AWS Alarm v2 sensor monitors the status of an Amazon Web Services (AWS) alarm by reading its data from Amazon CloudWatch via the AWS API. It can show the following:

  • Alarm status
  • Metric on which the alarm is based
AWS Alarm v2
AWS Alarm v2

AWS Cost

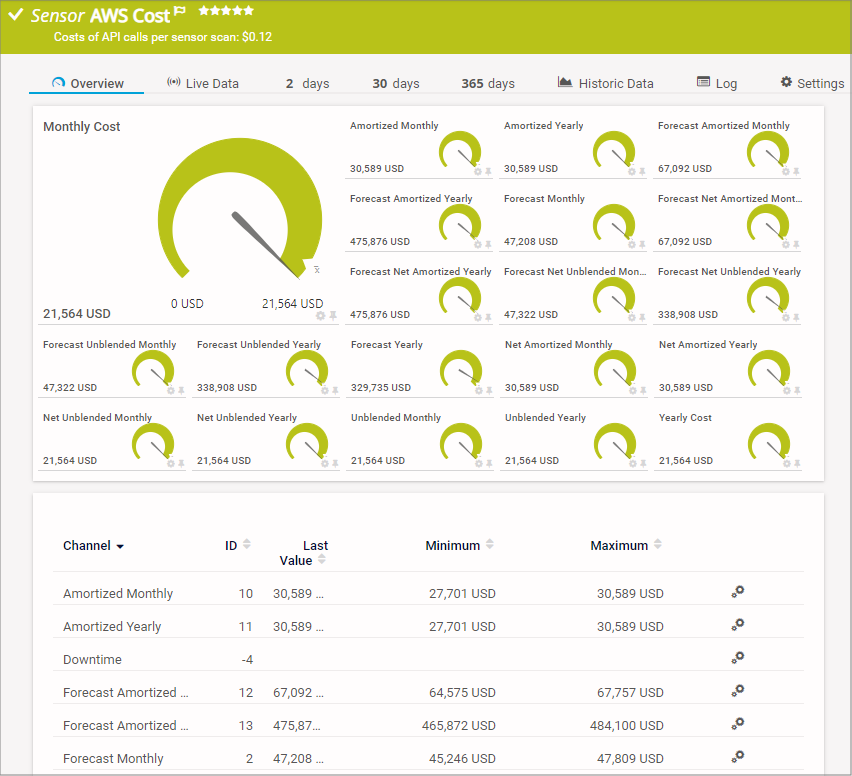
The AWS Cost sensor monitors the cost of an Amazon Web Services (AWS) account by reading its data from the AWS Cost Explorer API. It can show the following:

  • (Forecast for) amortized cost per month and year
  • (Forecast for) net amortized cost per month and year
  • (Forecast for) net unblended cost per month and year
  • (Forecast for) unblended cost per month and year
  • (Forecast for) monthly and yearly cost
AWS Cost
AWS Cost

AWS EBS v2

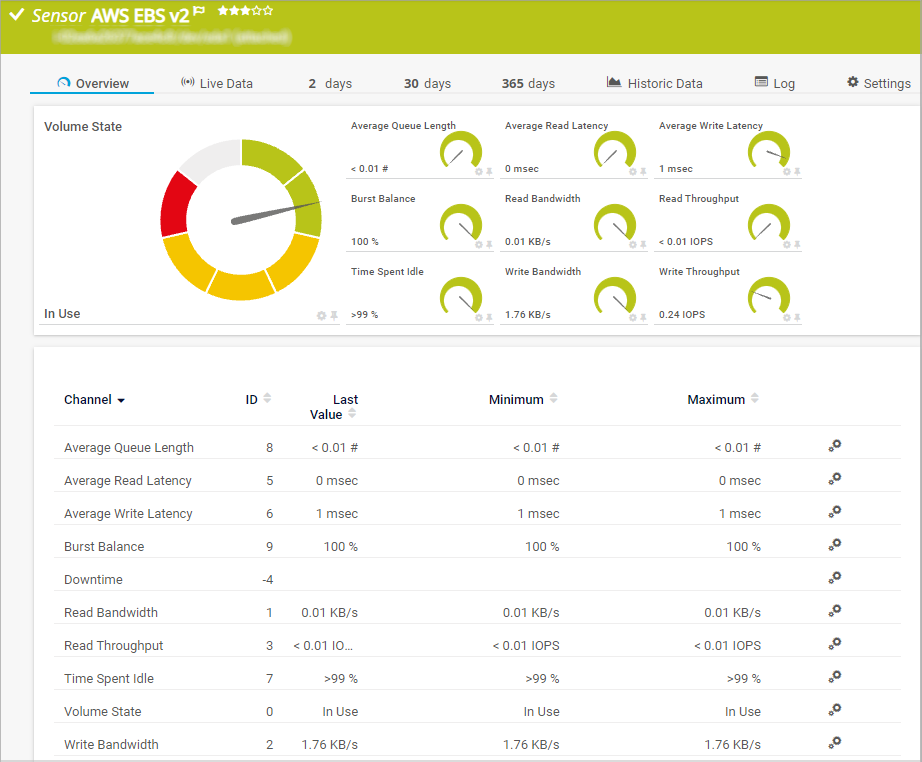
The AWS EBS v2 sensor monitors the performance of an Amazon Web Services (AWS) Elastic Block Store (EBS) volume by reading its data from Amazon CloudWatch via the AWS API. It can show the following:

  • Average queue lengths
  • Average read and write latency
  • Time spent idle
  • Burst balance
  • Read and write bandwidth and throughput in IOPS
AWS EBS v2
AWS EBS v2

See the PRTG Manual for a list of all available sensor types.

Find the root cause of the problem with our PRTG RDS monitoring solution

Real-time notifications mean faster troubleshooting so that you can act before more serious issues occur.

Free download
PRODUCT OVERVIEW

PRTG is compatible with all major vendors, products, and systems

compatible with all major vendors, products, and systems

PRTG makes AWS RDS monitoring as easy as it gets

Custom alerts and data visualization let you quickly identify and prevent issues with your Amazon Relational Database Service.

Free download
PRODUCT OVERVIEW

“With PRTG, we can comprehensively monitor our email services in the cloud, and ensure that – as the team in charge – we are immediately informed in the event of a malfunction and can quickly take actions to fix it. It wasn’t until we started using PRTG that we realized how error-ridden our Microsoft cloud service can be.”

Monitoring expert
Oettinger Davidoff

“Part of our infrastructure runs with Azure. This information is then sent to PRTG via Powershell. Paessler is a great solution for us. We get alerts sent directly to our phones and if something goes wrong somewhere, we can immediately deal with it. It’s our lifeline. This is why Paessler gives us a sense of security no matter what the time of day.”

Gert-Jan Hiddink, DevOps Engineer
CowManager

“As more and more companies start to integrate new systems, they aren’t going to use legacy networks. Instead, clients are implementing more cloud-based solutions with newer programming languages. Being able to closely monitor cloud-based solutions and customize sensors based on clients’ needs is extremely helpful in making sure the process runs and continues to function as smoothly as possible.”

Edgard Concha, Director of Information Systems
Resolvit

Your RDS monitor at a glance – even on the go

PRTG is set up in a matter of minutes and can be used on a wide variety of mobile devices.

device overview
aws

We are an AWS Technology Partner  

Paessler is a certified partner in the Amazon Web Services ecosystem, which includes a growing community of software vendors who are building solutions on cloud computing.

What does this mean for you?

  • Easy integration of AWS services and CloudWatch data with PRTG
  • State-of-the-art features for monitoring your cloud environment
  • Expert technical support around your AWS monitoring setup

Create innovative solutions with Paessler’s IT partners

Partnering with innovative IT vendors, Paessler unleashes synergies to create
new and additional benefits for joined customers.

IP Fabric

IP Fabric

Combining PRTG’s broad monitoring feature set with IP Fabric’s automated network assurance creates a new level of network visibility and reliability.

Read more
Plixer

Plixer

Paessler and Plixer provide a complete solution adding flow and metadata analysis to a powerful network monitoring tool.

Read more
ScriptRunner

ScriptRunner

With ScriptRunner Paessler integrates a powerful event automation platform into PRTG Network Monitor.

Read more

Find the root cause of the problem with our PRTG RDS monitoring solution

Real-time notifications mean faster troubleshooting so that you can act before more serious issues occur.

Free download
PRODUCT OVERVIEW
Paessler PRTG

Paessler PRTG

Network Monitoring Software – Version 25.2.106.1114 (May 05th, 2025)

Hosting icon

Hosting

Download for Windows and cloud-based version PRTG Hosted Monitor available

Languages icon

Languages

English, German, Spanish, French, Portuguese, Dutch, Russian, Japanese, and Simplified Chinese

test

Monitor everything

Network devices, bandwidth, servers, applications, virtual environments, remote systems, IoT, and more

test

Pricing

Choose the PRTG Network Monitor subscription that's best for you

Discover more monitoring insights and stories

Resources Solution

Solutions for all your monitoring needs

  • Amazon Web Services Monitoring
  • The monitoring solution for all areas of IT!
  • Cloud monitoring
Resources Content

Powerful stories from the monitoring world

  • PRTG 21.3.71 with new IoT, AWS and Redfish sensors
  • Monitoring your AWS environment with PRTG - Part 1/2
  • PRTG version 22.3.78 is now available in the stable release channel
Resources Solutions

Resources to master your monitoring challenges

  • AWS RDS v2 Sensor
  • RDS Licsensing
  • How can i monitor if the connections to and RDS servers are allowd or denied?

RDS Monitoring: FAQ


What is AWS RDS?

AWS RDS (Amazon Relational Database Service) is a managed cloud service that makes it easy to set up, operate, and scale relational databases in the cloud. It automates many of the time-consuming administrative tasks associated with database management, such as provisioning hardware, setting up databases, patching software, and performing backups.

AWS RDS supports several popular database engines, including Amazon Aurora (compatible with MySQL and PostgreSQL), MySQL, MariaDB, PostgreSQL, Oracle, and Microsoft SQL Server.

What is AWS RDS monitoring?

AWS RDS monitoring involves tracking and managing the performance, health, and usage metrics of database instances hosted on Amazon Relational Database Service.

PRTG keeps a constant eye on the performance of Amazon cloud databases so you can make sure you’re getting what you paid for – and your users benefit from the level of service they need.

Why is RDS monitoring important?

The performance of your cloud databases directly affects user experience. This is especially important for online retailers, which need to be available at all times. Slow database responses can lead to a poor user experience, causing frustration and potentially driving users away. Downtime can result in lost sales and a damaged reputation.

PRTG AWS RDS monitoring ensures business continuity with proactive issue detection, continuous monitoring, and real-time alerts.

What metrics should I monitor for AWS RDS?

Key performance metrics include CPU utilization, memory usage, disk I/O, database connections, free storage space, disk read/write operations, and network throughput. Monitoring these metrics helps in identifying performance bottlenecks and resource usage patterns.

How does PRTG integrate with AWS RDS?

PRTG integrates with RDS and other AWS services (ELB, EC2, EBS) by using preconfigured sensors that monitor various CloudWatch metrics. It pulls data via the Amazon CloudWatch API and provides enhanced monitoring capabilities, including customizable alerts and in-depth visualizations. For monitoring AWS RDS instances, you need an AWS account.

Does PRTG provide other database monitoring functionality?

Sure. With PRTG, you can monitor your Microsoft SQL Server, Oracle SQL, MySQL, PostgreSQL, and other RDBMS right out of the box. For monitoring and analyzing relational databases such as SAP HANA, SAP MaxDB, IBM DB2, or IBM Informix, you need the PRTG Database Observer extension.

What is a sensor in PRTG?

In PRTG, “sensors” are the basic monitoring elements. One sensor usually monitors one measured value in your network, for example the traffic of a switch port, the CPU load of a server, or the free space on a disk drive. On average, you need about 5-10 sensors per device or one sensor per switch port.

We asked: would you recommend PRTG? Over 95% of our customers say yes!

Paessler conducted trials in over 600 IT departments worldwide to tune its network monitoring software closer to the needs of sysadmins. The result of the survey: over 95% of the participants would recommend PRTG – or already have.

recommendation

Still not convinced?

Love

More than 500,000 sysadmins love PRTG

Paessler PRTG is used by companies of all sizes. Sysadmins love PRTG because it makes their job a whole lot easier.

PRTG

Monitor your entire IT infrastructure

Bandwidth, servers, virtual environments, websites, VoIP services – PRTG keeps an eye on your entire network.

test

Try Paessler PRTG for free

Everyone has different monitoring needs. That’s why we let you try PRTG for free.

PRTG Logo

Start monitoring your RDS monitoring with PRTG and see how it can make your network more reliable and your job easier.

Free download
PRODUCT OVERVIEW

Products

  • Paessler PRTG
    Paessler PRTGMonitor your whole IT infrastructure
    • PRTG Network Monitor
    • PRTG Enterprise Monitor
    • PRTG Hosted Monitor
  • PRTG extensions
    Extensions for Paessler PRTGExtend your monitoring to a new level
  • Icon Features
    FeaturesExplore all monitoring features

Monitoring with PRTG

  • Network monitoring
  • Bandwidth monitoring
  • SNMP monitoring
  • Network mapping
  • Wi-Fi monitoring
  • Server monitoring
  • Network traffic analyzer
  • NetFlow monitoring
  • Syslog server

Useful Links

  • PRTG Manual
  • Knowledge Base
  • Customer Success Stories
  • About Paessler
  • Subscribe to newsletter
  • PRTG Support
  • PRTG Consulting

Contact

Paessler GmbH
Thurn-und-Taxis-Str. 14, 
90411 Nuremberg 
Germany

info@paessler.com

+49 911 93775-0

  • Contact us
©2025 Paessler GmbHTerms & ConditionsPrivacy PolicyImprintReport VulnerabilityDownload & InstallSitemap
Application Application Application