Custom alerts and data visualization let you quickly identify and prevent critical resource utilization issues.
Are you constantly battling performance issues and system slowdowns? With Paessler PRTG resource monitoring, you can track every critical metric across your infrastructure and receive instant alerts when thresholds are exceeded, allowing you to resolve issues before users even notice them.
Monitor all essential resources from a single dashboard with PRTG. Track CPU usage, memory consumption, and disk space utilization across your entire infrastructure. Gain immediate insights into resource bottlenecks affecting your systems.
Receive alerts the moment any resource metric exceeds your defined thresholds. Configure notifications via email, SMS, push notifications, or custom webhooks based on your preferences. Respond to critical issues before they impact your business operations.
Create personalized views that display exactly what matters most to you. Arrange widgets to monitor CPU, memory, disk space, and network bandwidth in one unified interface. Share dashboards with team members for improved collaboration and faster troubleshooting.
Review resource usage patterns over time to identify recurring issues and plan capacity upgrades. Generate comprehensive reports on resource utilization trends across days, weeks, or months. Make data-driven decisions about hardware investments and resource allocation.
Diagnose network issues by continuously tracking server resources, virtual machine performance and bandwidth utilization. Show resource consumption and other key metrics in real time. Visualize monitoring data in clear graphs and dashboards to identify problems more easily. Gain the overview you need to troubleshoot resource constraints and capacity issues.

Device tree view of the complete monitoring setup

Custom PRTG dashboard for keeping an eye on the entire IT infrastructure

Live traffic data graph in PRTG
“All-around winning
network monitor”
“The real beauty of PRTG is the endless possibilities it offers”
“PRTG Network Monitor
is very hard to beat”
When resources run low, your entire network can grind to a halt. Servers become unresponsive, applications crash, and users flood your inbox with complaints. Without proper visibility into your system resources, you're left scrambling to identify which CPU is maxed out, which server is running out of memory, or why your storage is suddenly filling up.
Choose the subscription model that perfectly fits your organization's size and monitoring needs. Scale your monitoring capabilities up or down as your infrastructure evolves without complicated licensing changes. Enjoy transparent pricing with no hidden costs or unexpected fees.
Access knowledgeable assistance whenever you encounter monitoring challenges or configuration questions. Reach out to a dedicated support team via email or phone for quick resolution of technical issues. Benefit from extensive documentation, video tutorials, and an active user community to maximize your monitoring potential.
Deploy remote probes across multiple locations to monitor resources without network constraints or firewall issues. Collect resource metrics from branch offices, remote data centers, and cloud environments through a unified interface. Maintain complete visibility of your entire infrastructure regardless of geographical distribution.
Reduce manual monitoring tasks through powerful automation features that respond to resource issues. Set up automatic notifications and actions when CPU, memory, or disk thresholds are breached. Create custom scripts and workflows that remediate common resource problems without human intervention.
PRTG comes with more than 250 native sensor types for monitoring your entire on-premises, cloud, and hybrid cloud environment out of the box. Check out some examples below!
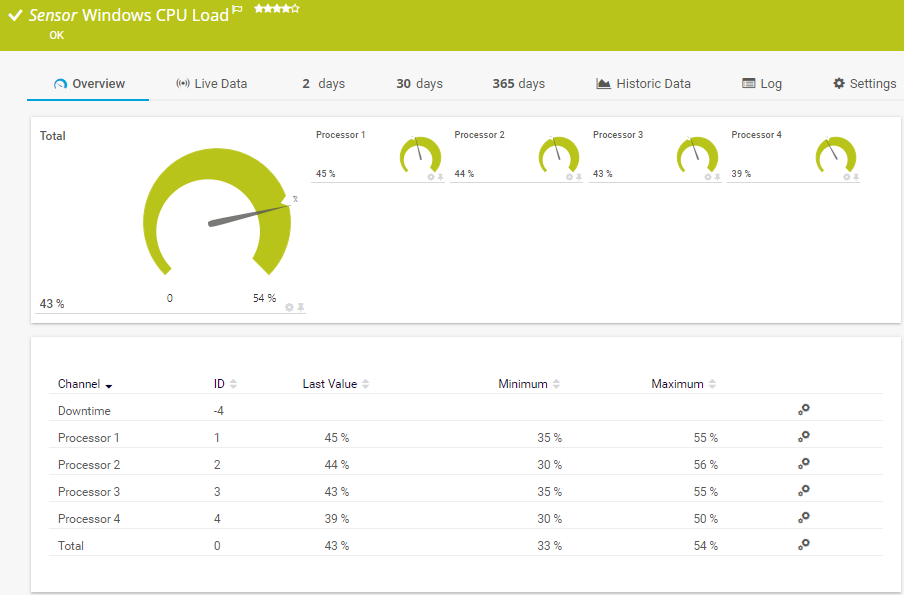
The Windows CPU Load sensor monitors the CPU load on a system via Windows Management Instrumentation (WMI) or Windows performance counters. It can show the following:
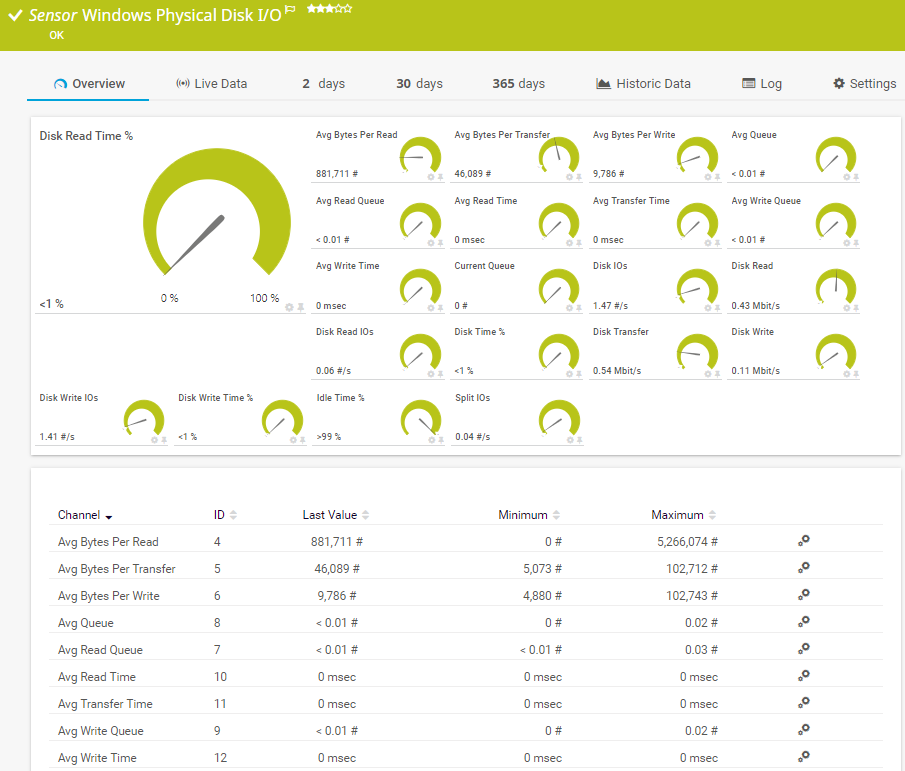
The Windows Physical Disk I/O sensor monitors the input/output (I/O) parameters of a hard disk on a Windows system via Windows Management Instrumentation (WMI) or Windows performance counters. It can show the following:
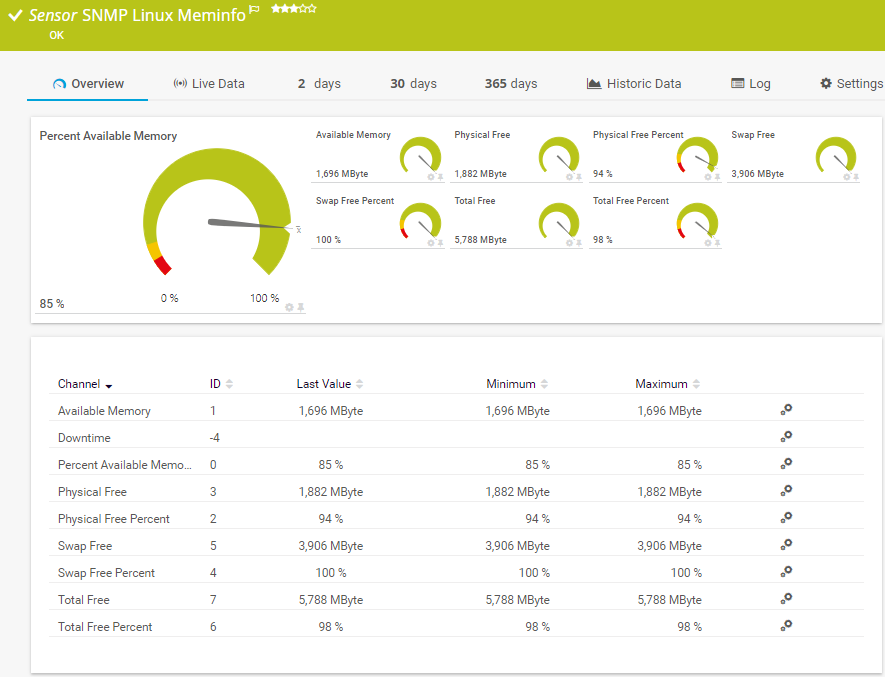
The SNMP Linux Meminfo sensor monitors the memory usage of a Linux/Unix system. It can show the following:
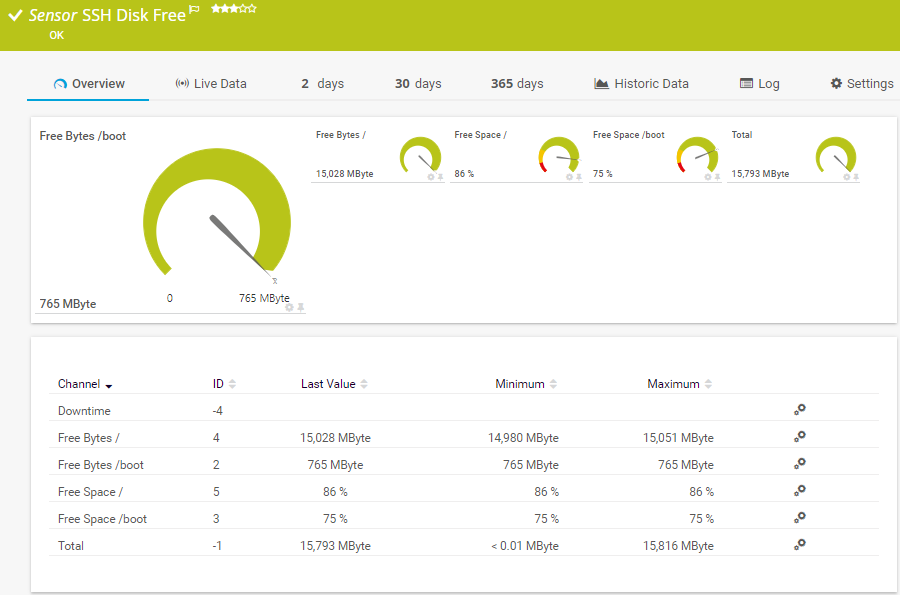
The SSH Disk Free sensor monitors the free space on disks of a Linux/Unix system using Secure Shell (SSH). It can show the following:
See the PRTG Manual for a list of all available sensor types.

Custom alerts and data visualization let you quickly identify and prevent performance bottlenecks and resource shortages.
PRTG is set up in a matter of minutes and can be used on a wide variety of mobile devices.


“Excellent tool for detailed monitoring. Alarms and notifications work greatly. Equipment addition is straight forward and server initial setup is very easy. ...feel safe to purchase it if you intend to monitor a large networking landscape.”
Partnering with innovative IT vendors, Paessler unleashes synergies to create
new and additional benefits for joined customers.
Combining PRTG’s broad monitoring feature set with IP Fabric’s automated network assurance creates a new level of network visibility and reliability.
Siemon and Paessler bring together intelligent building technology and advanced monitoring and make your vision of intelligent buildings and data centers become reality.
UVexplorer integrates tightly with PRTG to bring fast and accurate network discovery, detailed device inventory, and automatic network mapping to the PRTG platform.
Real-time notifications mean faster troubleshooting so that you can act before more serious issues occur.
Network Monitoring Software – Version 25.3.110.1313 (August 27, 2025)
Download for Windows and cloud-based version PRTG Hosted Monitor available
English, German, Spanish, French, Portuguese, Dutch, Russian, Japanese, and Simplified Chinese
Network devices, bandwidth, servers, applications, virtual environments, remote systems, IoT, and more
Choose the PRTG Network Monitor subscription that's best for you
A resource monitoring tool tracks key system metrics like CPU usage, memory consumption, and disk space in real-time. These tools provide visibility into resource utilization across your infrastructure, helping you identify performance issues before they impact end-users. Modern solutions like PRTG offer comprehensive resource management capabilities with customizable dashboards that display metrics from physical memory, operating systems, and cloud services in one unified interface.
PRTG monitors resources across Windows, Linux, and cloud platforms through various protocols and modules. For Microsoft environments, PRTG uses WMI and performance counters to track CPU, memory usage, and disk space. For Linux systems, PRTG employs SNMP and SSH monitoring. The platform also offers connectivity to cloud services like AWS, Azure, and Kubernetes clusters through specialized API integrations, providing unified real-time monitoring regardless of where your resources are hosted.
Yes, PRTG is an excellent tool for DevOps teams focused on maintaining optimal resource utilization. The platform offers API access for integration with CI/CD pipelines and automation workflows. DevOps professionals can set up alerts for performance monitoring thresholds, track resource usage in containerized environments like Kubernetes, and create custom dashboards showing the metrics most relevant to their workflows. This helps teams maintain system reliability while optimizing resource management across development and production environments.
Resource monitoring plays a crucial role in security by detecting unusual patterns that might indicate vulnerabilities or breaches. Sudden spikes in CPU or memory usage could signal malware activity or unauthorized access. PRTG helps identify these anomalies through real-time monitoring and alerts. Additionally, PRTG supports access control features that let you determine who can view and manage monitoring data, ensuring security information is only available to authorized personnel.
Absolutely. PRTG offers specialized sensors for monitoring virtualized resources and containerized applications. For virtual environments, PRTG tracks resource allocation, CPU usage, and memory consumption across VMs. In Kubernetes environments, PRTG can monitor pod resource utilization, cluster health, and container performance. This comprehensive visibility helps prevent resource contention issues that can affect application performance in dynamic, multi-tenant environments.
Yes, PRTG can complement open source monitoring solutions through its extensive API capabilities. Many organizations use PRTG alongside tools from the GitHub community for specialized monitoring needs. The PRTG API allows for bidirectional data exchange with popular open source tools, creating a more comprehensive monitoring ecosystem. This flexibility lets you leverage the strengths of both commercial and open source monitoring approaches while maintaining a centralized view of resource utilization.
Resource monitoring provides essential data for effective capacity planning by tracking utilization trends over time. PRTG stores historical performance monitoring data that reveals patterns in resource usage across your infrastructure. By analyzing these trends, you can identify when physical memory, CPU, or storage resources are approaching capacity limits. This proactive approach to resource management helps you plan upgrades before performance issues occur, optimize existing resources, and make informed decisions about scaling your infrastructure.
In PRTG, “sensors” are the basic monitoring elements. One sensor usually monitors one measured value in your network, for example the traffic of a switch port, the CPU load of a server, or the free space on a disk drive. On average, you need about 5-10 sensors per device or one sensor per switch port.
Paessler conducted trials in over 600 IT departments worldwide to tune its network monitoring software closer to the needs of sysadmins. The result of the survey: over 95% of the participants would recommend PRTG – or already have.

Paessler PRTG is used by companies of all sizes. Sysadmins love PRTG because it makes their job a whole lot easier.
Bandwidth, servers, virtual environments, websites, VoIP services – PRTG keeps an eye on your entire network.
Everyone has different monitoring needs. That’s why we let you try PRTG for free.