• Company
    • About Us
    • Case Studies
    • Press Center
    • Events
    • Careers
    • Blog
    • Contact us
  • Contact us
  • Login
 
  • English
    • Deutsch
    • Español
    • Français
    • Italiano
    • Português
Paessler
                    - The Monitoring Experts
  • Products
    • Paessler PRTG
      Paessler PRTGMonitor your whole IT infrastructure
      • PRTG Network Monitor
      • PRTG Enterprise Monitor
      • PRTG Hosted Monitor
      • PRTG extensionsExtensions for Paessler PRTGExtend your monitoring to a new level
    • Icon Features
      FeaturesExplore all monitoring features
      • Maps & dashboards
      • Alerts & notifications
      • Multiple user interfaces
      • Distributed monitoring
      • Customizable reporting
  • Solutions
    • Industries
      IndustriesMonitor various industry sectors
      • Industrial
      • Healthcare
      • Data Center
      • Education
      • Finance
      • Government
    • IT Topics
      IT TopicsMonitor all areas of IT
      • Network Monitoring
      • Bandwidth Monitoring
      • SNMP Monitor
      • Network Mapping
      • WiFi Monitoring
      • Server Monitoring
  • Pricing
  • Resources
    • Getting Started
      Getting StartedModules for self-paced learning
    • How-to Guides
      How-to GuidesGet the most out of PRTG
    • Videos & Webinars
      Videos & WebinarsLearn from Paessler experts
    • IT  Knowledge
      IT KnowledgeExpand your IT knowledge
    • PRTG Manual
      PRTG ManualFull documentation
    • Knowledge Base
      Knowledge BaseShare community knowledge
    • PRTG Sensor Hub
      PRTG Sensor HubGet sensors, scripts & templates
    • Trainings
      PRTG TrainingLearn how to work with PRTG
  • Partners
    • icon star
      New Partners and MSPBecome a new partner or MSP
    • icon partner
      Partner PortalLog in to your partner account
    • icon search
      Find a PartnerFind partners selling Paessler products
    • icon technology
      Technology AlliancesSee Paessler technology partnerships
  • Company
    • About Us
    • Case Studies
    • Press Center
    • Events
    • Careers
    • Blog
    • Contact us
  • Contact us
  • Login
  • English
    • Deutsch
    • Español
    • Français
    • Italiano
    • Português
  • Get a quote
  • Free trial
  1. Home>
  2. IT Topics>
  3. Hardware>
  4. Port Scanner
PRTG Logo

Port Scanner with PRTG

Strengthen your network security by keeping a 24/7 eye on your devices' ports

  • Monitor TCP and UDP port status, bandwidth usage, and other key stats
  • Identify and fix potential vulnerabilities like open ports
  • Set custom alerts and get notified about issues near-instantly
Free download
product overview

Our users give top ratings for monitoring with Paessler PRTG

Gartner peer insights
spiceworks
Capterra
G2
Trustpilot

PRTG port scanner: What you will find on this page

Table of content
  • 3 reasons why to use PRTG as your port scanning tool
  • What port scanning looks like in PRTG
  • Explore our preconfigured PRTG sensors for port scanning
  • Port Scanner: FAQ

PRTG makes port scanner as easy as it gets

Custom alerts and data visualization let you quickly identify and prevent resource bottlenecks, vulnerabilities, and other network issues.

Free download
PRODUCT OVERVIEW

A network with glitchy ports is like a house with broken doors

If your doors are stuck, the simple act of leaving one room and entering another can feel like an intense gym workout. And if they don't close properly, there's a risk anyone could come in. Even people who aren't welcome in your home.

Paessler PRTG is your comprehensive network port scanner for tracking all your UDP and TCP ports' key stats and alerting you promptly when they aren't working as they should. That means it's easier to clear the way if there are bottlenecks, and make sure those you want to keep out of your network stay out. 

Table of content

3 reasons why to use PRTG as your port scanning tool

Icon Heartbeat

Relentless reliability

Network health issues don't take days off. And neither does PRTG. Our port scanner monitors your network devices round the clock, continuously checking the status of all ports and determining whether a port is open, closed, or hidden.

Icon Lock

Robust security

With so much on your plate, potentially critical security issues can easily go unnoticed. PRTG open port checker keeps a close eye on switch ports, router ports, server ports, and other network infrastructure, rooting out weak spots before bad actors can exploit them.

Icon Alarm

Real-time alerts

Pick your preferred warning and error thresholds, and PRTG will ping you as soon as any of your network's ports are at risk of going under or over, so you can fix issues, and avoid security incidents and network disruption without breaking a sweat.

What port scanning looks like in PRTG

Diagnose network issues by continuously tracking ports across your network. Show port status, data transfer speed, and other key stats  in real time. Visualize monitoring data in clear graphs and dashboards to identify problems more easily. Gain the overview you need to troubleshoot speed issues, security vulnerabilities, and other port problems. 

PRTG Screenshot device tree view

Device tree view of the complete monitoring setup

PRTG screenshot map entire it infrastructure

Custom PRTG dashboard for keeping an eye on the entire IT infrastructure

PRTG screenshot graph live data traffic

Live traffic data graph in PRTG

Start port scanning with PRTG and see how it can make your network more reliable and your job easier.

Free download
PRODUCT OVERVIEW

IT experts agree: Paessler PRTG is a great solution for IT infrastructure monitoring

PCMag

“All-around winning
 network monitor”

IT Brief

“The real beauty of PRTG is the endless possibilities it offers”

ITPro

“PRTG Network Monitor 
is very hard to beat”

Explore our preconfigured PRTG sensors for port scanning

PRTG comes with more than 250 native sensor types for monitoring your entire on-premises, cloud, and hybrid cloud environment out of the box. Check out some examples below!

Port v2

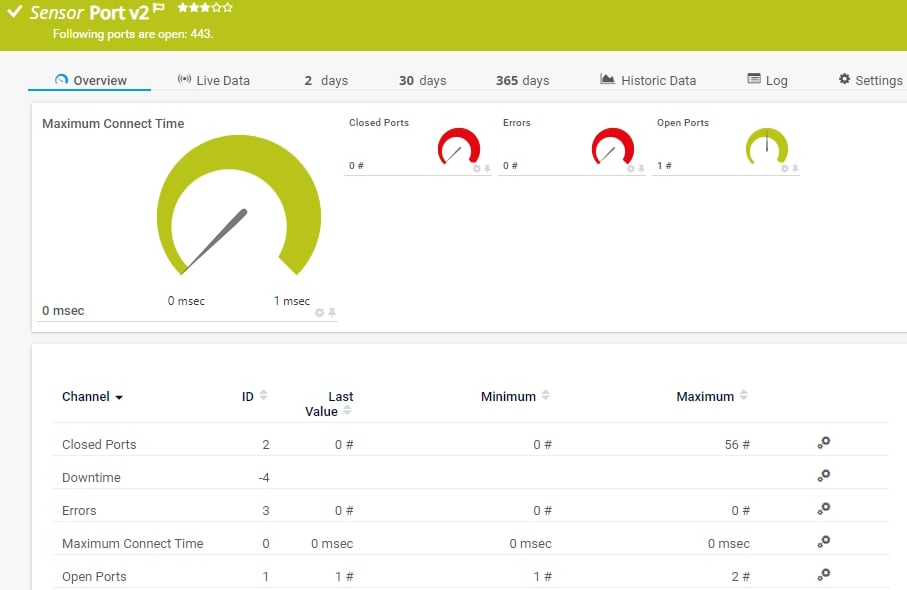
The Port v2 sensor monitors a network service by connecting to one or more of its TCP/IP ports. It can show the following:

  • Number of open and closed ports
  • Number of errors
  • Maximum time until a request to connect to a port was accepted
Port v2
Port v2

Port Range

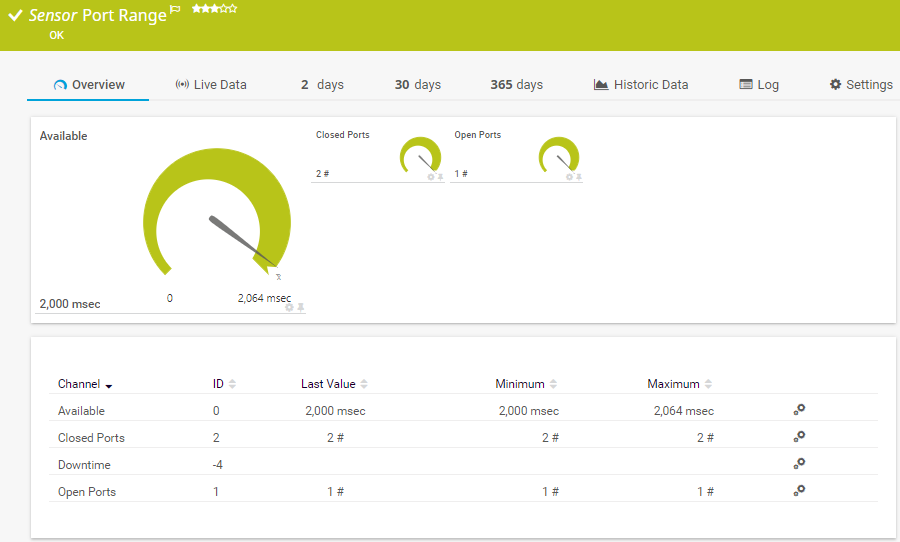
The Port Range sensor monitors a network service by connecting to various TCP/IP ports. It tries to connect to the specified TCP/IP port numbers of a device in succession and waits for the device to accept each request. It can show the following:

  • Time until requests to ports are accepted
  • Number of open and closed ports
Port Range
Port Range

SSL Security Check

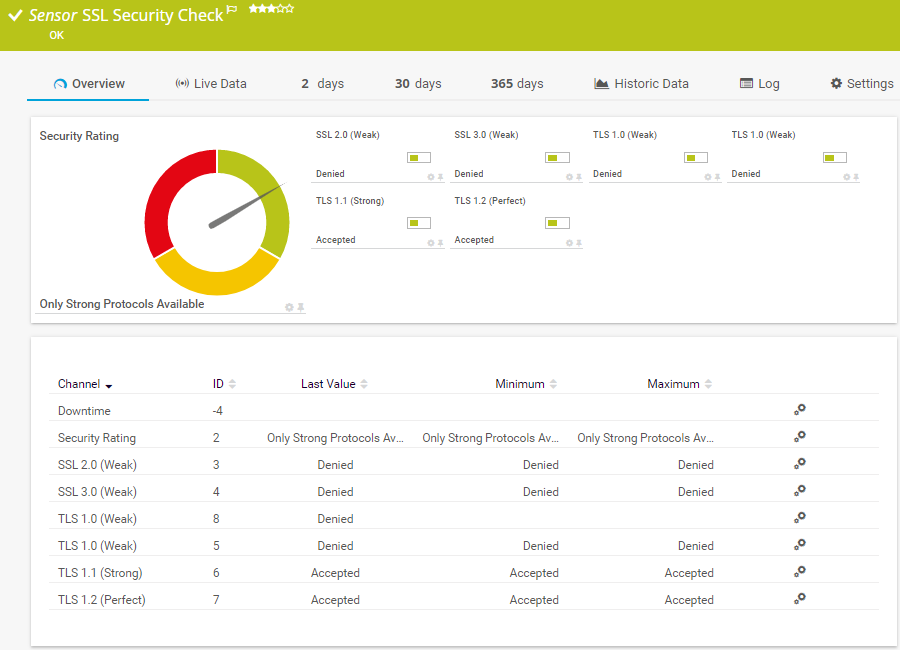
The SSL Security Check sensor monitors Secure Sockets Layer (SSL)/Transport Layer Security (TLS) connectivity to the port of a device. It tries to connect to the specified TCP/IP port number of a device with different SSL/TLS versions and shows if the device supports a particular protocol. It can show the following:

  • Security of the connection to the defined port
  • Status of connections using SSL v3, TLS 1.0, TLS 1.1, TLS 1.2, and TLS 1.3
SSL Security Check
SSL Security Check

See the PRTG Manual for a list of all available sensor types.

PRTG is compatible with all major vendors, products, and systems

compatible with all major vendors, products, and systems

PRTG makes scanning your network's ports as easy as it gets

Custom alerts and data visualization let you quickly identify and prevent resource bottlenecks, vulnerabilities, and other network issues.

Free download
PRODUCT OVERVIEW

“From a server perspective, we're monitoring all of the key components of our service such as CPU usage, RAM disk space, the Windows services that it's running, and network connectivity of that server. In terms of networks, we’re monitoring all of our switches, firewalls, and access points. It’s really useful to be able to easily pull performance metrics from the PRTG dashboard.”

Ollie Kerslake, Infrastructure Lead
Riverford Organic Farmers

“The tool has given us greater control over all types of devices connected to the network (switches, IP telephony, security cameras, IoT, WiFi) that previously remained opaque when dealing with service incidents. This has improved our ability to diagnose and resolve problems, which has translated into greater efficiency and a better user experience in both internal and public services.”

Jordi Tolosà Bel, New Technologies Technician
Vinaroz City Council

“Our objective was to be able to monitor the health of our most critical servers containing data and applications, but also the flows and bandwidth between headquarters, our 50 servers in the cloud and the 15 servers at our production sites. For us, it is essential to have a proactive approach to understand where the weaknesses of the IT system are to be able to improve them.”

Marc Boullier, CIO
Carambar & Co

Your port scanner at a glance – even on the go

PRTG is set up in a matter of minutes and can be used on a wide variety of mobile devices.

device overview
Gartner peer insights

“Excellent tool for detailed monitoring. Alarms and notifications work greatly. Equipment addition is straight forward and server initial setup is very easy. ...feel safe to purchase it if you intend to monitor a large networking landscape.”

Read the complete review at Gartner Peer Insights

Create innovative solutions with Paessler’s IT partners

Partnering with innovative IT vendors, Paessler unleashes synergies to create
new and additional benefits for joined customers.

Martello

Martello 

By integrating PRTG with Martello iQ, you can add a fast analytics layer to improve uptime, visualize your IT environment, and integrate all of your IT systems into a single pane of glass.

Read more
Plixer

Plixer

Paessler and Plixer provide a complete solution adding flow and metadata analysis to a powerful network monitoring tool.

Read more
Siemon

Siemon

Siemon and Paessler bring together intelligent building technology and advanced monitoring and make your vision of intelligent buildings and data centers become reality.

Read more

Find the root cause of the problem with our PRTG port scanning solution

Real-time notifications mean faster troubleshooting so that you can act before more serious issues occur.

Free download
PRODUCT OVERVIEW
Paessler PRTG

Paessler PRTG

Network Monitoring Software – Version 24.4.102.1351 (November 12th, 2024)

Hosting icon

Hosting

Download for Windows and cloud-based version PRTG Hosted Monitor available

Languages icon

Languages

English, German, Spanish, French, Portuguese, Dutch, Russian, Japanese, and Simplified Chinese

test

Monitor everything

Network devices, bandwidth, servers, applications, virtual environments, remote systems, IoT, and more

test

Pricing

Choose the PRTG Network Monitor subscription that's best for you

Discover more monitoring insights and stories

Resources Solution

Solutions for all your monitoring needs

  • IP scanner
  • SNMP port analyzer PRTG
  • Network Device Scanner
Resources Content

Powerful stories from the monitoring world

  • The Dude Abides. But He's Not The Only Free Network Tool Out There.
  • Monitor Dell PowerEdge servers
  • SNMP Doesn’t Work! Can Somebody Out There Please Help?!
Resources Solutions

Resources to master your monitoring challenges

  • Port Scanning Sensor - Support More than 42 Ports Scannable in 15 Minute Timeout
  • Port scan occurs periodically
  • TCP port scan to a remote server

Port Scanner: FAQ


What is a port?

Ports are endpoints that make it easier for all the different processes and services on your network to talk to each other. When ports are working as they should, data flows freely and your network runs smoothly. But when ports are misconfigured or have other issues, they can slow your network down and make you more vulnerable to trojans and other security risks.

Ports are part of a network address (IP address). They ensure TCP connections and data packets are assigned correctly and allow for the processing of services on the Internet. This may involve the transfer of files (ports 20 and 21) with the file transfer protocol (FTP), the sending of an email (port 25) via SMTP and IMAP, the SSH (Secure Shell) port 25, or the assignment of names to an IP address (Port 53) in a domain name system (DNS). Ports use a transport protocol to transmit information. Each port is assigned a non-random number. These port numbers range from 0 to 65535, with 1 to 1023 used for Internet protocols.

What is a transport protocol?

A transport protocol – aka a “network protocol” – specifies how data is to be exchanged between the components in a network. In other words, it defines the way in which data is transmitted. The two most common protocols are the Transmission Control Protocol (TCP) and the User Datagram Protocol (UDP). PRTG can be used as a port scanner for both TCP and UDP scans.

What is a port scanner?

A port scanner is a tool that checks the status of ports. It uses queries to determine whether a port is open, closed, or hidden.

  • Open port: The computer accepts the query, responds, and asks what to do next.
  • Closed port: The computer responds to the query and indicates that the port is in use and therefore unavailable.
  • Hidden port: The computer provides no response to the query. The port may be hidden, filtered, locked, or blocked.

Some port scanners also scan open ports for additional information (such as the operating system in use), but this is not their primary purpose.

How does a port scanner function?

Port scanners work in a variety of ways. The simplest (and most common) way involves the uninterrupted transfer of data to a specific host. The port scanner notifies the system as soon as a data packet reaches an open port. Data packet types can also vary: TCP, UPD, ICMP, FIN, and ACK are just a few examples.

Port scanners can scan both vertically and horizontally. With vertical scans, a single network address is scanned on multiple ports. Horizontal scans, on the other hand, test several network addresses on a specific port (e.g., port 80).

What's the difference between port scanning and port monitoring?

Port monitoring is like surveillance, while port scanning is an inspection. A port monitoring tool helps you track overall performance and identify long-term trends. A port scanner, on the other hand, is how you spot potentially imminent threats, such as ports that are open when they should be closed.

How does PRTG port scanner work?

PRTG port scanner regularly sends network requests to your chosen port and tracks how long it takes for the port to receive it. This enables it to identify whether the port is open or closed, and what devices, applications, or other services it's being used for.

PRTG is designed to scan ports using TCP. But you can also scan ports using UDP by creating a custom script.

What is a sensor in PRTG?

In PRTG, “sensors” are the basic monitoring elements. One sensor usually monitors one measured value in your network, for example the traffic of a switch port, the CPU load of a server, or the free space on a disk drive. On average, you need about 5-10 sensors per device or one sensor per switch port.

We asked: would you recommend PRTG? Over 95% of our customers say yes!

Paessler conducted trials in over 600 IT departments worldwide to tune its network monitoring software closer to the needs of sysadmins. The result of the survey: over 95% of the participants would recommend PRTG – or already have.

recommendation

Still not convinced?

Love

More than 500,000 sysadmins love PRTG

Paessler PRTG is used by companies of all sizes. Sysadmins love PRTG because it makes their job a whole lot easier.

PRTG

Monitor your entire IT infrastructure

Bandwidth, servers, virtual environments, websites, VoIP services – PRTG keeps an eye on your entire network.

test

Try Paessler PRTG for free

Everyone has different monitoring needs. That’s why we let you try PRTG for free.

PRTG Logo

Start port scanning with PRTG and see how it can make your network more reliable and your job easier.

Free download
PRODUCT OVERVIEW

Products

  • Paessler PRTG
    Paessler PRTGMonitor your whole IT infrastructure
    • PRTG Network Monitor
    • PRTG Enterprise Monitor
    • PRTG Hosted Monitor
  • PRTG extensions
    Extensions for Paessler PRTGExtend your monitoring to a new level
  • Icon Features
    FeaturesExplore all monitoring features

Monitoring with PRTG

  • Network monitoring
  • Bandwidth monitoring
  • SNMP monitoring
  • Network mapping
  • Wi-Fi monitoring
  • Server monitoring
  • Network traffic analyzer
  • NetFlow monitoring
  • Syslog server

Useful Links

  • PRTG Manual
  • Knowledge Base
  • Customer Success Stories
  • About Paessler
  • Subscribe to newsletter
  • PRTG Support
  • PRTG Consulting

Contact

Paessler GmbH
Thurn-und-Taxis-Str. 14, 
90411 Nuremberg 
Germany

info@paessler.com

+49 911 93775-0

  • Contact us
©2025 Paessler GmbHTerms & ConditionsPrivacy PolicyImprintReport VulnerabilityDownload & InstallSitemap
Active Directory Auditing Active Directory Auditing Active Directory Auditing