Custom alerts and data visualization let you quickly identify and prevent overheating and other physical security issues with your server environment.
Availability. Bandwidth. Load. Memory usage. Network traffic.
Any good sysadmin (yes, we're looking at you) makes it their business to ensure they have a good monitoring system in place that tracks important server metrics, and with good reason. Servers are, after all, the heart of your IT infrastructure.
But temperature monitoring, humidity monitoring, and keeping track of other environmental factors (and your data centers' or server rooms’ physical security) is just as important as tracking hardware and software parameters if you want to maximize uptime and keep sensitive data safe.
An overheating server rack, a water leak, or unauthorized access to your data centers can be just as bad for your organization – if not worse – than a misconfigured port or low RAM.
With Paessler PRTG, you can keep a close eye on everything, from one place. Because if your hardware is in an environment that works with it, not against it, you’ll save time, money, and frustration, and your IT equipment will last longer, too.

It doesn't matter how complex your data center infrastructure is and how many server cabinets you need to keep an eye on.
With PRTG, getting started and ongoing operation require minimal effort. The auto-discovery detects network components and assigns the appropriate sensors. Tweak your monitoring environment to suit, and you're good to go.
A single, unified view of your server racks' status and physical environment… and that of your entire IT infrastructure.
PRTG's preconfigured sensors track every hardware and software parameter imaginable, including whether there's been unauthorized access to your server rooms or an issue with your power supply or air conditioning.
PRTG tells you something doesn't look right, before it causes noticeable problems and your phone starts ringing. Pick which parameters to track, your preferred performance thresholds, and whether you'd like to be alerted by text, email, or push notification.
And, because you can see every single mission-critical parameter at a glance, in real time, getting to the bottom of an issue is easier (and quicker).
Diagnose network issues by continuously tracking the physical status of all your server racks. Show server health, temperature, humidity, physical security data, and other key metrics in real time. Visualize monitoring data in clear graphs and dashboards to identify problems more easily. Gain the overview you need to troubleshoot server performance and security issues.

Device tree view of the complete monitoring setup

Custom PRTG dashboard for keeping an eye on the entire IT infrastructure
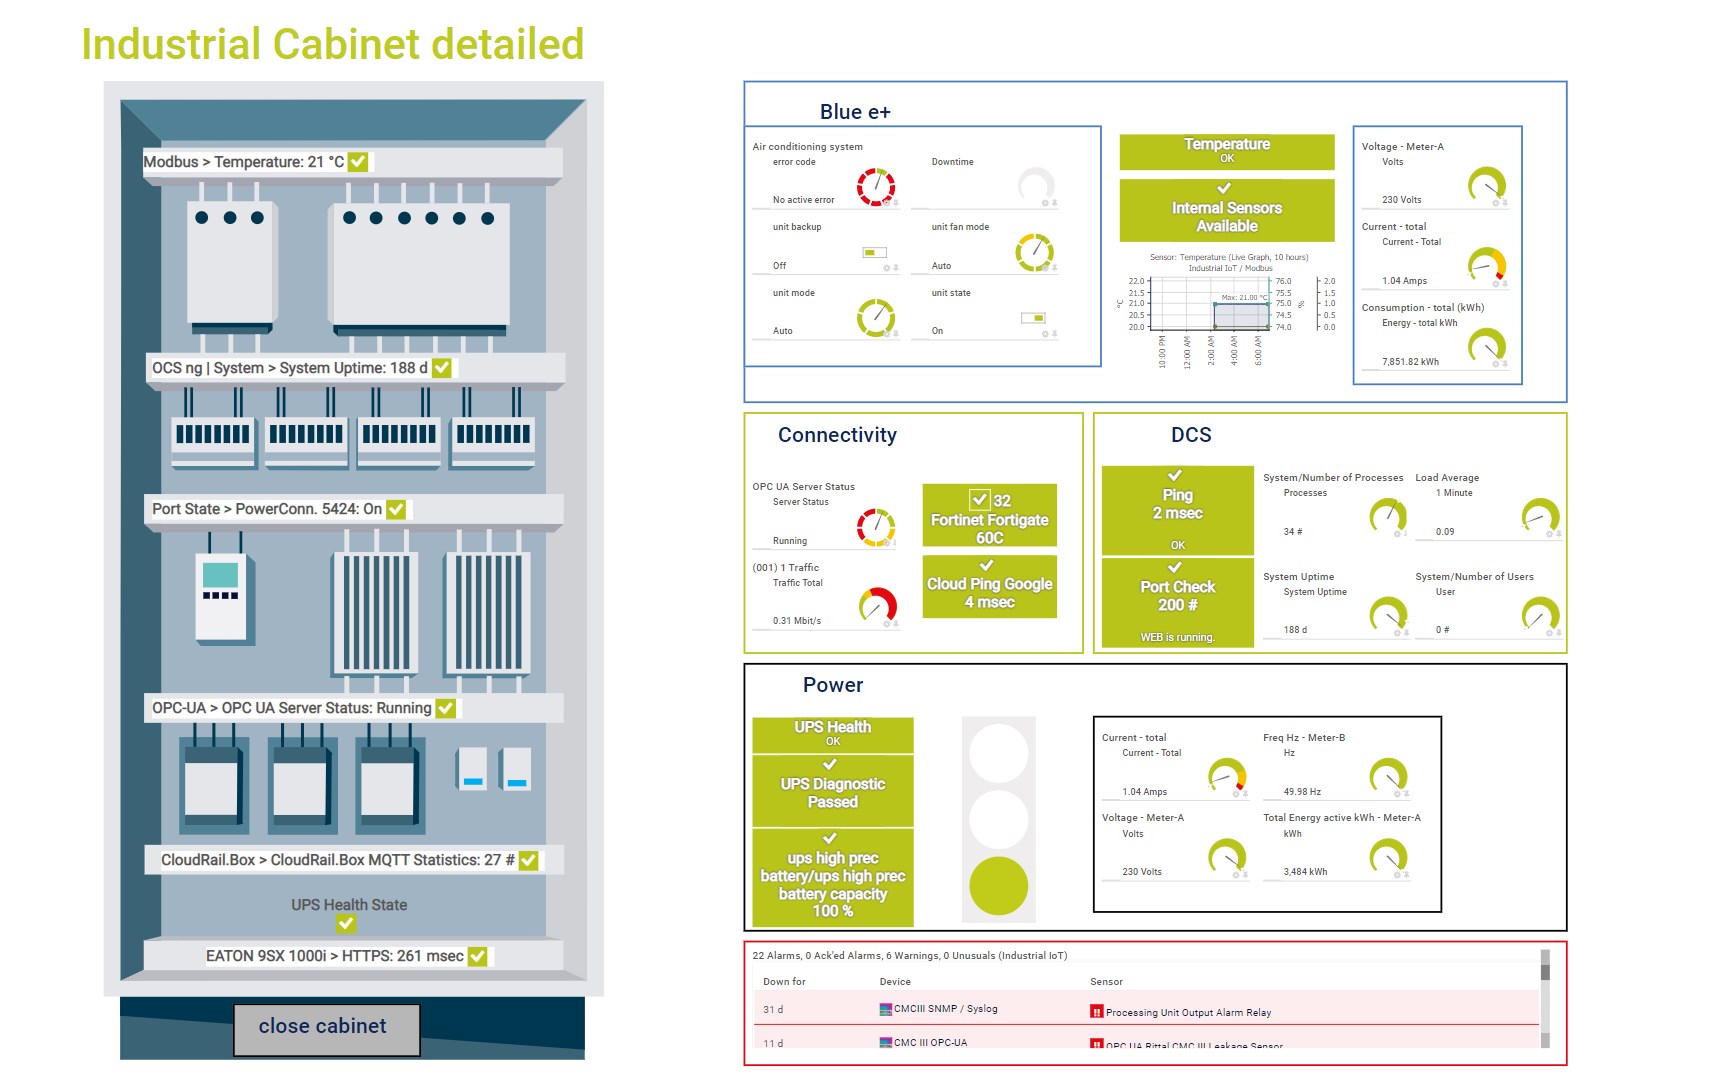
Map of a industrial cabinet in PRTG
“All-around winning
network monitor”
“The real beauty of PRTG is the endless possibilities it offers”
“PRTG Network Monitor
is very hard to beat”
Don’t neglect the physical security of server racks and server cabinets. PRTG combines data from surveillance cameras and various external IoT sensors (for example by Kentix, Jacarta, APC, HWgroup, Netatmo, or egnite) for measuring environmental metrics so that you have everything at a glance.
Rittal and PRTG are the perfect partners for comprehensive server rack monitoring. PRTG keeps a constant eye on all important data from your Rittal CMC III, including humidity and room temperature, air conditioning, and power supplies – out of the box!
PRTG comes with more than 250 native sensor types for monitoring your entire on-premises, cloud, and hybrid cloud environment out of the box. Check out some examples below!
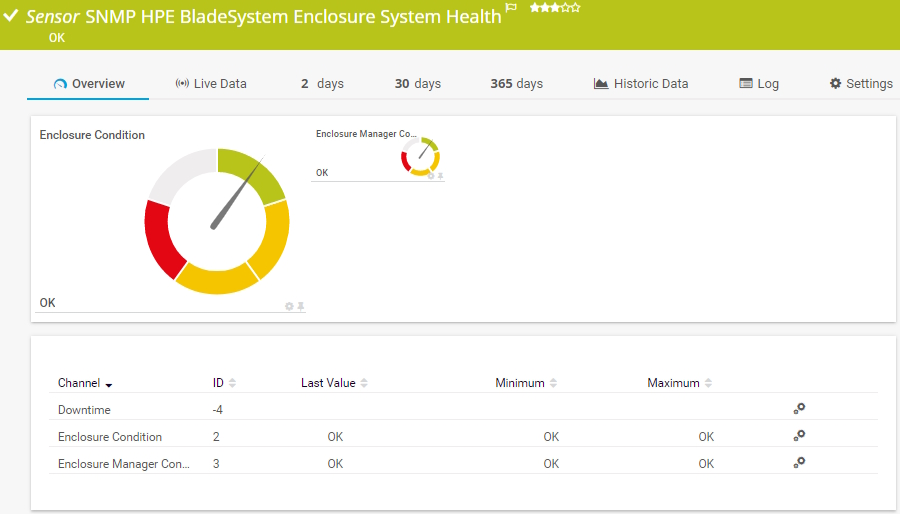
The SNMP HPE BladeSystem Enclosure Health sensor monitors the health of an HPE BladeSystem device. It can show the following:
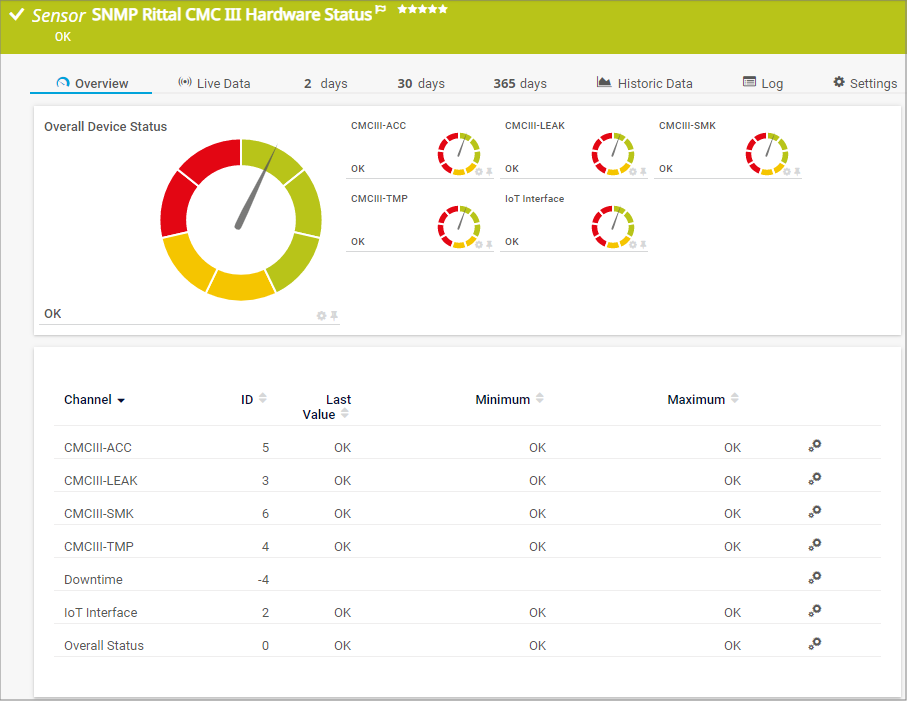
The SNMP Rittal CMC III Hardware Status sensor monitors the overall status of Rittal data center hardware, for example Rittal Computer Multi Control version 3 (CMC III) processing units, Rittal power distribution units (PDU), or Rittal IoT interfaces. It can show the following:
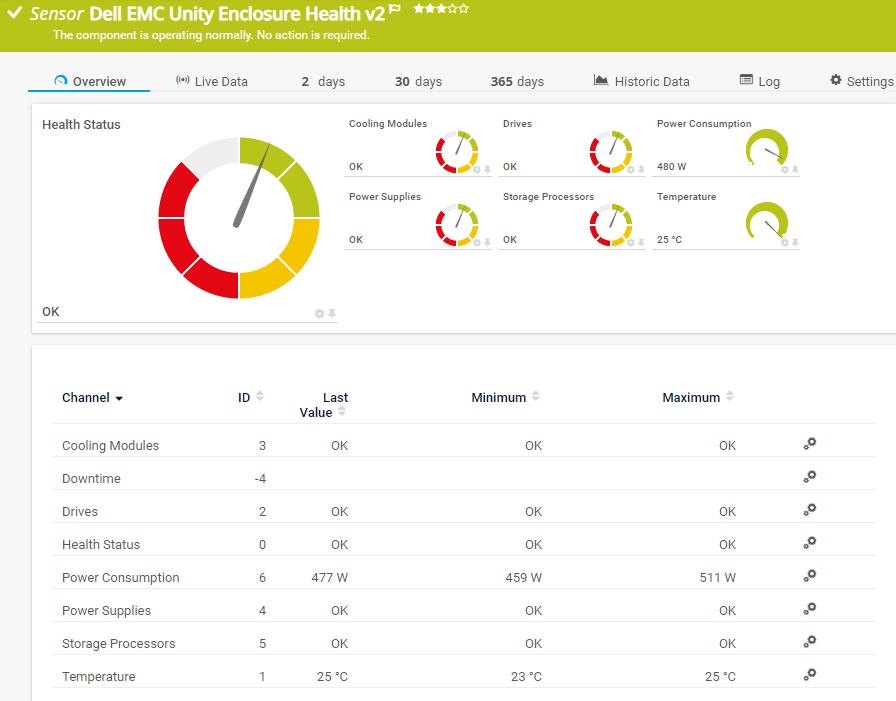
The Dell EMC Unity Enclosure Health v2 sensor monitors the health of a disk-array enclosure (DAE) or a physical or virtual disk processor enclosure (DPE) of a Dell EMC Unity storage system. It can show the following:
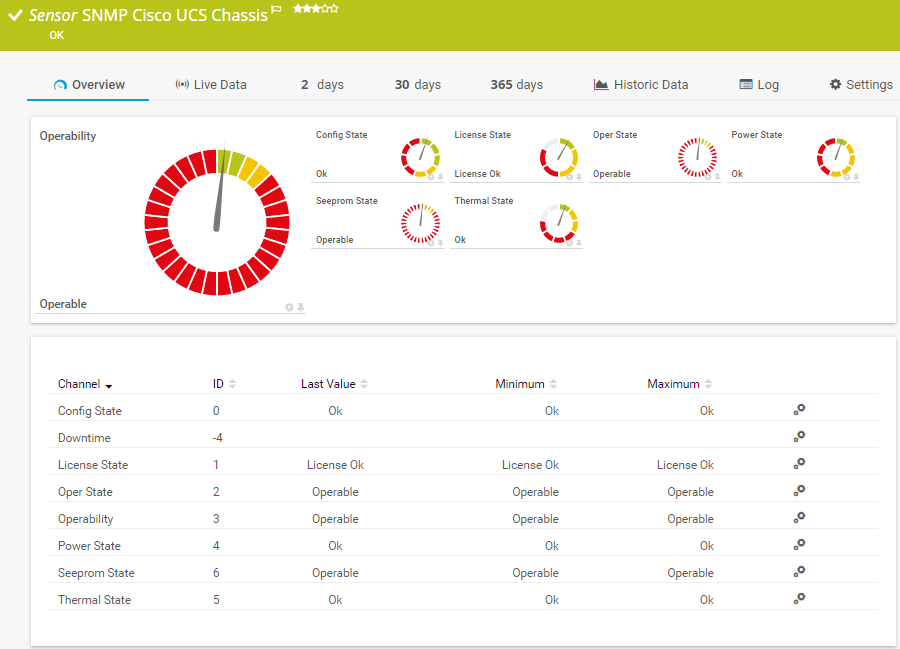
The SNMP Cisco UCS Chassis sensor monitors the health status of the chassis of a Cisco Unified Computing System device. It can show the following:
See the PRTG Manual for a list of all available sensor types.

Custom alerts and data visualization let you quickly identify and prevent overheating and other physical security issues with your server environment.
PRTG is set up in a matter of minutes and can be used on a wide variety of mobile devices.

As one of the leading players in the IT monitoring industry, Paessler has also become an authorized Dell partner for building integrated solutions around the Dell technology ecosystem.
What does this mean for you?
Partnering with innovative IT vendors, Paessler unleashes synergies to create
new and additional benefits for joined customers.
Combining PRTG’s broad monitoring feature set with IP Fabric’s automated network assurance creates a new level of network visibility and reliability.
Combine the functionality of Sigfox and Paessler for the most comprehensive, cost-effective, and easy-to-use IoT solution available.
Combining their tools to a powerful solution for advanced analysis and automation, KnowledgeRiver and Paessler enable IT teams to ensure best performance for their infrastructure and networks.
Real-time notifications mean faster troubleshooting so that you can act before more serious issues occur.
Network Monitoring Software – Version 25.3.110.1313 (August 27, 2025)
Download for Windows and cloud-based version PRTG Hosted Monitor available
English, German, Spanish, French, Portuguese, Dutch, Russian, Japanese, and Simplified Chinese
Network devices, bandwidth, servers, applications, virtual environments, remote systems, IoT, and more
Choose the PRTG Network Monitor subscription that's best for you


A server rack is a standardized frame or enclosure used to mount and organize electronic equipment, especially servers and other data-related hardware, in a space-efficient, accessible, and secure way. Server racks are most commonly found in data centers, network closets, and other IT environments. They help manage large numbers of servers and related devices by keeping them organized and accessible, which aids in cooling, power management, cable routing, and general maintenance.
Paessler PRTG is a proprietary software tool that tracks the health and performance of servers, fans, cooling systems, power distribution units (PDUs), USPs, and other network hardware components, as well as important environmental metrics such as airflow and air pressure, temperature, and humidity. Available for Windows-based on-premises servers or as a cloud-hosted solution, it's capable of monitoring unlimited local, remote, and virtual devices, bringing critical system data together in one simple, intuitive interface you can access from anywhere: at the office, at home, or on the go.
Because it improves your network's performance, prevents avoidable downtime, strengthens security, and, ultimately, saves your organization time and money (and keeps your colleagues and higher-ups happy). But don't take our word for it. Over 95% of PRTG customers would very likely, definitely, or have already recommended our monitoring solution.
Every server rack and data center is different. That said, in general, a CPU is too hot if its temperature is more than 60°C to 90°C (if you're in the US, that's 140°F to 194°F). Humidity typically shouldn't be more than 40% to 60%.
For best results, use temperature sensors for different points in a server rack: front, rear, top, middle, and bottom. PRTG supports an unlimited number of sensors. And don't forget to monitor for potential water leaks and ensure there's enough ventilation. Poor airflow, dust, and other contaminants are the main environmental reasons servers overheat.
In PRTG, “sensors” are the basic monitoring elements. One sensor usually monitors one measured value in your network, for example the traffic of a switch port, the CPU load of a server, or the free space on a disk drive. On average, you need about 5-10 sensors per device or one sensor per switch port.
Paessler conducted trials in over 600 IT departments worldwide to tune its network monitoring software closer to the needs of sysadmins. The result of the survey: over 95% of the participants would recommend PRTG – or already have.

Paessler PRTG is used by companies of all sizes. Sysadmins love PRTG because it makes their job a whole lot easier.
Bandwidth, servers, virtual environments, websites, VoIP services – PRTG keeps an eye on your entire network.
Everyone has different monitoring needs. That’s why we let you try PRTG for free.