• Company
    • About Us
    • Case Studies
    • Press Center
    • Events
    • Careers
    • Blog
    • Contact us
  • Contact us
  • Login
 
  • English
    • Deutsch
    • Español
    • Français
    • Italiano
    • Português
Paessler
                    - The Monitoring Experts
  • Products
    • Paessler PRTG
      Paessler PRTGMonitor your whole IT infrastructure
      • PRTG Network Monitor
      • PRTG Enterprise Monitor
      • PRTG Hosted Monitor
      • PRTG extensionsExtensions for Paessler PRTGExtend your monitoring to a new level
    • Icon Features
      FeaturesExplore all monitoring features
      • Maps & dashboards
      • Alerts & notifications
      • Multiple user interfaces
      • Distributed monitoring
      • Customizable reporting
  • Solutions
    • Industries
      IndustriesMonitor various industry sectors
      • Industrial
      • Healthcare
      • Data Center
      • Education
      • Finance
      • Government
    • IT Topics
      IT TopicsMonitor all areas of IT
      • Network Monitoring
      • Bandwidth Monitoring
      • SNMP Monitor
      • Network Mapping
      • WiFi Monitoring
      • Server Monitoring
  • Pricing
  • Resources
    • Getting Started
      Getting StartedModules for self-paced learning
    • How-to Guides
      How-to GuidesGet the most out of PRTG
    • Videos & Webinars
      Videos & WebinarsLearn from Paessler experts
    • IT  Knowledge
      IT KnowledgeExpand your IT knowledge
    • PRTG Manual
      PRTG ManualFull documentation
    • Knowledge Base
      Knowledge BaseShare community knowledge
    • PRTG Sensor Hub
      PRTG Sensor HubGet sensors, scripts & templates
    • Trainings
      PRTG TrainingLearn how to work with PRTG
  • Partners
    • icon star
      New Partners and MSPBecome a new partner or MSP
    • icon partner
      Partner PortalLog in to your partner account
    • icon search
      Find a PartnerFind partners selling Paessler products
    • icon technology
      Technology AlliancesSee Paessler technology partnerships
  • Company
    • About Us
    • Case Studies
    • Press Center
    • Events
    • Careers
    • Blog
    • Contact us
  • Contact us
  • Login
  • English
    • Deutsch
    • Español
    • Français
    • Italiano
    • Português
  • Get a quote
  • Free trial
  1. Home>
  2. IT Topics>
  3. Virtualization>
  4. XenServer Monitoring
PRTG Logo

XenServer Monitoring with PRTG

Keep a 24/7 eye on your Citrix XenServer environment for a stable virtualized future

  • Monitor Citrix XenServer host servers and virtual machines out of the box
  • Receive real-time alerts and custom notifications for faster troubleshooting
  • View your entire on-prem, virtualized, cloud, and hybrid network from a single pane of glass
Free download
product overview

Our users give top ratings for monitoring with Paessler PRTG

Gartner peer insights
spiceworks
Capterra
G2
Trustpilot

PRTG XenServer monitoring: What you will find on this page

Table of content
  • Get the most from your Citrix hypervisor
  • What Citrix XenServer monitoring looks like in PRTG
  • 3 reasons why PRTG is the XenServer monitoring tool of your choice
  • Explore our preconfigured PRTG sensors for XenServer monitoring
  • Monitoring XenServer: FAQ

PRTG makes XenServer monitoring as easy as it gets

Custom alerts and data visualization let you quickly identify and prevent with your virtualized Citrix environment and your entire network.

Free download
PRODUCT OVERVIEW

Get the most from your Citrix hypervisor with PRTG

Your XenServer environment is only as good as your visibility into its performance. Without proper monitoring, bandwidth bottlenecks and VM outages can catch you off guard. Paessler PRTG gives you complete visibility into your XenServer hosts and virtual machines, helping you solve potential issues before they affect users.

Analytics

Turn performance data into actionable insights

PRTG delivers precise server health and performance monitoring for every host server in your Citrix XenServer environment – from Microsoft Windows servers to Linux hardware and other operating systems.

View CPU load, memory usage, and other key metrics from your XenServer host. Keep tabs on storage throughput, manage nodes, and maintain a stable IT infrastructure without the headaches.

Alarm

Cut through the noise with real-time alerts

Filter out the fluff for faster response times. Set your preferred warning and error thresholds, receive instant notifications, and tackle issues quickly, whether there's a CPU spike or a crowded resource pool.

Integrate with favorite apps, trigger actions via CLI, or get an SMS or email – just the way you prefer. Only essential alerts reach you, so you can stop fretting over every IP address blip.

Settings

Automate setup tasks with zero guesswork

Skip tedious manual changes. PRTG's prebuilt sensors and device templates, simple dialogs, and smart automation handle repetitive tasks.

Install PRTG with a few clicks and let the automatic network discovery find your Xen instances and add them to your monitoring setup, including the preconfigured sensors you need to monitor your Citrix hypervisors, XenServer hosts, and virtual machines.

Backup

Support your XenServer management

Even XenServer needs occasional backups. With PRTG, you can check to make sure the XenServer backup has been completed, even if the backup takes place in the middle of the night.

PRTG’s sophisticated sensors also keep a constant eye on XenServer’s system messages. Ensure that your log files are in order and that you are alerted to critical system events such as unauthorized access or other suspicious activity.

What Citrix XenServer monitoring looks like in PRTG

Diagnose network issues by continuously tracking the availability, health, and performance of your XenServer hypervisors and host servers. Show CPU and memory usage, bandwidth utilization, I/O operations, latency, cluster health, and other key metrics in real time. Visualize monitoring data in clear graphs and dashboards to identify problems more easily. Gain the overview you need to troubleshoot performance issues with your virtualized Citrix environment and your entire network.

PRTG Screenshot device tree view

Device tree view of the complete monitoring setup

PRTG screenshot map entire it infrastructure

Custom PRTG dashboard for keeping an eye on the entire IT infrastructure

PRTG screenshot graph live data traffic

Live traffic data graph in PRTG

Start monitoring Citrix XenServer with PRTG and see how it can make your network more reliable and your job easier.

Free download
PRODUCT OVERVIEW

IT experts agree: Paessler PRTG is a great solution for IT infrastructure monitoring

PCMag

“All-around winning
 network monitor”

IT Brief

“The real beauty of PRTG is the endless possibilities it offers”

ITPro

“PRTG Network Monitor 
is very hard to beat”

3 reasons why PRTG is the XenServer monitoring tool of your choice

virtualization

Grow your network as needed

Your environment grows fast – PRTG grows faster. When you add virtual machines, shift workloads into the cloud, or expand your on-premises infrastructure, PRTG scales along with you.

Add cluster nodes, expand your configuration, and maintain stable resource pools without breaking a sweat. No growing pains, just seamless scaling.

Search

Have a unified view of your entire network

Your XenServer setup doesn't exist in isolation, and neither should your monitoring. PRTG integrates with Active Directory, SaaS applications, and, if you configure SNMP and load the respective MIB files, with basically every device that exists in your network.

With a single pane of glass to look through, this unified approach simplifies network management, cuts complexity, and gives you end-to-end visibility of your entire network.

Alarm

Stay one step ahead of every problem

Don't just react to problems; anticipate them. Custom thresholds and targeted let you solve issues before they escalate.

With SSL support, secure authentication, and IP address tracking, you'll keep XenServer stable, secure, and always under control.

Explore our preconfigured PRTG sensors for XenServer monitoring

PRTG comes with more than 250 native sensor types for monitoring your entire on-premises, cloud, and hybrid cloud environment out of the box. Check out some examples below!

Citrix XenServer Host

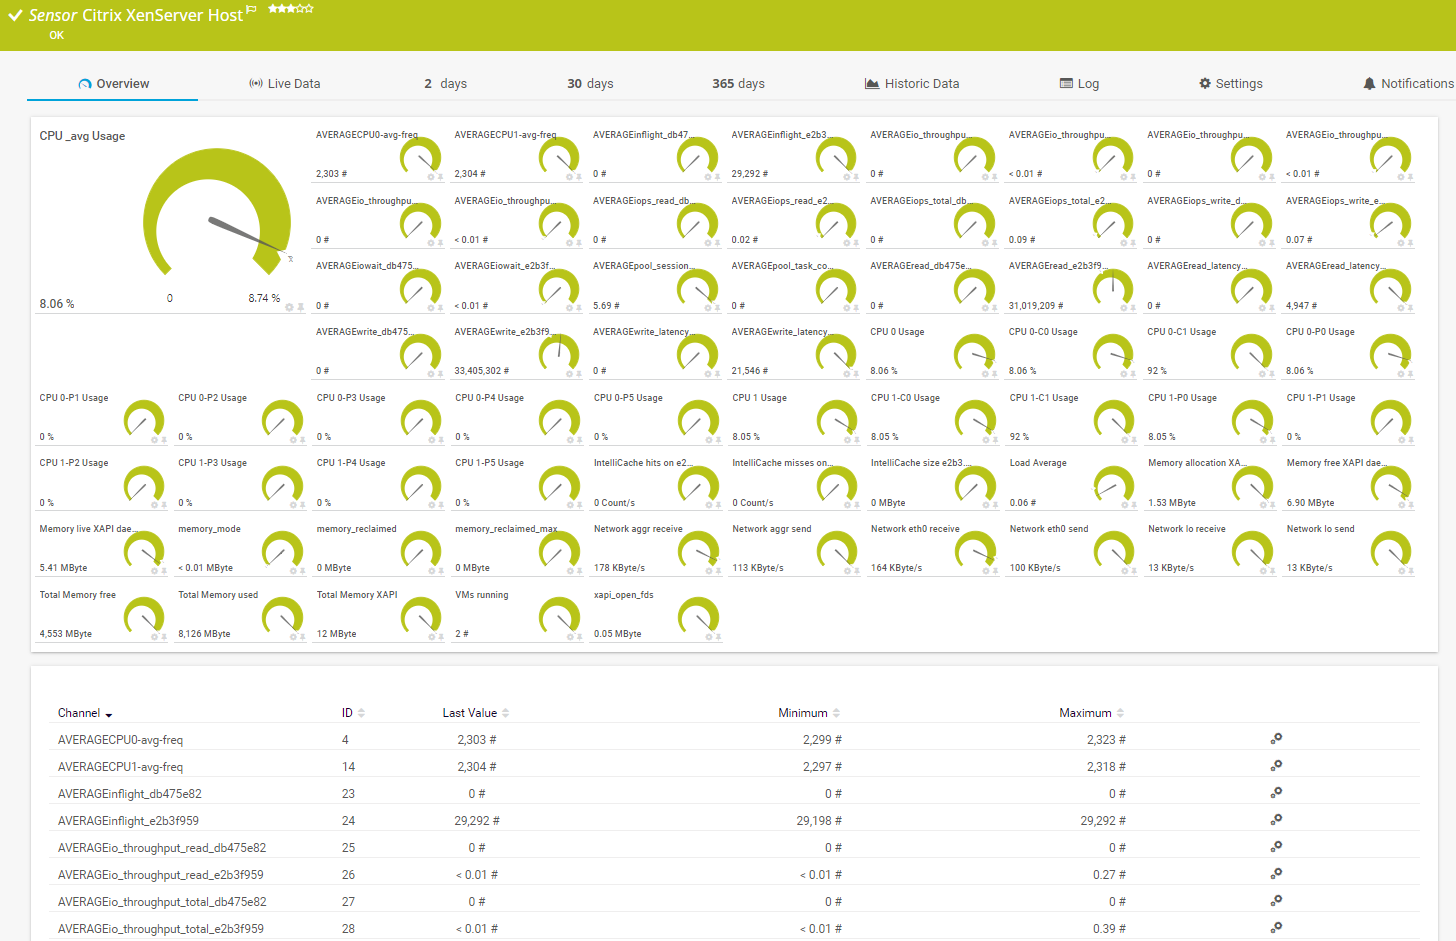
The Citrix XenServer Host sensor monitors a Xen host server via HTTP. It can show the following:

  • CPU usage
  • Load average amount
  • Number of running virtual machines
  • Total available and used memory
Citrix XenServer Host

Citrix XenServer Virtual Machine

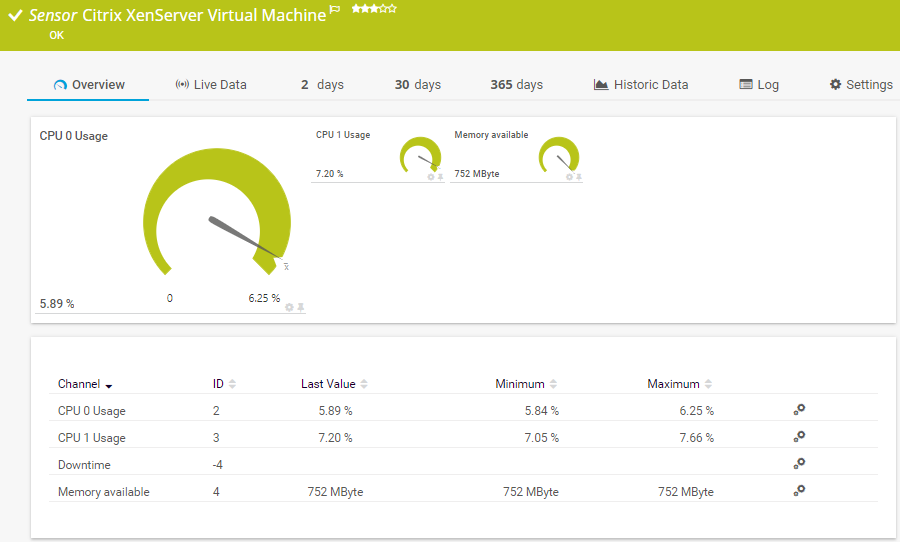
The Citrix XenServer Virtual Machine sensor monitors a virtual machine (VM) on a XenServer via HTTP. It can show the following:

  • CPU usage
  • Available and used memory
  • Balloon driver target size
Citrix XenServer Virtual Machine

SNMP Nutanix Cluster Health

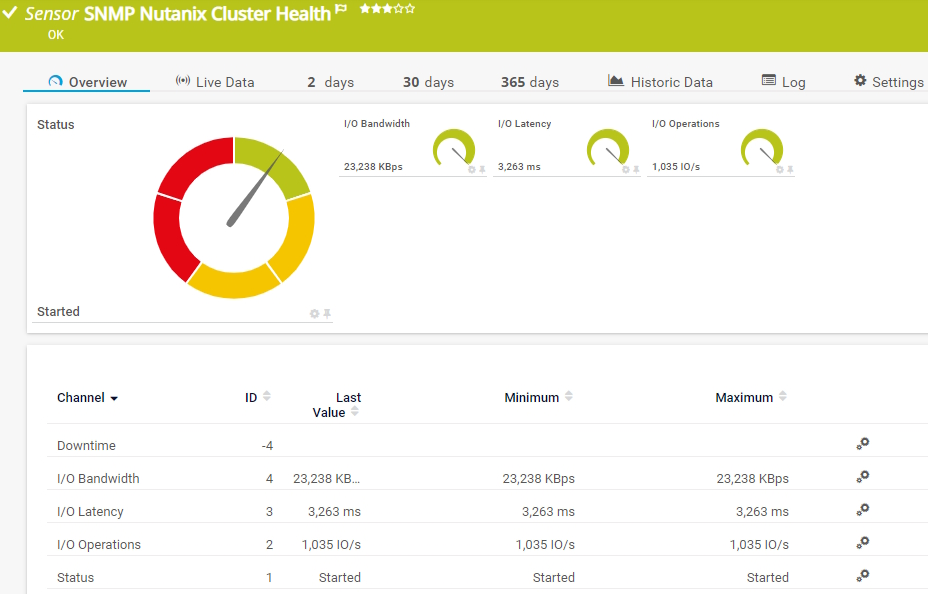
The SNMP Nutanix Cluster Health sensor monitors the status and the performance of a Nutanix cluster. It can show the following:

  • Bandwidth and latency of I/O operations
  • Number of I/O operations
  • Nutanix cluster status
SNMP Nutanix Cluster Health

VMware Host Performance (SOAP)

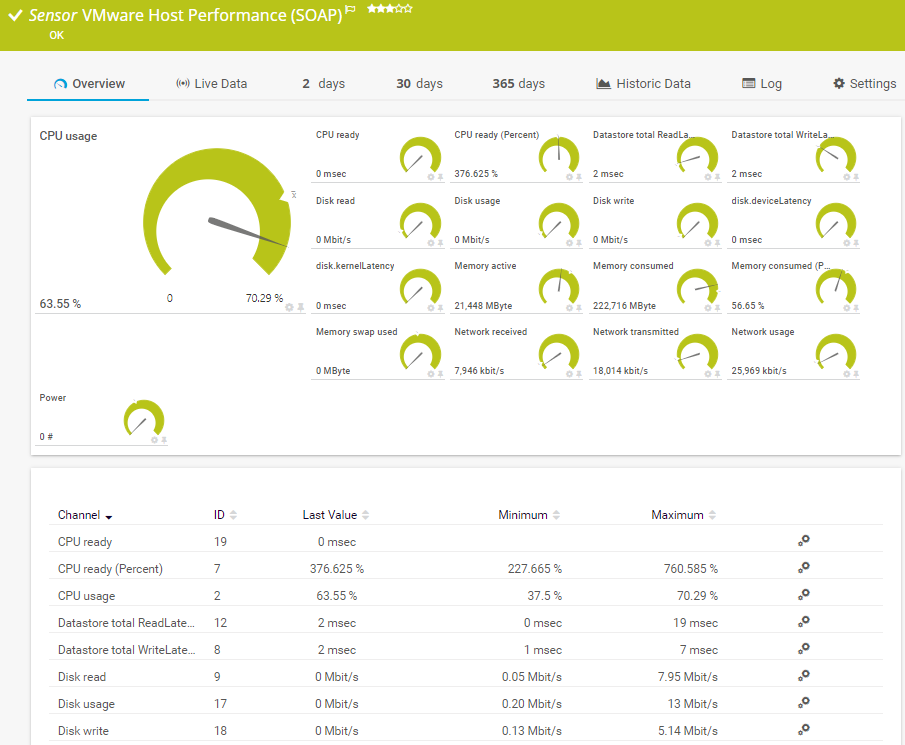
The VMware Host Performance (SOAP) sensor monitors a VMware host server using the Simple Object Access Protocol (SOAP). It can show the following and more:

  • CPU readiness and usage
  • Datastore total read and write latency
  • Disk usage, read and write speed, kernel latency, and device latency
  • Active and consumed memory
  • Received and transmitted bytes
VMware Host Performance (SOAP)

See the PRTG Manual for a list of all available sensor types.

PRTG is compatible with all major vendors, products, and systems

compatible with all major vendors, products, and systems

PRTG makes XenServer monitoring as easy as it gets

Custom alerts and data visualization let you quickly identify and prevent with your virtualized Citrix environment and your entire network.

Free download
PRODUCT OVERVIEW

“With PRTG, you get a centralized, intuitive, all-in-one tool that monitors the entire infrastructure. In the event of an error, the software immediately informs you by email. If you don’t hear from PRTG, you can sit back and relax, knowing everything is in order. Shortly after implementing PRTG, we were able to identify and eliminate performance bottlenecks in our VMware environment and load problems in our network.”

Steffen Ille, Head of Infrastructure, Service Center for Computer Systems and Communication
Bauhaus University Weimar

“The demands on our entire IT infrastructure have grown steadily in recent years. An important step towards the optimization of this environment involved the virtualization of our digital landscape. In order to maintain the required transparency and the uninterrupted performance of all our systems, we needed a powerful network monitoring tool. For us, the most important selection criteria were price-performance ratio and ease of use. PRTG met all our expectations and has proven to be an indispensable part of our network management.”

Daniel Baumgartner, Network Administrator
Volkswind

Your XenServer virtual machine monitor at a glance – even on the go

PRTG is set up in a matter of minutes and can be used on a wide variety of mobile devices.

device overview
Gartner peer insights

“Excellent tool for detailed monitoring. Alarms and notifications work greatly. Equipment addition is straight forward and server initial setup is very easy. ...feel safe to purchase it if you intend to monitor a large networking landscape.”

Read the complete review at Gartner Peer Insights

Create innovative solutions with Paessler’s IT partners

Partnering with innovative IT vendors, Paessler unleashes synergies to create
new and additional benefits for joined customers.

Rittal

Rittal

IT that works constitutes a business-critical basis for a company's success. Availability and security must be defined for the respective purpose and closely monitored – by OT and IT alike.

Read more
NetBrain

NetBrain

Integrating monitoring results from PRTG into NetBrain maps makes the foundation for network automation.

Read more
ScriptRunner

ScriptRunner

With ScriptRunner Paessler integrates a powerful event automation platform into PRTG Network Monitor.

Read more

Find the root cause of the problem with our PRTG XenServer monitoring solution

Real-time notifications mean faster troubleshooting so that you can act before more serious issues occur.

Free download
PRODUCT OVERVIEW
Paessler PRTG

Paessler PRTG

Network Monitoring Software – Version 24.4.102.1351 (November 12th, 2024)

Hosting icon

Hosting

Download for Windows and cloud-based version PRTG Hosted Monitor available

Languages icon

Languages

English, German, Spanish, French, Portuguese, Dutch, Russian, Japanese, and Simplified Chinese

test

Monitor everything

Network devices, bandwidth, servers, applications, virtual environments, remote systems, IoT, and more

test

Pricing

Choose the PRTG Network Monitor subscription that's best for you

Discover more monitoring insights and stories

Resources Solution

Solutions for all your monitoring needs

  • Citrix monitoring
  • PRTG's XEN Virtual Machine Monitor
  • Virtual machine monitoring
Resources Content

Powerful stories from the monitoring world

  • Customer success story Forsyth County Schools & PRTG
  • Customer success story Editions ENI & PRTG
  • Get more visibility of VMware ESXi: Metrics you should be monitoring
Resources Solutions

Resources to master your monitoring challenges

  • Citrix XenServer Host Sensor
  • Xen Server IOHandler Error
  • XenServer Pool Support

XenServer Monitoring: FAQ


What is Citrix XenServer?

Citrix XenServer is a hypervisor platform developed by Citrix Systems for managing and hosting virtual machines (VMs). It is based on the open-source Xen Project hypervisor and provides enterprise-grade features for virtualization. XenServer allows multiple virtual machines to run on a single physical server, enabling efficient resource utilization, scalability, and workload isolation.

What is XenServer monitoring, and why do I need it?

XenServer monitoring keeps tabs on the health, performance, and utilization of your entire Citrix XenServer setup – virtual machines, XenServer host, and all related Xen components. Collecting metrics on CPU usage, memory usage, disk I/O, and performance data in real time gives you complete visibility into resource allocation and usage. Spot issues early, ensure smooth authentication, confirm stable resource pools, and maintain robust functionality across the board.

Will PRTG slow my XenServer setup?

Not a chance. PRTG uses efficient data collection via HTTP, SNMP, and API calls to ensure low overhead. You'll gather performance metrics and performance data without hogging resources or affecting server speed, making your XenCenter environment faster, not slower.

How does PRTG help reduce downtime and optimize XenServer environments?

By monitoring Citrix hypervisor health and performance, PRTG catches hiccups early. Smart notifications pop up before critical failures, and you can quickly troubleshoot using collected performance metrics. This way, you'll quickly spot issues, fix them, and get back to a stable XenServer infrastructure.

What is a sensor in PRTG?

In PRTG, “sensors” are the basic monitoring elements. One sensor usually monitors one measured value in your network, for example the traffic of a switch port, the CPU load of a server, or the free space on a disk drive. On average, you need about 5-10 sensors per device or one sensor per switch port.

We asked: would you recommend PRTG? Over 95% of our customers say yes!

Paessler conducted trials in over 600 IT departments worldwide to tune its network monitoring software closer to the needs of sysadmins. The result of the survey: over 95% of the participants would recommend PRTG – or already have.

recommendation

Still not convinced?

Love

More than 500,000 sysadmins love PRTG

Paessler PRTG is used by companies of all sizes. Sysadmins love PRTG because it makes their job a whole lot easier.

PRTG

Monitor your entire IT infrastructure

Bandwidth, servers, virtual environments, websites, VoIP services – PRTG keeps an eye on your entire network.

test

Try Paessler PRTG for free

Everyone has different monitoring needs. That’s why we let you try PRTG for free.

PRTG Logo

Start monitoring Citrix XenServer with PRTG and see how it can make your network more reliable and your job easier.

Free download
PRODUCT OVERVIEW

Products

  • Paessler PRTG
    Paessler PRTGMonitor your whole IT infrastructure
    • PRTG Network Monitor
    • PRTG Enterprise Monitor
    • PRTG Hosted Monitor
  • PRTG extensions
    Extensions for Paessler PRTGExtend your monitoring to a new level
  • Icon Features
    FeaturesExplore all monitoring features

Monitoring with PRTG

  • Network monitoring
  • Bandwidth monitoring
  • SNMP monitoring
  • Network mapping
  • Wi-Fi monitoring
  • Server monitoring
  • Network traffic analyzer
  • NetFlow monitoring
  • Syslog server

Useful Links

  • PRTG Manual
  • Knowledge Base
  • Customer Success Stories
  • About Paessler
  • Subscribe to newsletter
  • PRTG Support
  • PRTG Consulting

Contact

Paessler GmbH
Thurn-und-Taxis-Str. 14, 
90411 Nuremberg 
Germany

info@paessler.com

+49 911 93775-0

  • Contact us
©2025 Paessler GmbHTerms & ConditionsPrivacy PolicyImprintReport VulnerabilityDownload & InstallSitemap
404 - Page not found 404 - Page not found 404 - Page not found