• Company
    • About Us
    • Case Studies
    • Press Center
    • Events
    • Careers
    • Blog
    • Contact us
  • Contact us
  • Login
 
  • English
    • Deutsch
    • Español
    • Français
    • Italiano
    • Português
Paessler
                    - The Monitoring Experts
  • Products
    • Paessler PRTG
      Paessler PRTGMonitor your whole IT infrastructure
      • PRTG Network Monitor
      • PRTG Enterprise Monitor
      • PRTG Hosted Monitor
      • PRTG extensionsExtensions for Paessler PRTGExtend your monitoring to a new level
    • Icon Features
      FeaturesExplore all monitoring features
      • Maps & dashboards
      • Alerts & notifications
      • Multiple user interfaces
      • Distributed monitoring
      • Customizable reporting
  • Solutions
    • Industries
      IndustriesMonitor various industry sectors
      • Industrial
      • Healthcare
      • Data Center
      • Education
      • Finance
      • Government
    • IT Topics
      IT TopicsMonitor all areas of IT
      • Network Monitoring
      • Bandwidth Monitoring
      • SNMP Monitor
      • Network Mapping
      • WiFi Monitoring
      • Server Monitoring
  • Pricing
  • Resources
    • Getting Started
      Getting StartedModules for self-paced learning
    • How-to Guides
      How-to GuidesGet the most out of PRTG
    • Videos & Webinars
      Videos & WebinarsLearn from Paessler experts
    • IT  Knowledge
      IT KnowledgeExpand your IT knowledge
    • PRTG Manual
      PRTG ManualFull documentation
    • Knowledge Base
      Knowledge BaseShare community knowledge
    • PRTG Sensor Hub
      PRTG Sensor HubGet sensors, scripts & templates
    • Trainings
      PRTG TrainingLearn how to work with PRTG
  • Partners
    • icon star
      New Partners and MSPBecome a new partner or MSP
    • icon partner
      Partner PortalLog in to your partner account
    • icon search
      Find a PartnerFind partners selling Paessler products
    • icon technology
      Technology AlliancesSee Paessler technology partnerships
  • Company
    • About Us
    • Case Studies
    • Press Center
    • Events
    • Careers
    • Blog
    • Contact us
  • Contact us
  • Login
  • English
    • Deutsch
    • Español
    • Français
    • Italiano
    • Português
  • Get a quote
  • Free trial
  1. Home>
  2. IT Topics>
  3. Technology>
  4. LDAP Monitoring
PRTG Logo

LDAP Monitoring with PRTG

Increase the availability of your directory servers, applications, and services

  • Continuously monitor your directory services using LDAP
  • Quickly detect and resolve critical performance issues
  • Set up in minutes with preconfigured or custom sensors
Free download
product overview

Our users give top ratings for monitoring with Paessler PRTG

Gartner peer insights
spiceworks
Capterra
G2
Trustpilot

PRTG LDAP monitoring: What you will find on this page

Table of content
  • Maintain the reliability & performance of your LDAP servers with PRTG
  • What LDAP server observability looks like in PRTG
  • How monitoring via LDAP works
  • Explore our preconfigured PRTG sensors for LDAP monitoring
  • 3 simple reasons PRTG is the best LDAP monitoring solution
  • LDAP Monitoring: FAQ

PRTG makes LDAP monitoring as easy as it gets

Custom alerts and data visualization let you quickly identify and prevent low performance and downtimes of your directory servers and services.

Free download
PRODUCT OVERVIEW

Maintain the reliability & performance of your LDAP servers with PRTG

LDAP (Lightweight Directory Access Protocol) is typically used to authenticate user accounts and users, for example the employees of a company. With LDAP monitoring, however, the focus isn’t so much on the LDAP protocol but on the status of LDAP servers. With Paessler PRTG, you can keep an eye on all key parameters of your directory servers.

Icon Boost

Availability monitoring

When response times are too high and uptime too low, access to data becomes painstakingly slow – or even nonexistent. This not only causes headaches for users, but also reduces the productivity of your business. Avoid downtime and network crashes by using LDAP monitoring with PRTG.

Icon CPU

Performance monitoring

Set up PRTG to monitor CPU usage, memory, and disk usage on the LDAP server to ensure it has enough resources to handle requests efficiently. Make sure that your hardware performs at its best by quickly detecting and resolving critical performance issues to enhance user experience.

Icon Lock

Security monitoring

Always have an eye on your log files for better access control over your LDAP directory, including failed login attempts. PRTG comes with a wealth of historical data that you can analyze in detail to identify unauthorized access attempts or unusual patterns of activity.

What LDAP server observability looks like in PRTG

Diagnose network issues by continuously tracking the availability, health, and performance of your LDAP server. Show detailed information about response times, CPU load, bandwidth usage, network traffic, and other key metrics in real time. Visualize monitoring data in clear graphs and dashboards to identify problems more easily. Gain the overview you need to troubleshoot slow authentication workflows, faulty LDAP configs, server downtimes, and other issues.

PRTG Screenshot device tree view

Device tree view of the complete monitoring setup

PRTG screenshot map entire it infrastructure

Custom PRTG dashboard for keeping an eye on the entire IT infrastructure

PRTG screenshot graph live data traffic

Live traffic data graph in PRTG

Start monitoring LDAP servers with PRTG and see how it can make your network more reliable and your job easier.

Free download
PRODUCT OVERVIEW

IT experts agree: Paessler PRTG is a great solution for IT infrastructure monitoring

PCMag

“All-around winning
 network monitor”

IT Brief

“The real beauty of PRTG is the endless possibilities it offers”

ITPro

“PRTG Network Monitor 
is very hard to beat”

How monitoring via LDAP works

Icon Sensor

Out-of-the-box monitoring

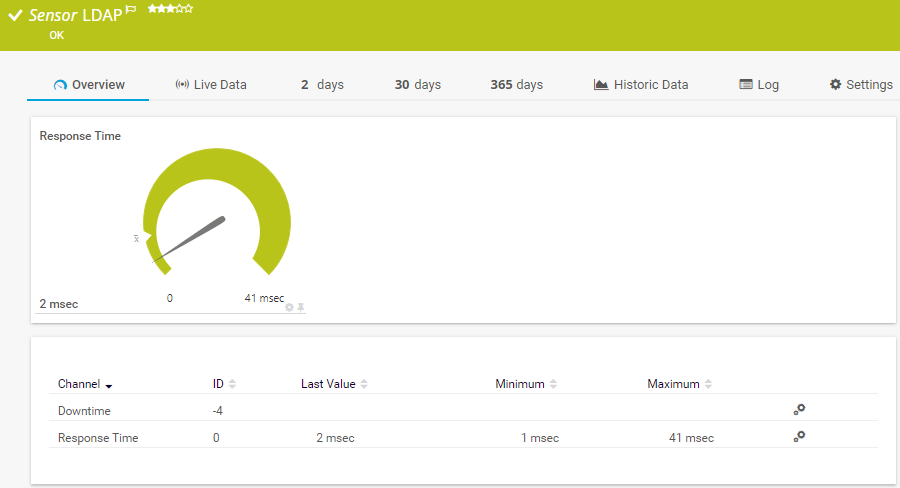
PRTG comes equipped with an LDAP sensor that connects to the LDAP server (or directory) and measures the response time. This connection is called a “bind” operation, which means a login to the LDAP server using the “bind” command.

Icon Alarm

Proactive troubleshooting

If the server stops responding (or the response time exceeds a predefined threshold), PRTG immediately sends you an alert. This allows you to quickly fix the problem before your network crashes by allocating resources more efficiently, for example with advanced load balancing.

Explore our preconfigured PRTG sensors for LDAP monitoring

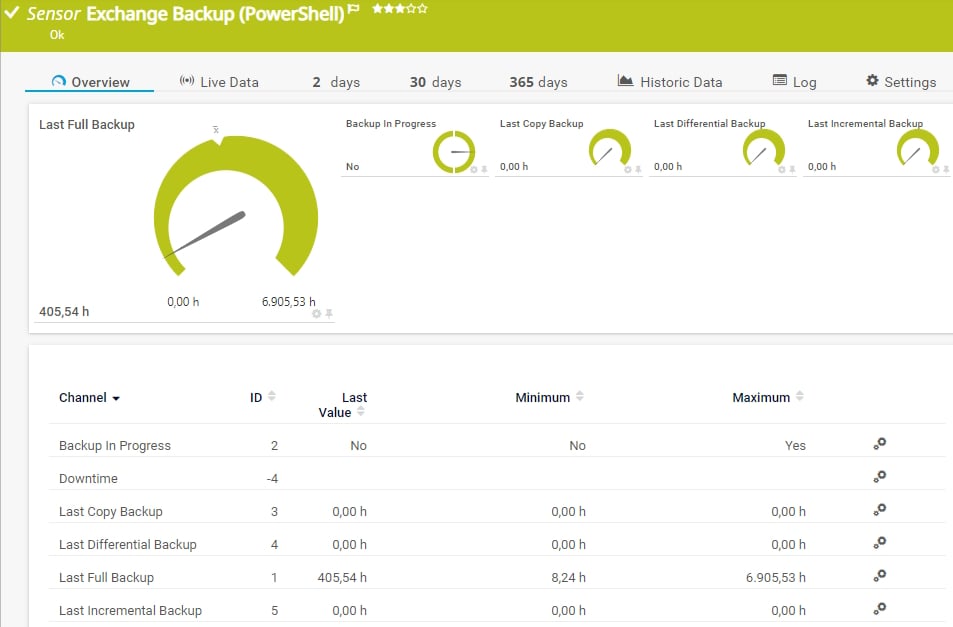
PRTG comes with more than 250 native sensor types for monitoring your entire on-premises, cloud, and hybrid cloud environment out of the box. Check out some examples below!

LDAP

The LDAP sensor monitors directory services via the Lightweight Directory Access Protocol (LDAP). It connects to the server by trying a "bind". It can show the following:

  • Downtime
  • Response time
LDAP
LDAP

Active Directory Replication Errors

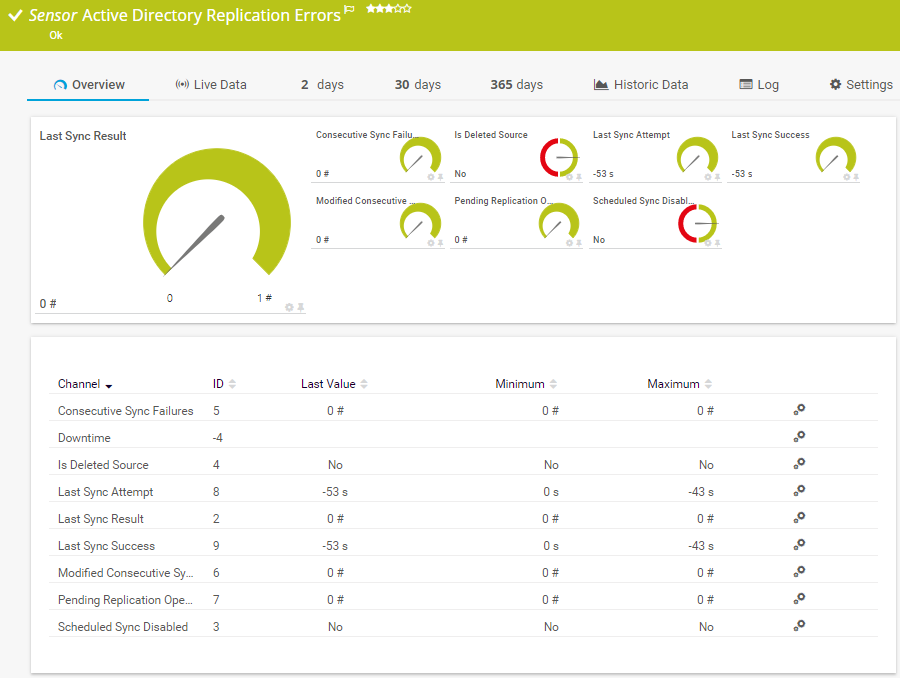
The Active Directory Replication Errors sensor checks a Windows domain controller (DC) for replication errors. It can show the following:

  • Number of (modified) consecutive synchronization failures
  • If the source is deleted or if the scheduled synchronization is disabled
  • Time of the last synchronization attempt and synchronization success
  • Number of pending replication operations
  • Result of the last synchronization
Active Directory Replication Errors

Event Log (Windows API)

The Event Log (Windows API) sensor monitors event log entries via the Windows API. It can show the following:

  • Downtime
  • Number of new records
Exchange Backup (PowerShell)

See the PRTG Manual for a list of all available sensor types.

Find the root cause of the problem with our PRTG LDAP monitoring solution

Real-time notifications mean faster troubleshooting so that you can act before more serious issues occur.

Free download
PRODUCT OVERVIEW

PRTG is compatible with all major vendors, products, and systems

compatible with all major vendors, products, and systems

3 simple reasons PRTG is the best LDAP monitoring solution

PRTG is a network monitoring tool that works great in distributed networks for the precise monitoring of mail servers, web servers, database servers, virtual servers, and LDAP servers.

Icon devices

PRTG monitors your entire IT infrastructure

PRTG monitors your network traffic, applications, bandwidth, cloud services, databases, virtual environments, availability & uptime, ports, IP addresses, hardware status, network security, web services, and much more.

Icon support

PRTG supports all important technologies

Monitor your network with PRTG via SNMP, flow (NetFlow, jFlow, sFlow, IPFIX), SSH, WMI, SQL, or ping. PRTG also supports technologies used in industrial IT, such as OPC UA, MQTT, or Modbus. Use the powerful PRTG API for custom integrations (for example via Python, PowerShell, or REST).

Icon click

PRTG can be used for any operating system

Download and install PRTG on a Windows system (or Linux with the new multi-platform probe), or use our cloud-based product for any operating system. Our native PRTG desktop application runs on Windows or macOS for even quicker access and multi-server views.

“We strive to equip our systems with state-of-the-art technology to safeguard our educational practices for the future. Part of this includes ensuring that all our systems run smoothly at all times. On any given day, we rarely have time to keep an eye on all our systems. We therefore decided to monitor our school’s IT environment with a centralized network monitoring tool.”

Stefan Roschewitz, IT administrator
BBS Holzminden

“We want to include the tool in our set of solutions in order to solve problems more proactively in our technology infrastructure. PRTG has exceeded all our expectations because it is a reliable, extremely easy-to-use solution. There is no doubt that it lives up to the renowned quality of German technology.”

Esbin Saúl Lázaro García, IT Infrastructure and Security Engineer
Hospital El Pilar

“The reactivity, know-how, and technical solutions of Paessler are outstanding in every situation. For me, no monitoring tool compares to PRTG.”

Andreas Reimann, Senior Networking Communication Architect
Zurich Airport

Your LDAP monitor at a glance – even on the go

PRTG is set up in a matter of minutes and can be used on a wide variety of mobile devices.

device overview
Gartner peer insights

“Excellent tool for detailed monitoring. Alarms and notifications work greatly. Equipment addition is straight forward and server initial setup is very easy. ...feel safe to purchase it if you intend to monitor a large networking landscape.”

Read the complete review at Gartner Peer Insights

Create innovative solutions with Paessler’s IT partners

Partnering with innovative IT vendors, Paessler unleashes synergies to create
new and additional benefits for joined customers.

IP Fabric

IP Fabric

Combining PRTG’s broad monitoring feature set with IP Fabric’s automated network assurance creates a new level of network visibility and reliability.

Read more
Martello

Martello 

By integrating PRTG with Martello iQ, you can add a fast analytics layer to improve uptime, visualize your IT environment, and integrate all of your IT systems into a single pane of glass.

Read more
UVnetworks

UVnetworks

UVexplorer integrates tightly with PRTG to bring fast and accurate network discovery, detailed device inventory, and automatic network mapping to the PRTG platform.

Read more

Find the root cause of the problem with our PRTG LDAP monitoring solution

Real-time notifications mean faster troubleshooting so that you can act before more serious issues occur.

Free download
PRODUCT OVERVIEW
Paessler PRTG

Paessler PRTG

Network Monitoring Software – Version 25.2.106.1114 (May 05th, 2025)

Hosting icon

Hosting

Download for Windows and cloud-based version PRTG Hosted Monitor available

Languages icon

Languages

English, German, Spanish, French, Portuguese, Dutch, Russian, Japanese, and Simplified Chinese

test

Monitor everything

Network devices, bandwidth, servers, applications, virtual environments, remote systems, IoT, and more

test

Pricing

Choose the PRTG Network Monitor subscription that's best for you

Discover more monitoring insights and stories

Resources Solution

Solutions for all your monitoring needs

  • Active Directory monitoring
  • Active Directory auditing
  • Server monitoring
Resources Content

Powerful stories from the monitoring world

  • All you need to know about PRTG Release 20.1.57 (and some additional updates…)
  • PRTG version 20.2.58 includes PRTG Enterprise Console remover
  • Active Directory - Definition and Details
Resources Solutions

Resources to master your monitoring challenges

  • LDAP Sensor
  • Secure LDAP monitoring with PRTG
  • Monitor SSL LDAP Certificate

LDAP Monitoring: FAQ


What is LDAP?

LDAP (Lightweight Directory Access Protocol) is a simple network protocol for accessing directories. It is the only protocol that allows for communication between an LDAP client and a directory server. By monitoring your LDAP server, you’ll be able to make sure this communication is always running smoothly.

A “directory server” is an LDAP server or a computer that provides a directory service such as Microsoft Active Directory. The LDAP protocol refers to a data structure that is created in accordance with the specifications of LDAP. The current LDAP version is LDAPv3.

How does LDAP work?

In practice, the communication between the client and server goes like this: An LDAP protocol is used to query (and store) information inside an LDAP directory. This information usually includes data on users, PCs, and the certificates of a computer. Two default ports are used here:

  • Port 389 for the unsecured transfer of data
  • Port 636 for the transfer of data secured by SSL/TLS
Which network components support LDAP?

LDAP is an industry-standard authentication and authorization protocol. As a result, every corporate network is likely to have at least one LDAP server whose information should be monitored. Pretty much every endpoint that deals with user data in some form or another supports the LDAP protocol:

  • Address data management software such as Outlook and Thunderbird
  • User management software such as Microsoft Active Directory Service and Apple Open Directory
  • Authentication solutions (e.g., Privileged Access Management)
  • User data management solutions for SMTP, POP, and IMAP servers
How do I set up LDAP server monitoring with PRTG?

PRTG comes with a predefined LDAP sensor for monitoring LDAP servers. This sensor is certified as compatible with Microsoft products based on LDAP. It also works with LDAP integrations from other providers in a non-certified capacity.

Setting up the LDAP Sensor is quick and easy. When adding the sensor for the first time, you can select or define your LDAP monitoring settings.

  1. Create a name for the sensor and (if necessary) tags to improve data classification.
  2. Choose a secure (SSL) or unsecure connection to the LDAP server.
  3. Choose between the default ports 389 and 636 or a different port defined by you.
  4. Specify the DN (distinguished name).
  5. Enter the password for the DN (to authenticate the LDAP server).
  6. Specify the settings for the scanning intervals, monitoring schedules, and more.

Note: If you opt for a secure (SSL/TLS) connection, then the sensor will require a DNS name in the settings of the parent device for the configuration. The sensor only supports the IPv4 protocol and has a moderate impact on performance.

What is a sensor in PRTG?

In PRTG, “sensors” are the basic monitoring elements. One sensor usually monitors one measured value in your network, for example the traffic of a switch port, the CPU load of a server, or the free space on a disk drive. On average, you need about 5-10 sensors per device or one sensor per switch port.

We asked: would you recommend PRTG? Over 95% of our customers say yes!

Paessler conducted trials in over 600 IT departments worldwide to tune its network monitoring software closer to the needs of sysadmins. The result of the survey: over 95% of the participants would recommend PRTG – or already have.

recommendation

Still not convinced?

Love

More than 500,000 sysadmins love PRTG

Paessler PRTG is used by companies of all sizes. Sysadmins love PRTG because it makes their job a whole lot easier.

PRTG

Monitor your entire IT infrastructure

Bandwidth, servers, virtual environments, websites, VoIP services – PRTG keeps an eye on your entire network.

test

Try Paessler PRTG for free

Everyone has different monitoring needs. That’s why we let you try PRTG for free.

PRTG Logo

Start monitoring LDAP servers with PRTG and see how it can make your network more reliable and your job easier.

Free download
PRODUCT OVERVIEW

Products

  • Paessler PRTG
    Paessler PRTGMonitor your whole IT infrastructure
    • PRTG Network Monitor
    • PRTG Enterprise Monitor
    • PRTG Hosted Monitor
  • PRTG extensions
    Extensions for Paessler PRTGExtend your monitoring to a new level
  • Icon Features
    FeaturesExplore all monitoring features

Monitoring with PRTG

  • Network monitoring
  • Bandwidth monitoring
  • SNMP monitoring
  • Network mapping
  • Wi-Fi monitoring
  • Server monitoring
  • Network traffic analyzer
  • NetFlow monitoring
  • Syslog server

Useful Links

  • PRTG Manual
  • Knowledge Base
  • Customer Success Stories
  • About Paessler
  • Subscribe to newsletter
  • PRTG Support
  • PRTG Consulting

Contact

Paessler GmbH
Thurn-und-Taxis-Str. 14, 
90411 Nuremberg 
Germany

info@paessler.com

+49 911 93775-0

  • Contact us
©2025 Paessler GmbHTerms & ConditionsPrivacy PolicyImprintReport VulnerabilityDownload & InstallSitemap
Application Application Application