• Company
    • About Us
    • Case Studies
    • Press Center
    • Events
    • Careers
    • Blog
    • Contact us
  • Login
 
  • English
    • Deutsch
    • Español
    • Français
    • Italiano
    • Português
Paessler
                    - The Monitoring Experts
  • Products
    • Paessler PRTG
      Paessler PRTGMonitor your whole IT infrastructure
      • PRTG Network Monitor
      • PRTG Enterprise Monitor
      • PRTG Hosted Monitor
      • PRTG extensionsExtensions for Paessler PRTGExtend your monitoring to a new level
    • Icon Features
      FeaturesExplore all monitoring features
      • Maps & dashboards
      • Alerts & notifications
      • Multiple user interfaces
      • Distributed monitoring
      • Customizable reporting
  • Solutions
    • Industries
      IndustriesMonitor various industry sectors
      • Industrial
      • Healthcare
      • Data Center
      • Education
      • Finance
      • Government
    • IT Topics
      IT TopicsMonitor all areas of IT
      • Network Monitoring
      • Bandwidth Monitoring
      • SNMP Monitor
      • Network Mapping
      • WiFi Monitoring
      • Server Monitoring
  • Pricing
  • Resources
    • Getting Started
      Getting StartedModules for self-paced learning
    • How-to Guides
      How-to GuidesGet the most out of PRTG
    • Videos & Webinars
      Videos & WebinarsLearn from Paessler experts
    • IT  Knowledge
      IT KnowledgeExpand your IT knowledge
    • PRTG Manual
      PRTG ManualFull documentation
    • Knowledge Base
      Knowledge BaseShare community knowledge
    • PRTG Sensor Hub
      PRTG Sensor HubGet sensors, scripts & templates
    • Trainings
      PRTG TrainingLearn how to work with PRTG
  • Partners
    • icon star
      New Partners and MSPBecome a new partner or MSP
    • icon partner
      Partner PortalLog in to your partner account
    • icon search
      Find a PartnerFind partners selling Paessler products
    • icon technology
      Technology AlliancesSee Paessler technology partnerships
  • Company
    • About Us
    • Case Studies
    • Press Center
    • Events
    • Careers
    • Blog
    • Contact us
  • Login
  • English
    • Deutsch
    • Español
    • Français
    • Italiano
    • Português
  • Get a quote
  • Free trial
  1. Home>
  2. IT Topics>
  3. Application>
  4. Active Directory Auditing
PRTG Logo

Active Directory Auditing with PRTG

Enhance security with actively auditing Active Directory events

  • Monitor and take control of Active Directory audit events
  • Be notified of changes to group memberships or logged-in Active Directory users
  • Watch for changes to service accounts and Windows security policies
Free download
product overview

Our users give top ratings for monitoring with Paessler PRTG

Gartner peer insights
spiceworks
Capterra
G2
Trustpilot

PRTG active directory auditing: What you will find on this page

Table of content
  • Why PRTG is the Active Directory auditing tool of your choice
  • What Active Directory auditing looks like in PRTG
  • 3 use cases of PRTG Active Directory auditing
  • Auditing Active Directory: FAQ

PRTG makes Active Directory auditing as easy as it gets

Custom alerts and data visualization let you quickly identify and prevent Active Directory security and replication issues. 

Free download
PRODUCT OVERVIEW

Why PRTG is the Active Directory auditing tool of your choice

Icon key

Enhance network security

Make sure that no AD event in your Active Directory environment goes unnoticed: Active Directory auditing can track and log user access attempts to network resources regardless of whether the attempt is legitimate, accidental, or malicious.

As soon as matching event IDs are written to the Security Event Log, Paessler PRTG detects them.

Icon alarm

Be notified in real time

Set custom warning and/or error thresholds for the sensors monitoring your Active Directory events. As soon as these thresholds are breached, PRTG notifies you via SMS, email, push notification, and other methods.

This way, you can rest assured that if PRTG doesn’t sound the alarm, everything’s running as expected.

Icon monitor dashboard

Analyze historical data

Keep track of your Active Directory events with PRTG’s wealth of historical monitoring data. Instead of going through tons of AD log data, you can zoom in on the events that really matter. With PRTG, you can also easily generate custom reports for in-depth data analysis or get a more high-level view for the management team.

What Active Directory auditing looks like in PRTG

Diagnose network issues by continuously tracking Active Directory events. Show AD replication errors, changes to AD groups that can indicate a network security issue, and other key metrics in real time. Visualize monitoring data in clear graphs and dashboards to identify problems more easily. Gain the overview you need to troubleshoot your entire Active Directory domain.

prtg-screenshot-map-ms-nutanix-vmware
PRTG Screenshot device tree view

Device tree view of the complete monitoring setup

PRTG screenshot map entire it infrastructure

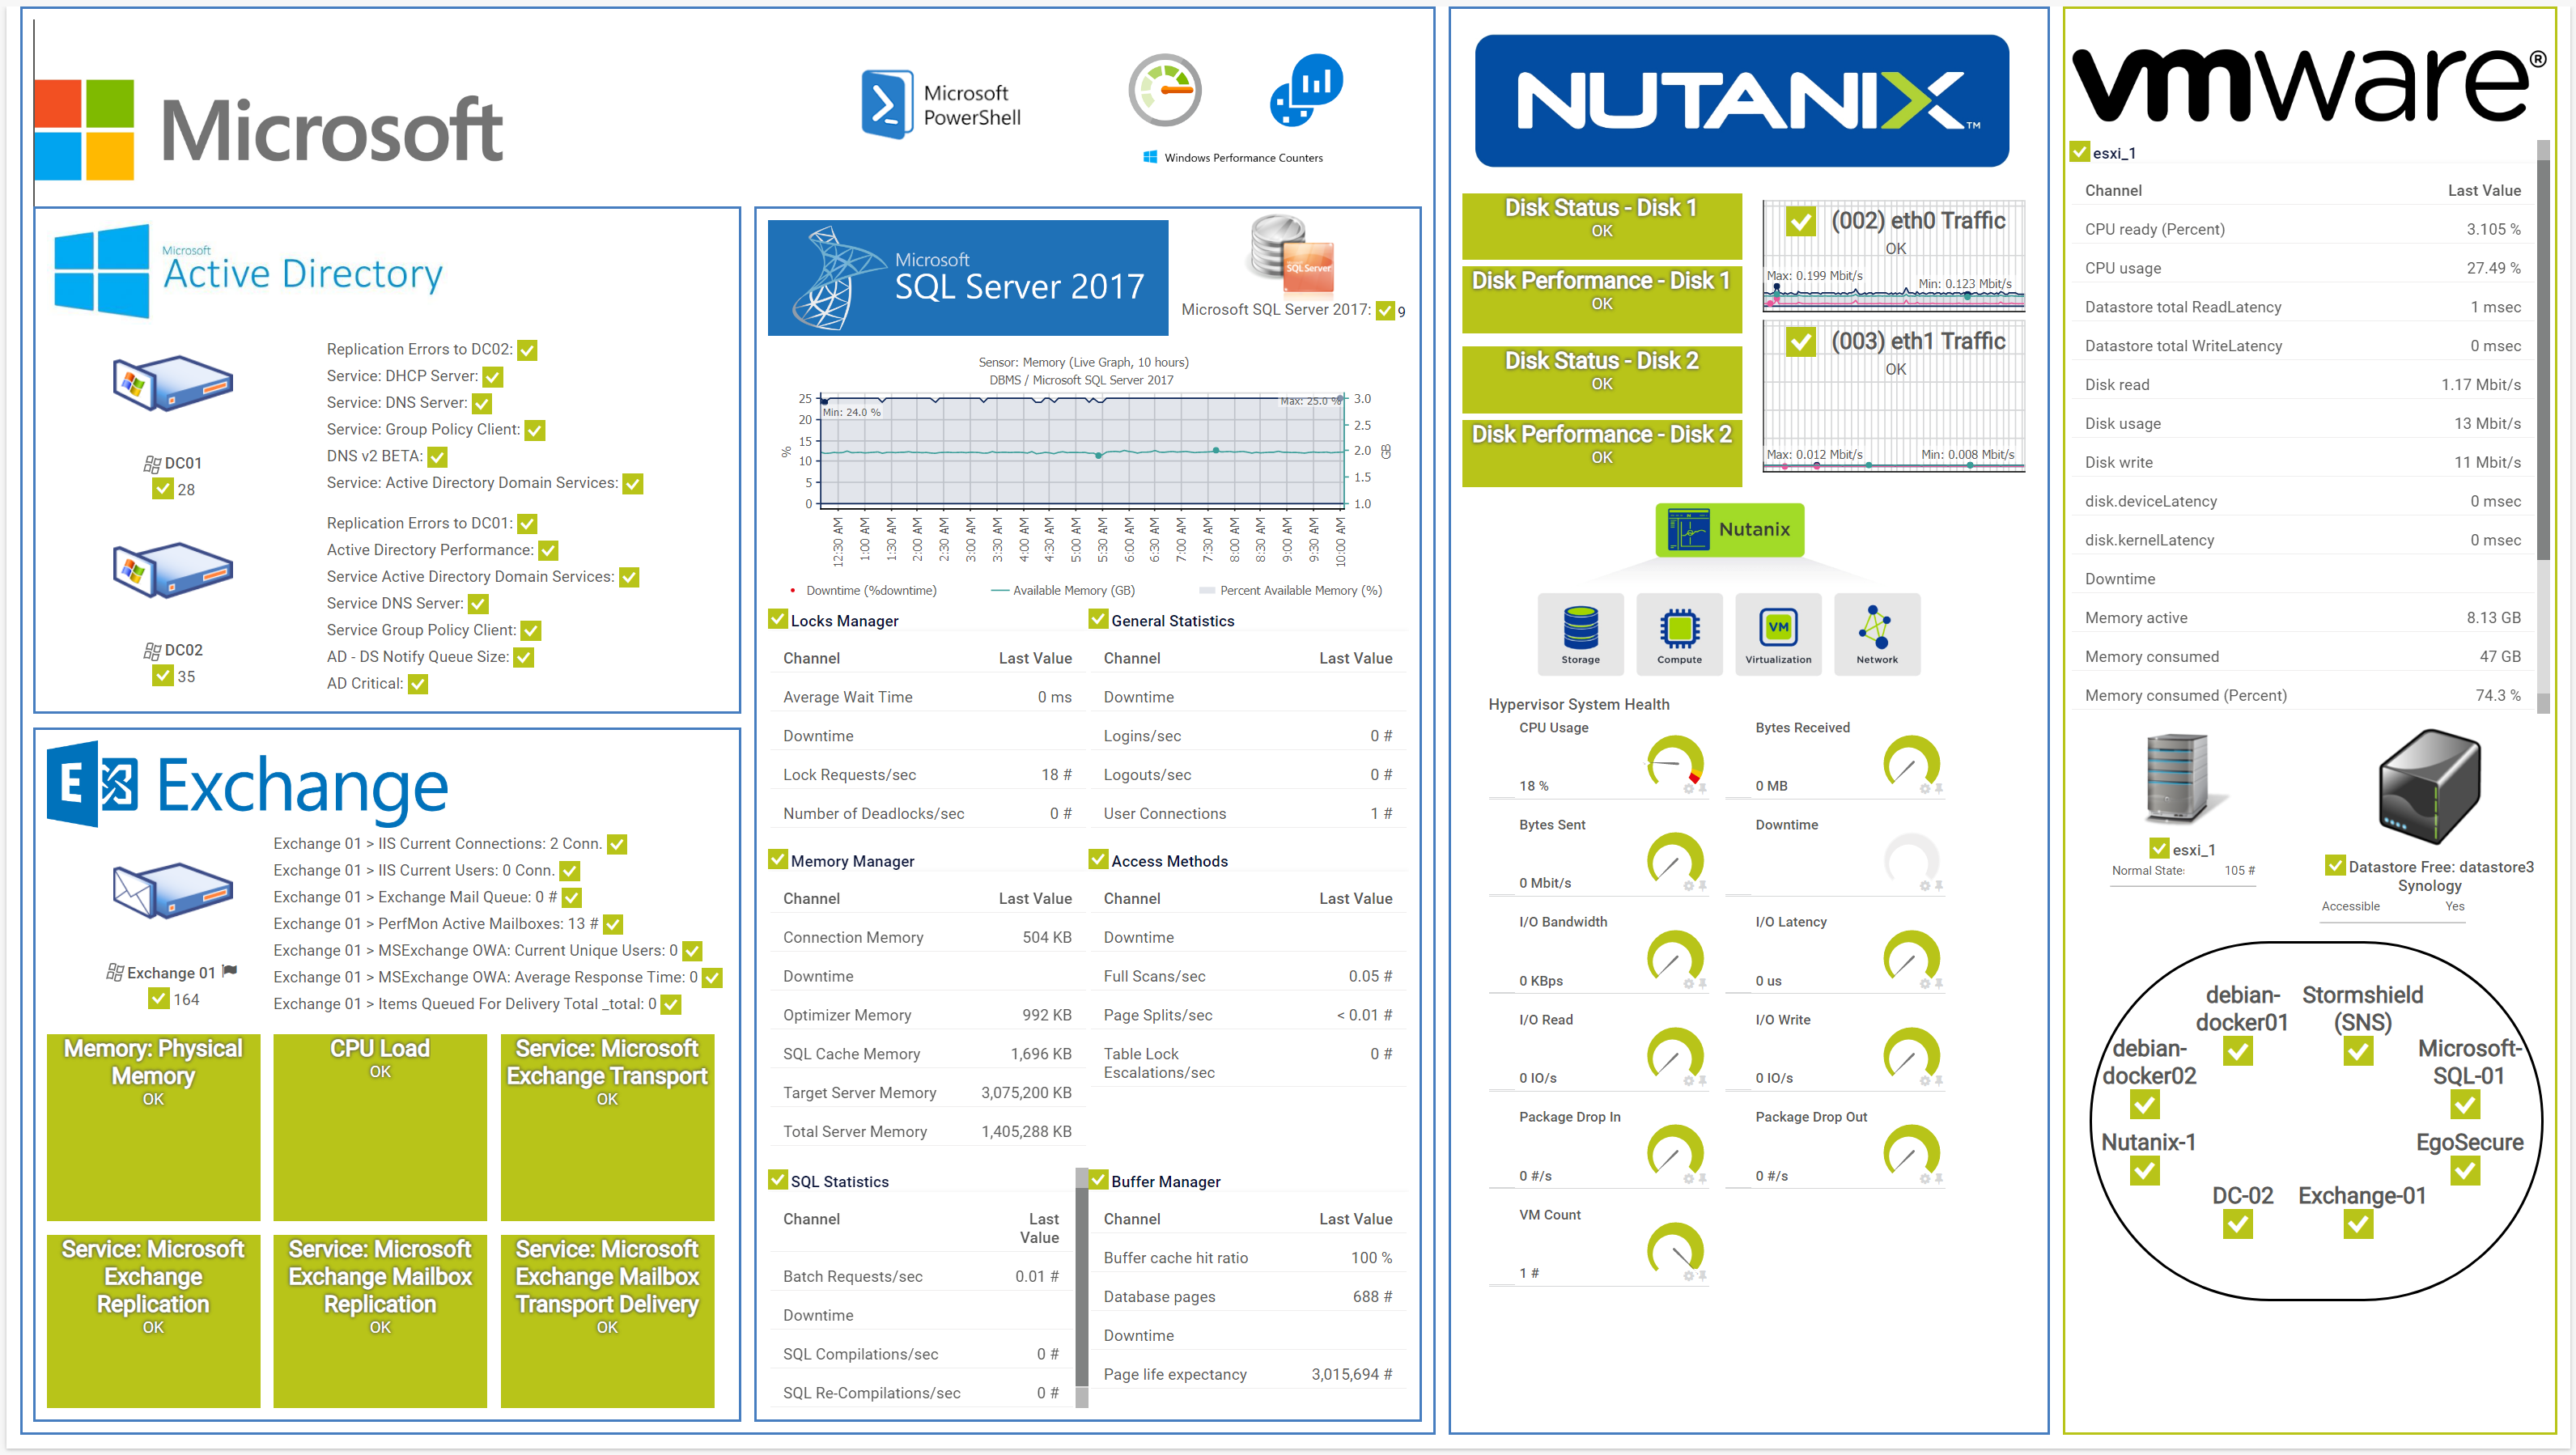
Custom PRTG dashboard for keeping an eye on the entire IT infrastructure

PRTG screenshot graph live data traffic

Live traffic data graph in PRTG

Start AD auditing with PRTG and see how it can make your network more reliable and your job easier.

Free download
PRODUCT OVERVIEW

IT experts agree: Paessler PRTG is a great solution for IT infrastructure monitoring

PCMag

“All-around winning
 network monitor”

IT Brief

“The real beauty of PRTG is the endless possibilities it offers”

ITPro

“PRTG Network Monitor 
is very hard to beat”

3 use cases of PRTG Active Directory auditing

Icon protection

Prevent Active Directory replication errors

The replication of directory data between various domain controllers can be prone to error. In turn, the resulting errors can cause problems with authentication and with access control.

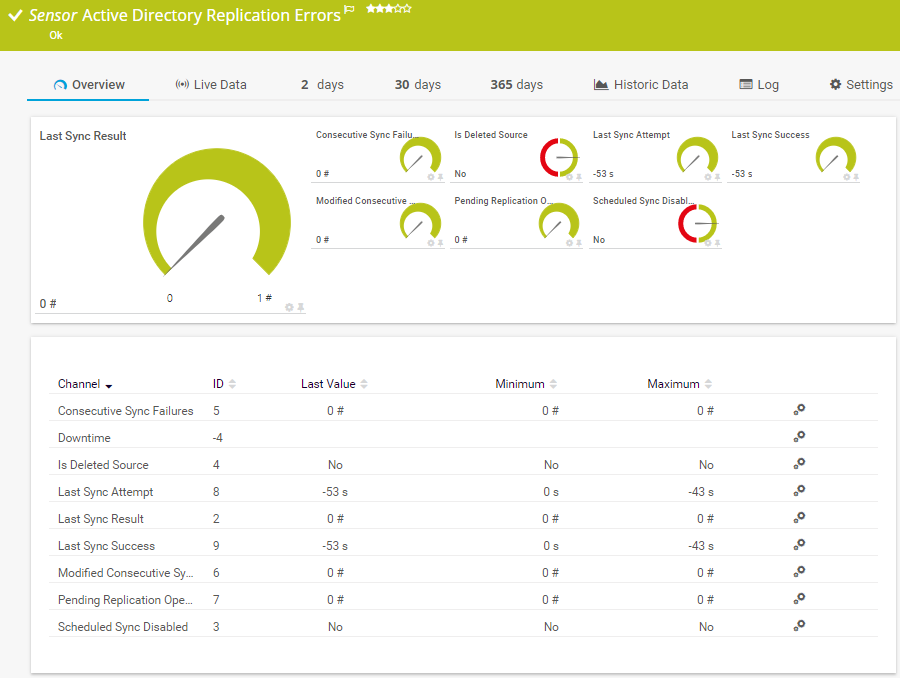
The preconfigured Active Directory Replication Errors v2 sensor monitors different parameters during the replication of directories and the synchronization of the various domain controllers, including the number of consecutive synchronization failures, pending replication operations, and the time of the last synchronization attempt.

Icon user

Identify logged-out & deactivated users

Maintaining an overview of logged-out or deactivated users is nearly impossible with standard AD tools.

With PRTG, you get a ready-to-use script for the EXE/Script Advanced sensor, which searches the Active Directory for all logged-out and deactivated users, and then lists them in PRTG.

To use this script, PRTG requires the Active Directory PS module. With a Search-AD account, you can run the script with a number of different queries.

Icon user group

Monitor Active Directory group membership

Running a ready-to-use script for the EXE/Script Advanced sensor in PRTG, you can enumerate how many people are in a group and show an error status when the number of members exceeds the intended amount.

This way, you’ll always be notified if someone joins an AD group like Domain Admins.

For AD security audits, you can set up the preconfigured Event Log (Windows API) sensor watching the Windows Security Event Log for Active Directory changes to the Domain Admin Security Group.

Explore our preconfigured PRTG sensors for Active Directory auditing

PRTG comes with more than 250 native sensor types for monitoring your entire on-premises, cloud, and hybrid cloud environment out of the box. Check out some examples below!

Active Directory Replication Errors

The Active Directory Replication Errors sensor checks a Windows domain controller (DC) for replication errors. It can show the following:

  • Number of (modified) consecutive synchronization failures
  • If the source is deleted or if the scheduled synchronization is disabled
  • Time of the last synchronization attempt and synchronization success
  • Number of pending replication operations
  • Result of the last synchronization
Active Directory Replication Errors

Port v2

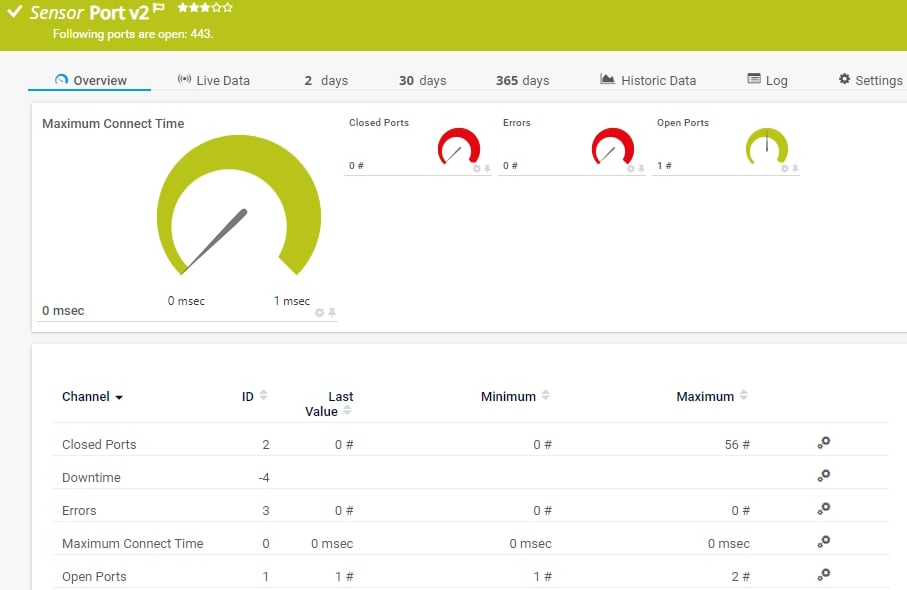
The Port v2 sensor monitors a network service by connecting to one or more of its TCP/IP ports. It can show the following:

  • Number of open and closed ports
  • Number of errors
  • Maximum time until a request to connect to a port was accepted
Port v2
Port v2

EXE/Script Advanced

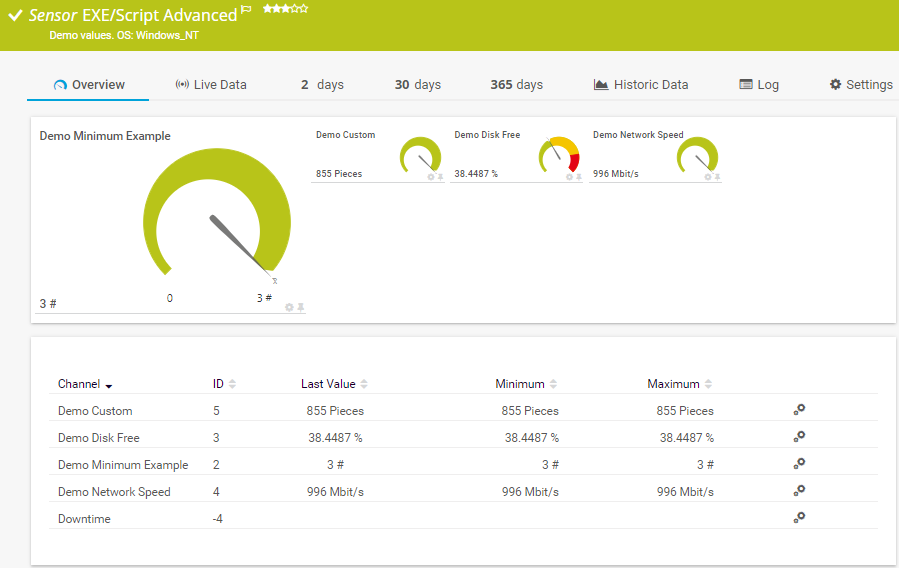
The EXE/Script Advanced sensor runs an executable file (.exe) or a script (batch file, VBScript, PowerShell) on the probe system. This option is available as part of the PRTG API. It can show the following:

  • Downtime
  • Value that the executable file or script file returns in several channels
EXE/Script Advanced
EXE/Script Advanced

Microsoft Azure Subscription Cost

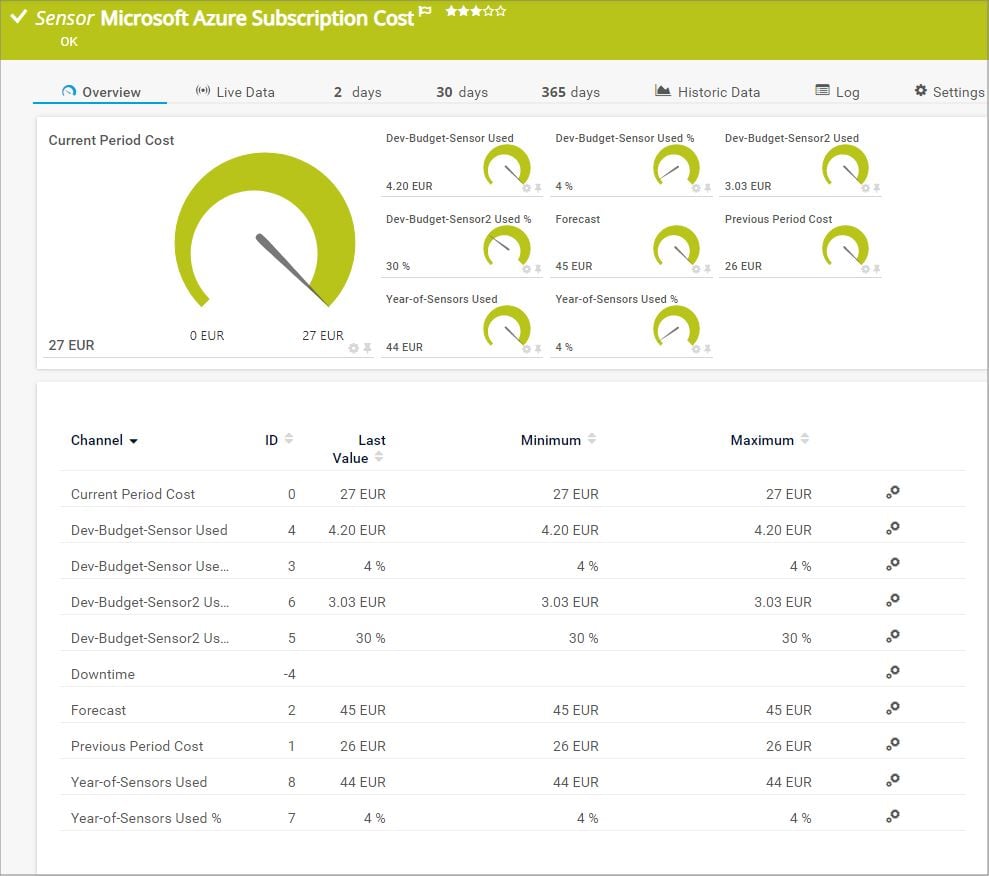
The Microsoft Azure Subscription Cost sensor monitors the cost in a Microsoft Azure subscription. It can show the following:

  • Current period cost
  • Cost forecast
  • Used budget
  • Previous period cost
Microsoft Azure Subscription Cost

See the PRTG Manual for a list of all available sensor types.

PRTG is compatible with all major vendors, products, and systems

compatible with all major vendors, products, and systems

Find the root cause of the problem with our PRTG Active Directory event auditing solution

Real-time notifications mean faster troubleshooting so that you can act before more serious issues occur.

Free download
PRODUCT OVERVIEW

“Since using PRTG, we have matured how we report out overall application uptime, maintenance, and mean time between failure for all critical applications to our board of directors. PRTG allows us to not just look at a single event, but to leverage historical data to prevent future failures and to measure how we are making improve­ments over time.”

Bill Sorrells, CTO
Dayton Children's Hospital

“We have found these sophisticated levels of monitoring to be highly effective, improving the end user’s experience of the systems and applications in use, giving us the opportunity to provide a proactive resolution rather than having the end user raise issues.”

Saif Akil, Head of Service Management
Acurus

“Before PRTG, applications and hardware all gave messages, but all separately, so we had to search through hundreds of e-mails to find the problem. It was always only afterwards that we saw that something was going on within the infrastructure. To mitigate the issue, we also considered other software. PRTG stood out because of its user-friendliness, flexibility and minimal consultancy investment.”

Wim Vandenberghe, ICT Manager
Soenen Golfkarton

Your Active Directory auditing at a glance – even on the go


Set up PRTG in minutes and use it on almost any mobile device.

device overview

Create innovative solutions with Paessler’s IT partners

Partnering with innovative IT vendors, Paessler unleashes synergies to create
new and additional benefits for joined customers.

Plixer

Plixer

Paessler and Plixer provide a complete solution adding flow and metadata analysis to a powerful network monitoring tool.

Read more
Rittal

Rittal

IT that works constitutes a business-critical basis for a company's success. Availability and security must be defined for the respective purpose and closely monitored – by OT and IT alike.

Read more
ScriptRunner

ScriptRunner

With ScriptRunner Paessler integrates a powerful event automation platform into PRTG Network Monitor.

Read more

PRTG makes Active Directory auditing as easy as it gets

Custom alerts and data visualization let you quickly identify and prevent Active Directory security and replication issues.

Free download
PRODUCT OVERVIEW
Paessler PRTG

Paessler PRTG

Network Monitoring Software – Version 24.4.102.1351 (November 12th, 2024)

Hosting icon

Hosting

Download for Windows and cloud-based version PRTG Hosted Monitor available

Languages icon

Languages

English, German, Spanish, French, Portuguese, Dutch, Russian, Japanese, and Simplified Chinese

test

Monitor everything

Network devices, bandwidth, servers, applications, virtual environments, remote systems, IoT, and more

test

Pricing

Choose the PRTG Network Monitor subscription that's best for you

Discover more monitoring insights and stories

Resources Solution

Solutions for all your monitoring needs

  • Active Directory monitoring
  • The monitoring solution for all areas of IT!
  • File integrity monitoring sotware PRTG
Resources Content

Powerful stories from the monitoring world

  • How to monitor Active Directory
  • Syslog - Definition and Details
  • Remote monitoring from the cloud: the future of our industry?
Resources Solutions

Resources to master your monitoring challenges

  • Monitor AD User Login/Logoff
  • Monitor failed logins via Event Viewer
  • Locked out AD user with device description the lockout occured

Active Directory Auditing: FAQ


What is the Active Directory?

Active Directory (AD) is a directory service created by Microsoft for use in a Windows Server environment. It provides authentication and authorization functions as well as a framework for other related services. The directory itself is an LDAP database that contains networked AD objects.

What is Active Directory auditing?

Active Directory auditing is the process of tracking and recording events that occur within an AD environment. This includes actions such as logins, changes to user accounts, access to files or resources, and administrative activities. Auditing helps organizations maintain security, compliance, and accountability by providing a detailed record of who did what, when, and from where within the network. Typical components of the audit process are audit policies, audit logs, and audit reports.

Why do I need an Active Directory auditing tool?

One of the many functions Active Directory serves is that of a gate keeper – controlling which users can use resources on the network, and their level of interaction with those resources. File shares, file servers, applications, internet access, printers: all depend on Active Directory to allow or deny access. This makes it vitally important for system administrators to keep track of how AD is protecting those resources.

Microsoft has included excellent audit facilities within AD. Log on/log off, object access, policy changes, account management, and many other activities all leave detailed records in the Windows Security Event Log. Unfortunately, even for only a small network, AD auditing can create huge numbers of log events, making it very difficult to keep track of the really important ones. Active Directory auditing tools like PRTG help you keep track of these events and alert you if something is not working as it should.

What security aspects does an Active Directory audit involve?

An Active Directory (AD) audit involves several critical security aspects to ensure the integrity, availability, and confidentiality of the AD environment. Here are some key security aspects typically involved in an AD audit

User account management

  • Account provisioning and de-provisioning: Ensure that user accounts are created, modified, and disabled according to established policies and that inactive accounts are promptly deactivated.
  • Privileged accounts: Audit the usage and management of privileged accounts to ensure they are used appropriately and are not over-privileged.

Password policies

  • Complexity requirements: Verify that password policies enforce complexity requirements to prevent weak passwords.
  • Expiration and rotation: Check that passwords are set to expire periodically and that users are required to change them regularly.
  • Account lockout: Ensure that account lockout policies are in place to prevent brute force attacks.

Group Policy Objects (GPOs)

  • Policy Configuration: Review GPOs to ensure they are configured according to security best practices and organizational policies.
  • Application and Scope: Ensure that GPOs are correctly applied and scoped to appropriate users and computers.

Access controls

  • Permissions and rights: Audit permissions on critical AD objects (e.g., organizational units, user accounts) to ensure they are set according to the principle of least privilege.
  • Role-based Access Control (RBAC): Verify that access is granted based on roles and responsibilities.

Auditing and logging

  • Event logging: Ensure that logging is enabled for critical AD activities, such as logon events, changes to AD objects, and administrative actions.
  • Log review: Regularly review and analyze logs for signs of suspicious or unauthorized activities.

Security configuration

  • Baseline security settings: Verify that the AD environment complies with baseline security settings and configurations.
  • Patch management: Ensure that AD servers and domain controllers are regularly updated with security patches.

Replication and availability

  • Replication health: Check the health and configuration of AD replication to ensure data consistency across all domain controllers.
  • Backup and recovery: Verify that backups of AD are taken regularly and that recovery procedures are tested.

Service accounts

  • Usage and management: Audit service accounts to ensure they are used appropriately and have the minimum necessary permissions.
  • Password management: Ensure that service account passwords are managed securely, with periodic changes and proper storage.

Security policies

  • Compliance: Ensure that AD policies comply with organizational and regulatory security requirements.
  • Policy Enforcement: Verify that security policies are enforced consistently across the AD environment.

Physical security

  • Domain controller security: Ensure that physical access to domain controllers is restricted and monitored.

Incident response

  • Monitoring and alerts: Ensure that there are mechanisms in place for detecting and responding to security incidents within the AD environment.
  • Incident handling procedures: Verify that there are clear procedures for handling security incidents involving AD.

Compliance and reporting

  • Regulatory requirements: Ensure that AD configurations and practices meet relevant regulatory and compliance requirements (e.g., GDPR, HIPAA).
  • Audit reporting: Generate and review reports to document compliance and identify areas for improvement.
Can PRTG monitor and audit only Active Directory?

No. PRTG is proprietary network monitoring software that lets you keep an eye on your entire IT infrastructure, including:

  • SSL monitoring: PRTG determines the extent to which your connections are protected. You can therefore learn if your connections are strong, weak, or not protected at all.
  • Ping monitoring: PRTG uses ping to check the availability of all your network devices. If the ping fails, you will be notified immediately.
  • QoS monitoring: Is your line choppy? Do your video calls keep getting dropped? If so, then you have a problem with your quality of service. PRTG lets you set up easy and effective QoS monitoring and monitor values such as latency and jitter.
  • Windows performance counter monitoring: Locate network bottlenecks, improve the performance of your system and applications, and get information on applications running on an IIS server using Windows performance counters.
  • Web server monitoring: PRTG can monitor the availability of your web servers, including CPU, memory, web server performance, load times, and more.
  • And much more
Can PRTG monitor Microsoft Entra ID (formerly Azure AD)?

If you use Microsoft Entra ID (formerly Azure AD) and want to keep an eye on what’s happening there, we’ve got you covered as well.

Set up, for example, a Microsoft Azure Subscription Cost sensor to keep your subscription costs in check. Or create a custom PRTG sensor for monitoring activities that might pose a risk:

  • Be informed about risky sign-ins, for example, from an unusual or suspicious country
  • Get alerts about impossible travel activities, for example, if an account logs in from Germany and two minutes later from Hongkong
  • Check for AD accounts that Microsoft believes are exposed to a risk
  • Keep an eye on new devices that are registered for Multi-Factor Authentication
What is a sensor in PRTG?

In PRTG, “sensors” are the basic monitoring elements. One sensor usually monitors one measured value in your network, for example the traffic of a switch port, the CPU load of a server, or the free space on a disk drive. On average, you need about 5-10 sensors per device or one sensor per switch port.

We asked: would you recommend PRTG? Over 95% of our customers say yes!

Paessler conducted trials in over 600 IT departments worldwide to tune its network monitoring software closer to the needs of sysadmins. The result of the survey: over 95% of the participants would recommend PRTG – or already have.

recommendation

Still not convinced?

Love

More than 500,000 sysadmins love PRTG

Paessler PRTG is used by companies of all sizes. Sysadmins love PRTG because it makes their job a whole lot easier.

PRTG

Monitor your entire IT infrastructure

Bandwidth, servers, virtual environments, websites, VoIP services – PRTG keeps an eye on your entire network.

test

Try Paessler PRTG for free

Everyone has different monitoring needs. That’s why we let you try PRTG for free.

PRTG Logo

Start auditing your Active Directory environment with PRTG and see how it can make your network more reliable and your job easier.

Free download
PRODUCT OVERVIEW

Products

  • Paessler PRTG
    Paessler PRTGMonitor your whole IT infrastructure
    • PRTG Network Monitor
    • PRTG Enterprise Monitor
    • PRTG Hosted Monitor
    • PRTG extensions
      Extensions for Paessler PRTGExtend your monitoring to a new level
  • Icon Features
    FeaturesExplore all monitoring features

Monitoring with PRTG

  • Network monitoring
  • Bandwidth monitoring
  • SNMP monitoring
  • Network mapping
  • Wi-Fi monitoring
  • Server monitoring
  • Network traffic analyzer
  • NetFlow monitoring
  • Syslog server

Useful Links

  • PRTG Manual
  • Knowledge Base
  • Customer Success Stories
  • About Paessler
  • Subscribe to newsletter
  • PRTG Support
  • PRTG Consulting

Contact

Paessler GmbH
Thurn-und-Taxis-Str. 14, 
90411 Nuremberg 
Germany

info@paessler.com

+49 911 93775-0

  • Contact us
©2025 Paessler GmbHTerms & ConditionsPrivacy PolicyImprintReport VulnerabilityDownload & InstallSitemap
404 - Page not found 404 - Page not found 404 - Page not found