Custom alerts and data visualization let you quickly identify and prevent disruptions, performance issues and network vulnerabilities.
Are you tired of discovering ICT problems after they have already affected your business? With PRTG you can move from reactive to proactive management of your entire infrastructure. Monitor all aspects of your ICT environment from a single dashboard and receive alerts before small problems become major disruptions.
Access all your monitoring data from one intuitive interface without having to switch between multiple tools. PRTG centralizes information from your network devices, servers, applications and IoT devices in one place. The customizable dashboards allow you to arrange the most important metrics according to your specific priorities and requirements.
Receive notifications about potential problems before they affect your operations or end users. PRTG monitors thresholds you define and sends alerts through various channels, including email, SMS or push notifications. The flexible alerting system helps you address problems immediately, even outside of normal business hours when critical incidents often occur.
Deploy over 300 pre-configured sensors to monitor every aspect of your ICT (Information and Communications Technology) infrastructure. PRTG includes sensors for standard protocols, specialized devices, cloud services and custom applications at no additional cost. The wide range of available sensors ensures complete coverage of your environment, regardless of its complexity or specific technologies.
Expand your monitoring capabilities as your business grows without replacing your existing solution. PRTG scales from small networks to enterprise environments with thousands of devices and maintains performance. The flexible licensing model allows you to add more sensors as needed without complicated procurement processes or unexpected costs.
Diagnose network issues by continuously tracking data flows, application response times and infrastructure health. Show traffic patterns and other key metrics in real time. Visualize monitoring data in clear graphs and dashboards to identify problems more easily. Gain the overview you need to troubleshoot service disruptions and network bottlenecks.

Device tree view of the complete monitoring setup

Custom PRTG dashboard for keeping an eye on the entire IT infrastructure

Live traffic data graph in PRTG
“All-around winning
network monitor”
“The real beauty of PRTG is the endless possibilities it offers”
“PRTG Network Monitor
is very hard to beat”
In complex ICT environments, problems arise around every corner. Servers crash without warning, network traffic spikes, security holes appear overnight, and critical applications slow to a crawl. When these problems occur simultaneously, your phone is ringing off the hook as you try to figure out what went wrong and where. Without the right monitoring tool, you're essentially flying blind.
Choose the exact monitoring capacity you need without overpaying for unused features. PRTG offers simple subscription options based on the number of sensors, rather than complicated feature tiers or device limitations. Adjust your license as your infrastructure grows to ensure you always have the right coverage without budget surprises.
Access knowledgeable assistance whenever you encounter challenges with your monitoring setup. PRTG is backed by Paessler engineers who understand the complexities of today's ICT environments and can respond quickly to your questions. The support team helps you maximize your monitoring investment by providing personalized guidance rather than generic troubleshooting scripts.
Monitor remote sites and branch offices from a central console without complex network configurations. Remote probes collect data locally and transmit it securely to your core installation, maintaining visibility across geographically dispersed locations. The distributed architecture reduces bandwidth consumption while providing a complete overview of your entire organization.
Focus on solving real problems instead of constantly tweaking your monitoring system. PRTG updates automatically and requires minimal administration compared to other enterprise monitoring solutions. The low-maintenance design means that you spend less time configuring alerts and more time on the critical issues those alerts help you to identify.
PRTG comes with more than 250 native sensor types for monitoring your entire on-premises, cloud, and hybrid cloud environment out of the box. Check out some examples below!
The SNMP Traffic v2 sensor monitors bandwidth and traffic on a device. It can show the following:
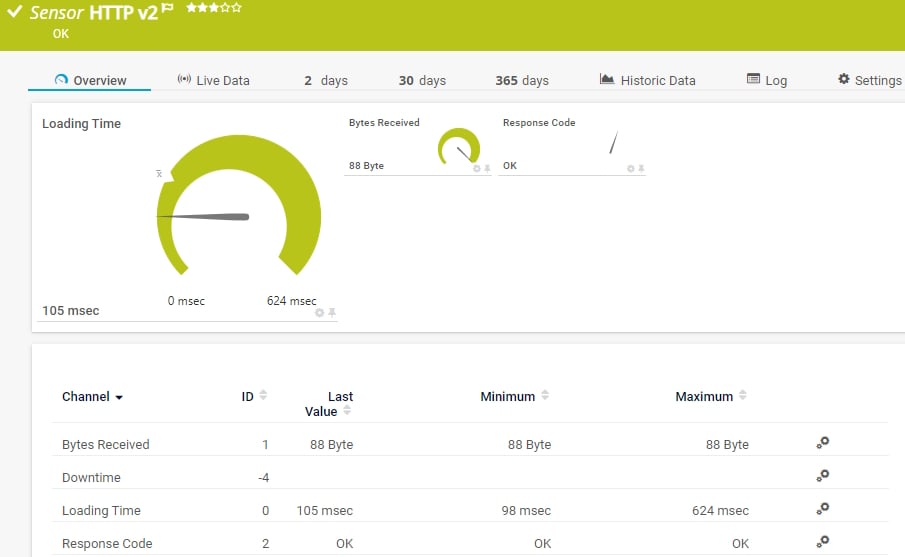
The HTTP v2 sensor monitors a web server. It can show the following:
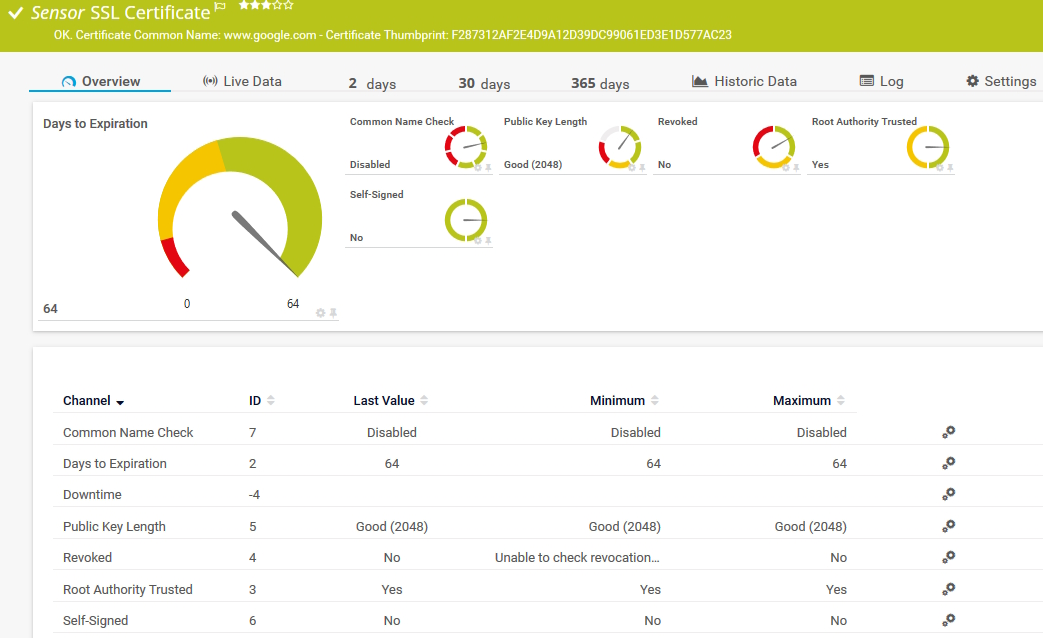
The SSL Certificate sensor monitors the certificate of a Secure Sockets Layer (SSL)/Transport Layer Security (TLS) secured connection. It can show the following:
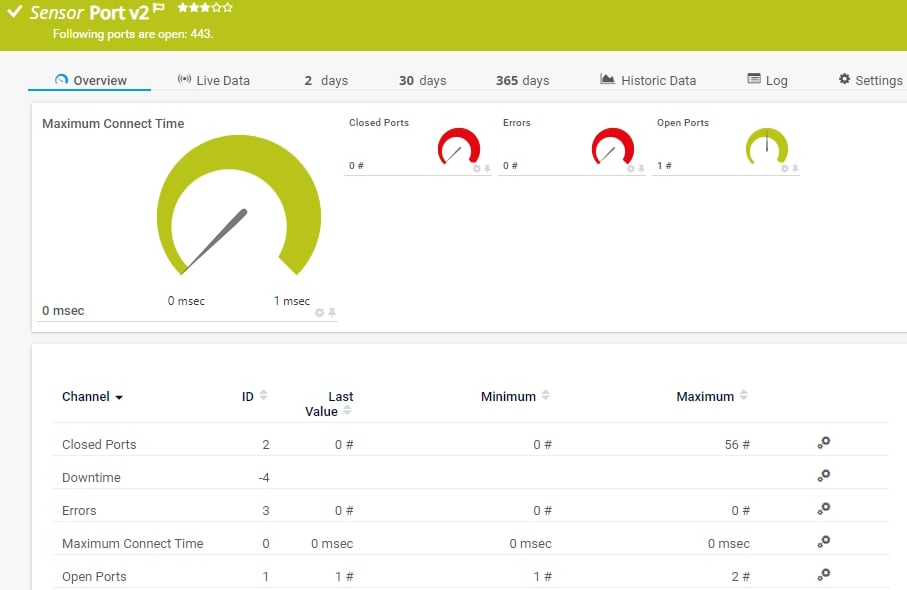
The Port v2 sensor monitors a network service by connecting to one or more of its TCP/IP ports. It can show the following:
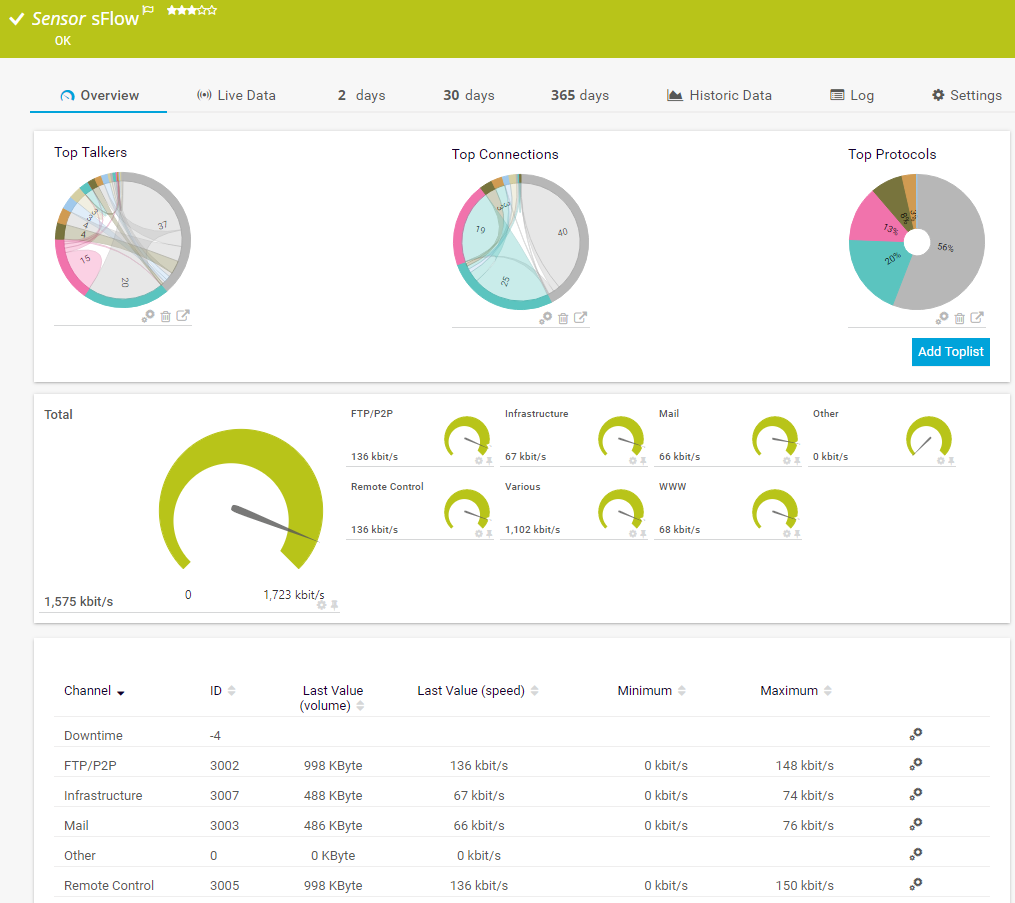
The sFlow sensor receives traffic data from an sFlow v5-compatible device and shows the traffic by type. This sensor has several filter options to divide traffic into different channels. It can show the following and more:
See the PRTG Manual for a list of all available sensor types.

Custom alerts and data visualization let you quickly identify and prevent XXX.
PRTG is set up in a matter of minutes and can be used on a wide variety of mobile devices.

Paessler achieved VMware's highest level of endorsement due to our technological excellence, leading market position, and superior compatibility with VMware products.
What does this mean for you?
Partnering with innovative IT vendors, Paessler unleashes synergies to create
new and additional benefits for joined customers.
baramundi and PRTG create a secure, reliable and powerful IT infrastructure where you have everything under control - from the traffic in your firewall to the configuration of your clients.
IT that works constitutes a business-critical basis for a company's success. Availability and security must be defined for the respective purpose and closely monitored – by OT and IT alike.
Combining PRTG’s broad monitoring feature set with IP Fabric’s automated network assurance creates a new level of network visibility and reliability.
Real-time notifications mean faster troubleshooting so that you can act before more serious issues occur.
Network Monitoring Software – Version 25.3.110.1313 (August 27, 2025)
Download for Windows and cloud-based version PRTG Hosted Monitor available
English, German, Spanish, French, Portuguese, Dutch, Russian, Japanese, and Simplified Chinese
Network devices, bandwidth, servers, applications, virtual environments, remote systems, IoT, and more
Choose the PRTG Network Monitor subscription that's best for you
An ICT monitoring tool tracks the performance, availability, and security of your information and communication technologies infrastructure. These solutions continuously observe network devices, servers, and applications to detect issues before they impact operations. Modern ICT monitoring platforms provide real-time alerts, detailed metrics, and dashboards that give you visibility into your entire technology stack. With proper monitoring, you can identify bottlenecks, prevent downtime, and maintain optimal user experience.
PRTG improves cybersecurity by monitoring for suspicious activity and vulnerabilities across your entire ICT infrastructure. Our solution integrates with intrusion detection systems to identify unauthorized access attempts in real-time. You can configure alerts for unusual traffic patterns, failed logins and configuration changes that may indicate security incidents. PRTG also monitors the status of security appliances and firewalls to ensure that your defenses remain operational, giving you peace of mind.
When evaluating ICT solutions for network monitoring, look for these essential features:
PRTG helps to optimize the user experience by measuring application response times, service availability and resource utilization. You can track the performance of critical applications and receive alerts when metrics fall below acceptable thresholds. Our solution helps you identify and resolve problems before users notice them. With historical performance data, you can identify trends and plan for capacity upgrades. This proactive approach ensures a consistent, reliable user experience.
Follow a structured methodology that starts with identifying critical systems and defining monitoring objectives. Map your infrastructure and determine which metrics are most important. Establish baseline performance levels and set appropriate alert thresholds. Deploy sensors incrementally, focusing on mission-critical systems first. Review your monitoring configuration regularly as your infrastructure evolves. Train your team to interpret monitoring data and develop response procedures for common issues.
PRTG uses automation to streamline the monitoring process. The auto-discovery feature identifies network devices and suggests appropriate sensors, saving setup time. You can configure automatic responses to specific events, such as restarting services when problems occur. Scheduled reports provide insight without manual preparation. The notification system manages alerts, including escalation procedures to prevent alert storms. These capabilities allow you and your IT team to focus on strategic initiatives instead of routine tasks.
In PRTG, “sensors” are the basic monitoring elements. One sensor usually monitors one measured value in your network, for example the traffic of a switch port, the CPU load of a server, or the free space on a disk drive. On average, you need about 5-10 sensors per device or one sensor per switch port.
Paessler conducted trials in over 600 IT departments worldwide to tune its network monitoring software closer to the needs of sysadmins. The result of the survey: over 95% of the participants would recommend PRTG – or already have.

Paessler PRTG is used by companies of all sizes. Sysadmins love PRTG because it makes their job a whole lot easier.
Bandwidth, servers, virtual environments, websites, VoIP services – PRTG keeps an eye on your entire network.
Everyone has different monitoring needs. That’s why we let you try PRTG for free.