Custom alerts and data visualizations let you quickly identify and prevent background noise, bad quality of voice, and other causes of poor audio quality.
We've all been on one (actually, many) of those calls.
Your video keeps freezing. Or you're constantly having to ask the other person to repeat themselves, because their voice keeps breaking up and you can't understand a word they're saying.
It's awkward at the best of times. But especially so if it's an important meeting, like a sales presentation for a big client, or a new project kick-off.
Paessler PRTG's comprehensive network performance monitoring tracks the mean opinion score and other values that could impact call quality and alerts you when there's a risk of underperformance. That means smoother, more productive business calls… and fewer colleagues complaining to you about the VoIP system.

Not just your MOS. Detect and analyze all kinds of call quality issues such as audio codecs, jitter values, latency, duplicate packets, or even packet loss. With PRTG, you no longer have to search for the needle in the haystack – you’ll immediately see what’s the root cause of an issue.
Not just the quality of service. PRTG monitors your whole network: applications, bandwidth, hardware, traffic, virtual machines… you get the idea. See all your critical stats at a glance, in real time, optimize performance, and stop wasting hours (or days) troubleshooting issues.
Pick your preferred performance thresholds, and PRTG will email you, text you, or send an in-app notification when you're at risk of going under or over, so you can fix them promptly and avoid disruption. It's really as simple as that.
Because, let's face it. At the end of the day, you want to do your job well and go home at a reasonable hour. PRTG works continuously in the background, keeping an eye on things so you don't have to, and helping you ensure your network stays fast and stable for best end-user experience
Diagnose network issues by continuously tracking audio codecs, quality of service parameters, network congestion, and other Voice over IP attributes. Show mean opinion scores and other key audio and video metrics in real time. Visualize monitoring data in clear graphs and dashboards to identify problems more easily. Gain the overview you need to troubleshoot and fix the causes of poor voice quality in calls and other VoIP issues.

Device tree view of the complete monitoring setup

Custom PRTG dashboard for keeping an eye on the entire IT infrastructure

Live traffic data graph in PRTG
“All-around winning
network monitor”
“The real beauty of PRTG is the endless possibilities it offers”
“PRTG Network Monitor
is very hard to beat”
PRTG comes with more than 250 native sensor types for monitoring your entire on-premises, cloud, and hybrid cloud environment out of the box. Check out some examples below!
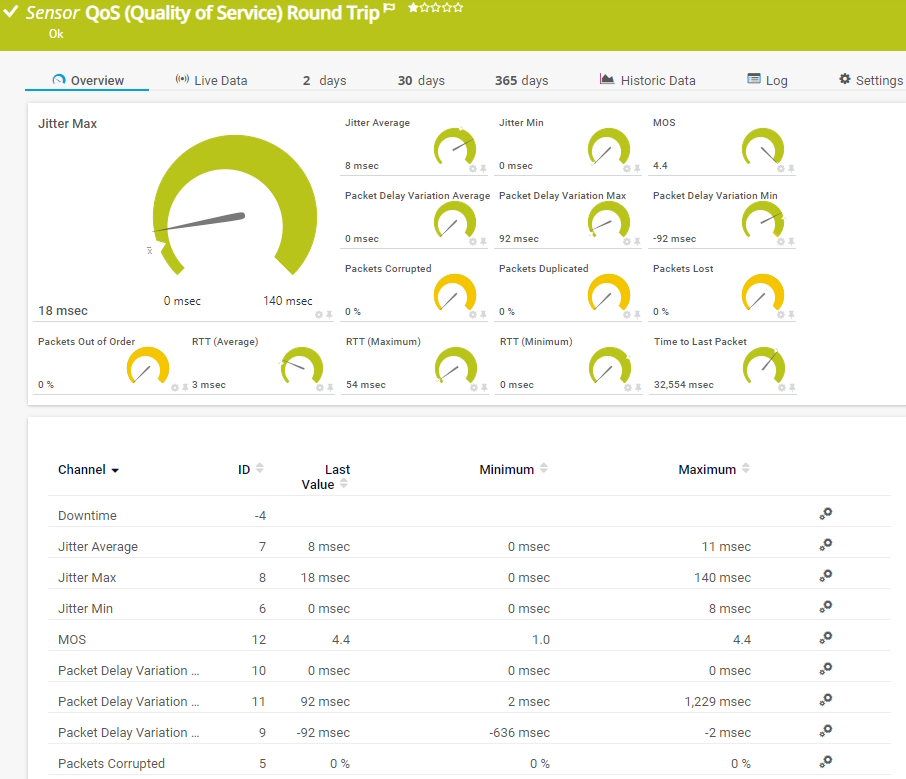
The QoS (Quality of Service) Round Trip sensor monitors parameters regarding the quality of a network connection between two probes. It can show the following:
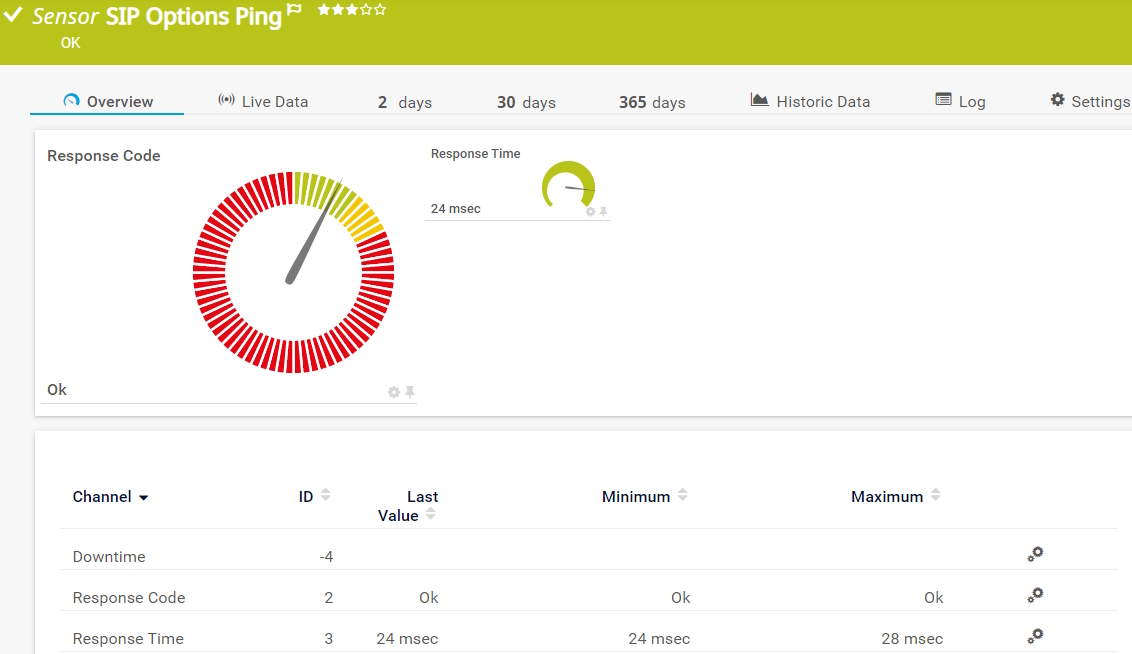
The SIP Options Ping sensor monitors the connectivity to a Session Initiation Protocol (SIP) server using SIP options "ping". The sensor sends auth and options requests to the SIP server. It can show the following:
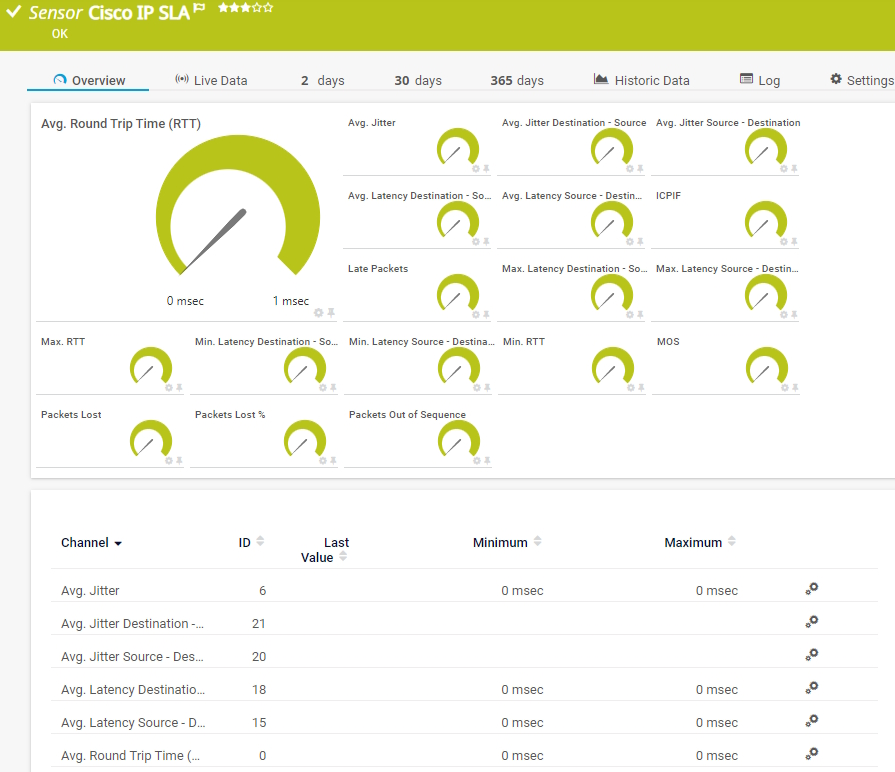
The Cisco IP SLA sensor monitors Voice over IP (VoIP) network parameters using IP service level agreements (SLA) from Cisco. It can show the following:
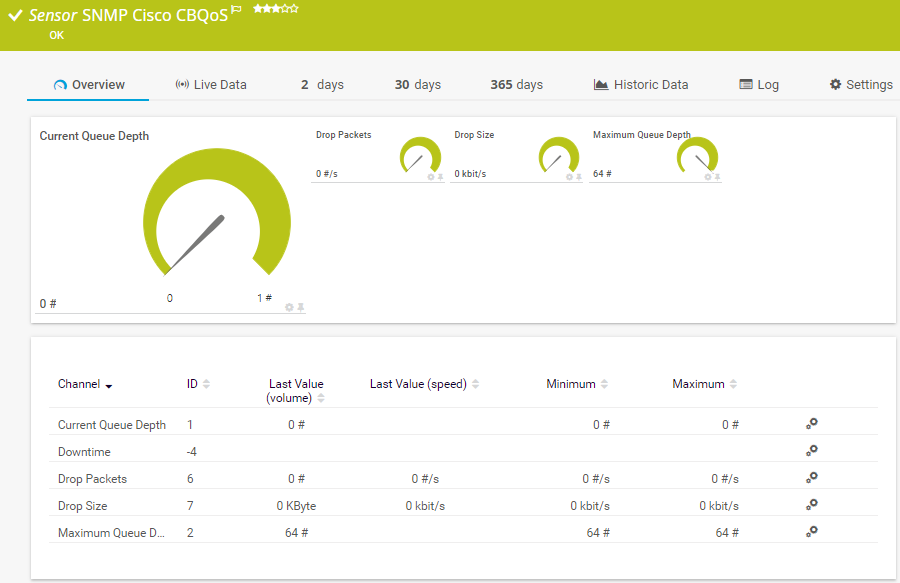
The SNMP Cisco CBQoS sensor monitors network parameters using Cisco's Class Based Quality of Service (CBQoS). It can show the following:
See the PRTG Manual for a list of all available sensor types.

Real-time notifications mean faster troubleshooting so that you can act before more serious issues occur.
Set up PRTG in minutes and use it on almost any mobile device.


“Excellent tool for detailed monitoring. Alarms and notifications work greatly. Equipment addition is straight forward and server initial setup is very easy. ...feel safe to purchase it if you intend to monitor a large networking landscape.”
Partnering with innovative IT vendors, Paessler unleashes synergies to create
new and additional benefits for joined customers.
Combining PRTG’s broad monitoring feature set with IP Fabric’s automated network assurance creates a new level of network visibility and reliability.
Rhebo and PRTG offer a comprehensive monitoring solution for IT and OT environments: from condition monitoring through to anomaly and threat detection.
UVexplorer integrates tightly with PRTG to bring fast and accurate network discovery, detailed device inventory, and automatic network mapping to the PRTG platform.
Custom alerts and data visualizations let you quickly identify and prevent background noise, bad quality of voice, and other causes of poor audio quality.
Network Monitoring Software – Version 25.3.110.1313 (August 27, 2025)
Download for Windows and cloud-based version PRTG Hosted Monitor available
English, German, Spanish, French, Portuguese, Dutch, Russian, Japanese, and Simplified Chinese
Network devices, bandwidth, servers, applications, virtual environments, remote systems, IoT, and more
Choose the PRTG Network Monitor subscription that's best for you


MOS – the mean opinion score – rates the voice and image quality of a VoIP transmission. It is the arithmetical average of several parameters. The lowest MOS is 1, while the highest MOS is 5.
MOS is an average of the performance of various video and audio attributes. ITU-T – the United Nations' International Telecommunication Union Telecommunication Standardization Sector – has established standard tests for evaluating the quality of both video and audio.
A VoIP MOS score of 1 means that despite great effort, it is impossible to understand what is being said during the call (the call repeatedly cuts in and out). A score of 5 means the quality is excellent, with no effort required to understand what is being said. MOS tests make it possible to compare a variety of codecs and audio connections.
“Codec” is short for “coder-decoder.” With a codec, data or a signal is digitally coded then decoded. This process is not immune to dips in quality. In telephone networks, a large number of codecs is used, each of which has its own MOS. The MOS makes it easy to compare the quality of the various codecs.
MOS monitoring tools like PRTG enable you to assess how your organization's VoIP system is doing at a glance. Check the dashboard, and you'll get your current MOS score straight away. Better still, PRTG alerts you as soon as there's a risk of issues, so you can fix them before your MOS goes down.
MOS monitoring directly impacts customer satisfaction by ensuring clear voice quality during calls. When call centers implement continuous quality tracking, agents can focus on customer needs rather than struggling with audio issues. This leads to shorter call times, fewer repeated conversations, and more positive customer experiences.
Additionally, proactive voice quality assessment allows IT teams to address VoIP issues before they affect customer interactions, maintaining professional communication standards even during peak call volumes.
While MOS monitoring provides essential voice quality metrics, complete VoIP management requires tracking additional factors. Effective systems monitor jitter, latency, and packet loss alongside quality scores. Network bandwidth utilization patterns help identify when VoIP traffic competes with other applications.
Device performance metrics from phones, routers, and session border controllers complement MOS monitoring data. Together, these measurements create a complete picture of VoIP health, allowing for targeted optimizations rather than general troubleshooting.
In PRTG, “sensors” are the basic monitoring elements. One sensor usually monitors one measured value in your network, for example the traffic of a switch port, the CPU load of a server, or the free space on a disk drive. On average, you need about 5-10 sensors per device or one sensor per switch port.
Paessler conducted trials in over 600 IT departments worldwide to tune its network monitoring software closer to the needs of sysadmins. The result of the survey: over 95% of the participants would recommend PRTG – or already have.

Paessler PRTG is used by companies of all sizes. Sysadmins love PRTG because it makes their job a whole lot easier.
Bandwidth, servers, virtual environments, websites, VoIP services – PRTG keeps an eye on your entire network.
Everyone has different monitoring needs. That’s why we let you try PRTG for free.