Custom alerts and data visualization let you quickly identify and prevent network outages and unauthorized devices | security vulnerabilities and performance bottlenecks.
Are you confident you know every device connected to your network right now? With the PRTG local network scanner, you can automatically discover and monitor all devices across your entire infrastructure, from servers and workstations to routers and unauthorized access points that might otherwise remain hidden.
PRTG scans your entire network and identifies all connected devices, eliminating the need for manual configuration. Schedule regular scans to maintain an up-to-date inventory of your network assets and receive immediate alerts when new devices appear. The auto-discovery feature saves hours of manual work while ensuring that nothing escapes your attention.
Transform complex network data into clear, actionable insights with customizable maps and dashboards. Create visual representations of your network topology to show device relationships, monitor status in real time, and quickly identify potential issues before they affect operations. The map designer make complex networks easy to understand at a glance.
Monitor the health and performance of all discovered devices to ensure optimal network operation. PRTG monitors critical metrics such as CPU usage, memory consumption, and response times for each device on your network. Establish performance baselines and receive alerts when devices differ from normal operation to address issues before users notice any impact.
Generate comprehensive reports on your network inventory, device performance, and security status in just a few clicks. With PRTG, you can create scheduled reports for stakeholders, document your network for compliance purposes, and track changes over time. Its detailed reporting capabilities provide the documentation you need for audits, capacity planning, and infrastructure management.
Diagnose network issues by continuously tracking devices, IP addresses and open ports. Show device availability and other key metrics in real time. Visualize monitoring data in clear graphs and dashboards to identify problems more easily. Gain the overview you need to troubleshoot network bottlenecks and performance degradation.
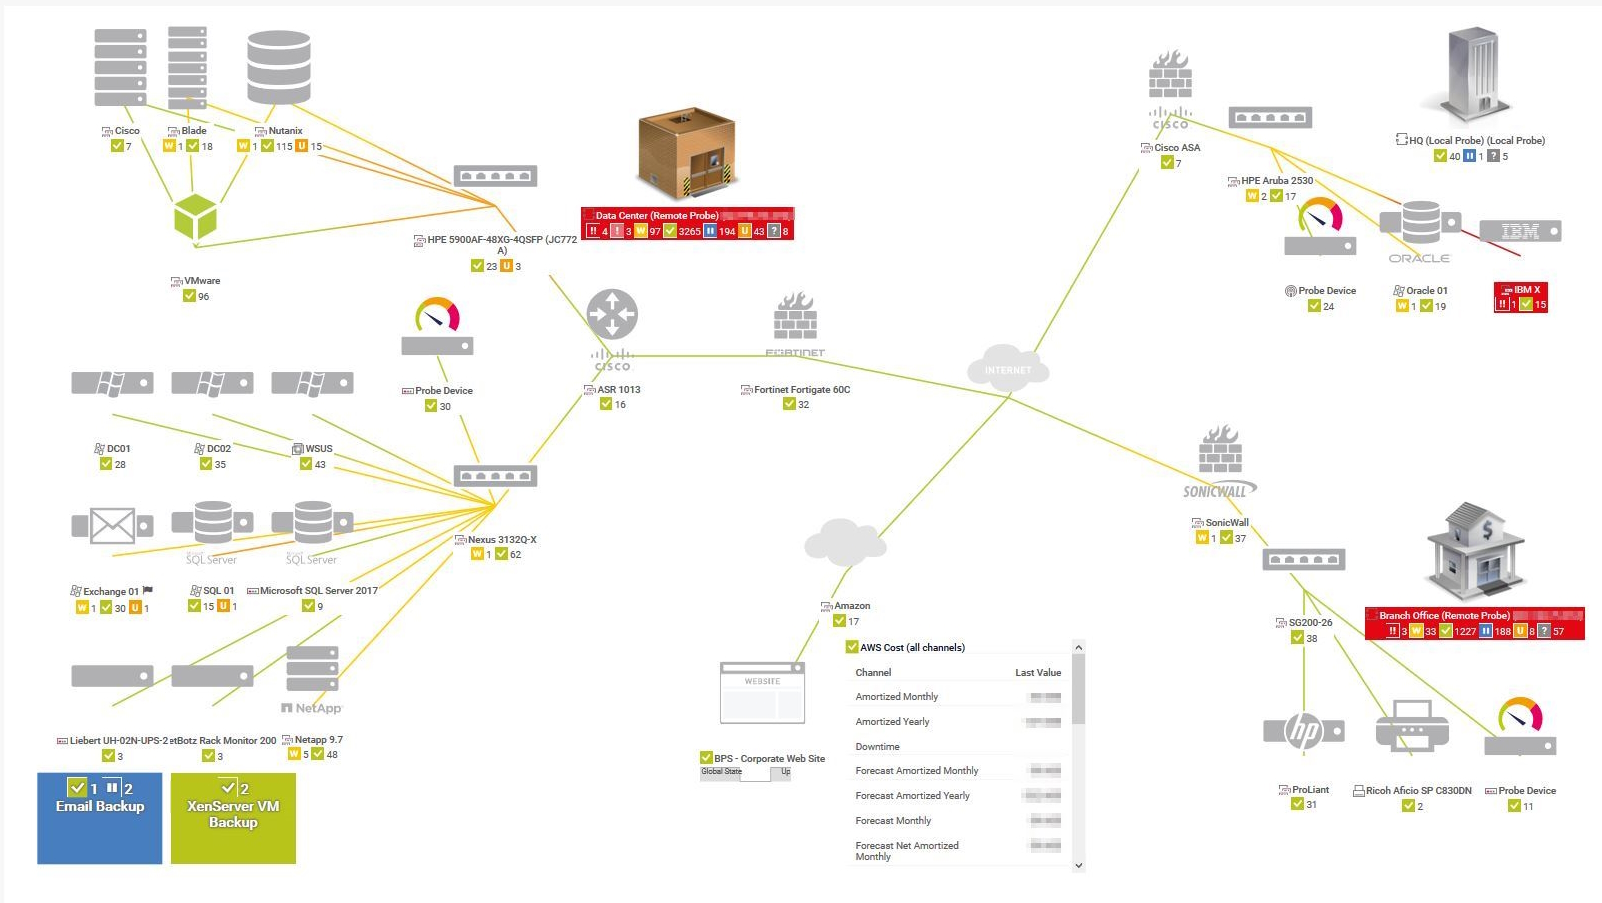
Overview of network topology in PRTG

Device tree view of the complete monitoring setup

Custom PRTG dashboard for keeping an eye on the entire IT infrastructure

Live traffic data graph in PRTG
“All-around winning
network monitor”
“The real beauty of PRTG is the endless possibilities it offers”
“PRTG Network Monitor
is very hard to beat”
Have you ever tried to track down a network issue, only to discover that it was caused by a device you didn't even know existed? Managing local networks can be a nightmare when unauthorized devices connect, IP conflicts occur, or outdated firmware creates security vulnerabilities. Even worse, the pressure to resolve network outages quickly can be overwhelming if you lack proper visibility.
Deploy PRTG in minutes using the auto-discovery feature, which automatically finds and maps your entire network. No extensive technical knowledge is required to get started, as the intuitive interface will guide you through the configuration process. The straightforward setup allows you to start monitoring your network devices almost immediately after installation.
Select a subscription model that meets your specific needs so you don't pay for unnecessary features. Start with the free version, which includes 100 sensors, and upgrade when your monitoring needs increase. Our transparent pricing structure ensures predictable costs while allowing you to scale your monitoring solution.
Use the PRTG mobile apps for iOS and Android devices to monitor your network from anywhere. Receive real-time alerts about network issues directly on your smartphone and respond quickly, even when you're away from your desk. The mobile interface provides the same comprehensive view of your network as you would have in the office.
Get the help you need when you encounter setup challenges or need assistance optimizing your local network monitoring configuration. Take advantage of extensive documentation, active user forums, and direct support channels staffed by technical experts who specialize in local network environments. Resolve issues quickly with a support team that consistently receives high satisfaction ratings from customers worldwide.
PRTG comes with more than 250 native sensor types for monitoring your entire on-premises, cloud, and hybrid cloud environment out of the box. Check out some examples below!
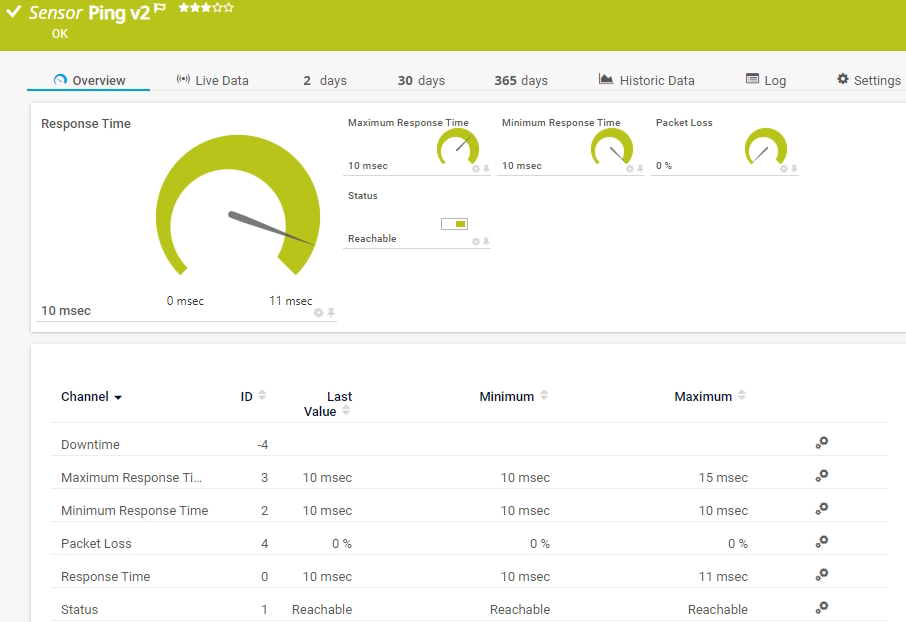
The Ping v2 sensor sends an Internet Control Message Protocol (ICMP) echo request ("ping") from the probe system to the parent device to monitor its availability. It can show the following:
• Response time
• Packet loss
• Target status
• Minimum and maximum ping time
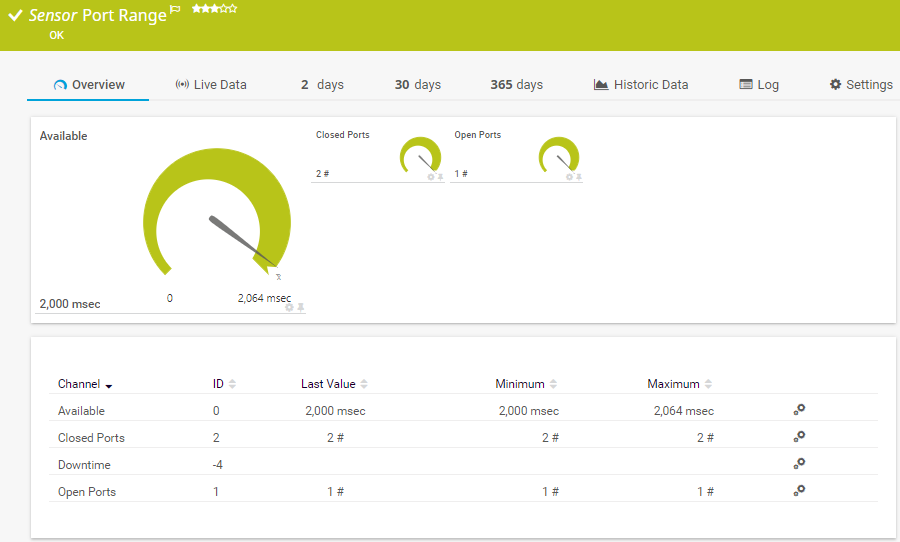
The Port Range sensor monitors a network service by connecting to various TCP/IP ports. It tries to connect to the specified TCP/IP port numbers of a device in succession and waits for the device to accept each request. It can show the following:
The SNMP Traffic v2 sensor monitors bandwidth and traffic on a device. It can show the following:
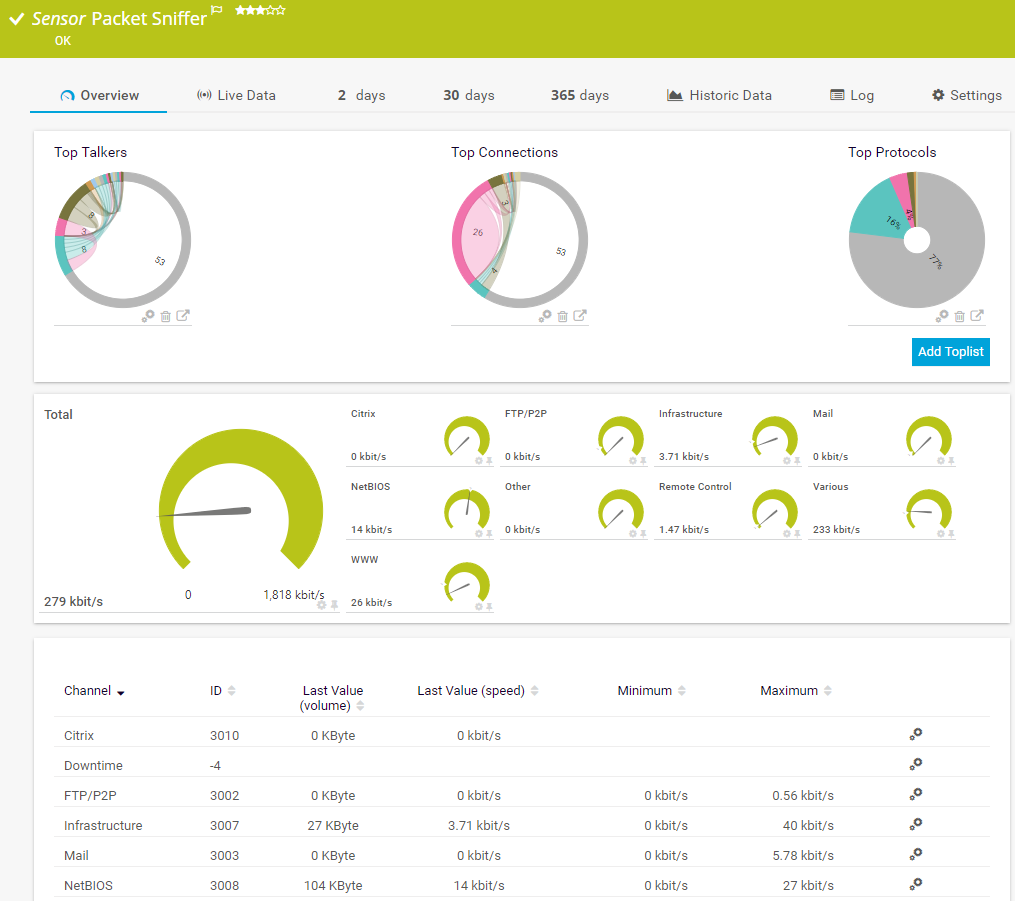
The Packet Sniffer sensor monitors the headers of data packets that pass a local network card using a built-in packet sniffer. You can choose from predefined channels. It can show the following and more:
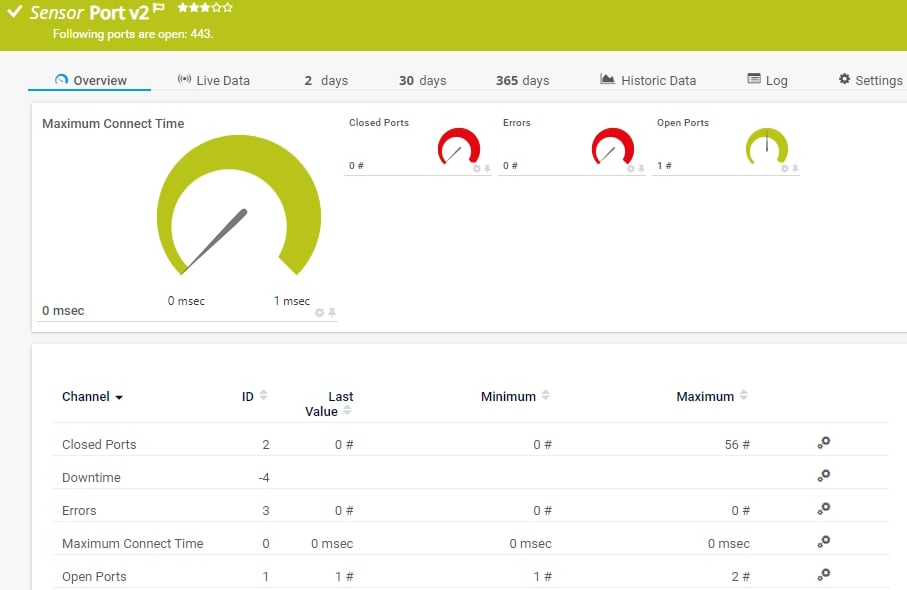
The Port v2 sensor monitors a network service by connecting to one or more of its TCP/IP ports. It can show the following:
See the PRTG Manual for a list of all available sensor types.

Custom alerts and data visualization let you quickly identify and prevent network outages and unauthorized devices | security vulnerabilities and performance bottlenecks.
PRTG is set up in a matter of minutes and can be used on a wide variety of mobile devices.

Partnering with innovative IT vendors, Paessler unleashes synergies to create
new and additional benefits for joined customers.
IT that works constitutes a business-critical basis for a company's success. Availability and security must be defined for the respective purpose and closely monitored – by OT and IT alike.
UVexplorer integrates tightly with PRTG to bring fast and accurate network discovery, detailed device inventory, and automatic network mapping to the PRTG platform.
Integrating monitoring results from PRTG into NetBrain maps makes the foundation for network automation.
Real-time notifications mean faster troubleshooting so that you can act before more serious issues occur.
Network Monitoring Software – Version 25.3.110.1313 (August 27, 2025)
Download for Windows and cloud-based version PRTG Hosted Monitor available
English, German, Spanish, French, Portuguese, Dutch, Russian, Japanese, and Simplified Chinese
Network devices, bandwidth, servers, applications, virtual environments, remote systems, IoT, and more
Choose the PRTG Network Monitor subscription that's best for you
A local network scanner is a tool that helps you discover and identify all devices connected to your local network. It works by scanning IP ranges to detect active devices, identifying their IP addresses, MAC addresses, and other information like open ports. Network administrators use these tools to maintain network security, troubleshoot connectivity issues, and create comprehensive device inventories across Windows, Linux, and macOS environments.
PRTG uses multiple technologies to scan networks, including ping scans across defined IP ranges, port scanning to detect opened ports, and protocol-specific detection methods. The auto-discovery feature automatically scans your subnet to find all connected devices, including wifi routers from vendors like TP-Link and Ubiquiti. PRTG can identify device types, operating systems, and even track mac addresses across different network segments for complete visibility.
Yes, PRTG works with various network types and operating systems. You can scan Windows networks, Linux environments, and wifi networks with equal effectiveness. PRTG detects devices across different subnets and can monitor remote networks through distributed probes. Whether you need to monitor corporate networks or home wifi routers, PRTG provides comprehensive scanning capabilities for complete network visibility.
PRTG scan results provide detailed information about each discovered device, including IP address, MAC address, hostname, operating system, and opened ports. You can see which devices are currently active, detect unauthorized devices, and identify potential security risks like vulnerable open ports. The scan results also show network topology, allowing you to visualize connections between devices and troubleshoot connectivity issues using tools like traceroute and UDP testing.
While PRTG primarily uses its web interface, you can automate network scanning through the PRTG API using command-line scripts. This allows network administrators to schedule regular scans, generate reports, and integrate scanning into existing workflows. For quick ad-hoc scanning, PRTG also offers an advanced IP scanner interface that provides immediate results without complex configuration.
PRTG enhances network security by continuously scanning for unauthorized devices, detecting opened ports that could be exploited, and alerting you to unexpected changes in your network. The port scanning capabilities help identify vulnerable services, while MAC address tracking prevents address spoofing. PRTG also monitors network traffic patterns to detect potential security threats and can send immediate alerts when suspicious devices connect to your network.
Yes, PRTG offers a free download with a fully functional trial that includes all network scanning features. After the trial period, it automatically converts to a free version with 100 sensors that never expire. This allows you to scan your network, detect devices, monitor critical systems, and even use features like wake-on-LAN to remotely power on devices or initiate a reboot when needed. The free version is perfect for small networks or to evaluate the scanning capabilities before upgrading.
In PRTG, “sensors” are the basic monitoring elements. One sensor usually monitors one measured value in your network, for example the traffic of a switch port, the CPU load of a server, or the free space on a disk drive. On average, you need about 5-10 sensors per device or one sensor per switch port.
Paessler conducted trials in over 600 IT departments worldwide to tune its network monitoring software closer to the needs of sysadmins. The result of the survey: over 95% of the participants would recommend PRTG – or already have.

Paessler PRTG is used by companies of all sizes. Sysadmins love PRTG because it makes their job a whole lot easier.
Bandwidth, servers, virtual environments, websites, VoIP services – PRTG keeps an eye on your entire network.
Everyone has different monitoring needs. That’s why we let you try PRTG for free.