Custom alerts and data visualization let you quickly identify and prevent issues with servers that have become unresponsive or are experiencing hardware malfunctions.
Paessler PRTG monitors accesses the IPMI interface to provide you with a constant overview of the hardware of all physical servers in your network.
Fully functional server hardware is a prerequisite for an error-free network. After all, servers are the backbone of your IT infrastructure. Of course, the applications and services on your servers will only work well if the servers themselves are running properly.
PRTG keeps a constant eye on server health and performance and acts as your early warning system for potential hardware failures to keep your business running smoothly.
IPMI usually works even when the host is turned off, which makes IPMI monitoring is a valuable tool for diagnosing hardware problems remotely without needing physical access.
PRTG comes with a handy alarm function that immediately notifies you of errors and disruptions based on individual warning and error thresholds so you can troubleshoot problems at once – even before your end users notice.
PRTG provides easy-to-read dashboards with live and historical data on server performance and availability. A quick glance is all it takes to see if everything is OK.
You can also generate detailed long-term statistics and configure automated reports that include exactly the level of information your stakeholders need for informed decision making and resource capacity planning.
Diagnose network issues by continuously tracking and managing the health and performance of IPMI devices and components remotely and in your LAN. Show CPU usage, memory, temperature, power supply, fan speed, bandwidth utilization, traffic by IP address and protocol, and other key metrics in real time. Visualize monitoring data in clear graphs and dashboards to identify problems more easily. Gain the overview you need to troubleshoot issues with remote servers and your entire network.

Device tree view of the complete monitoring setup
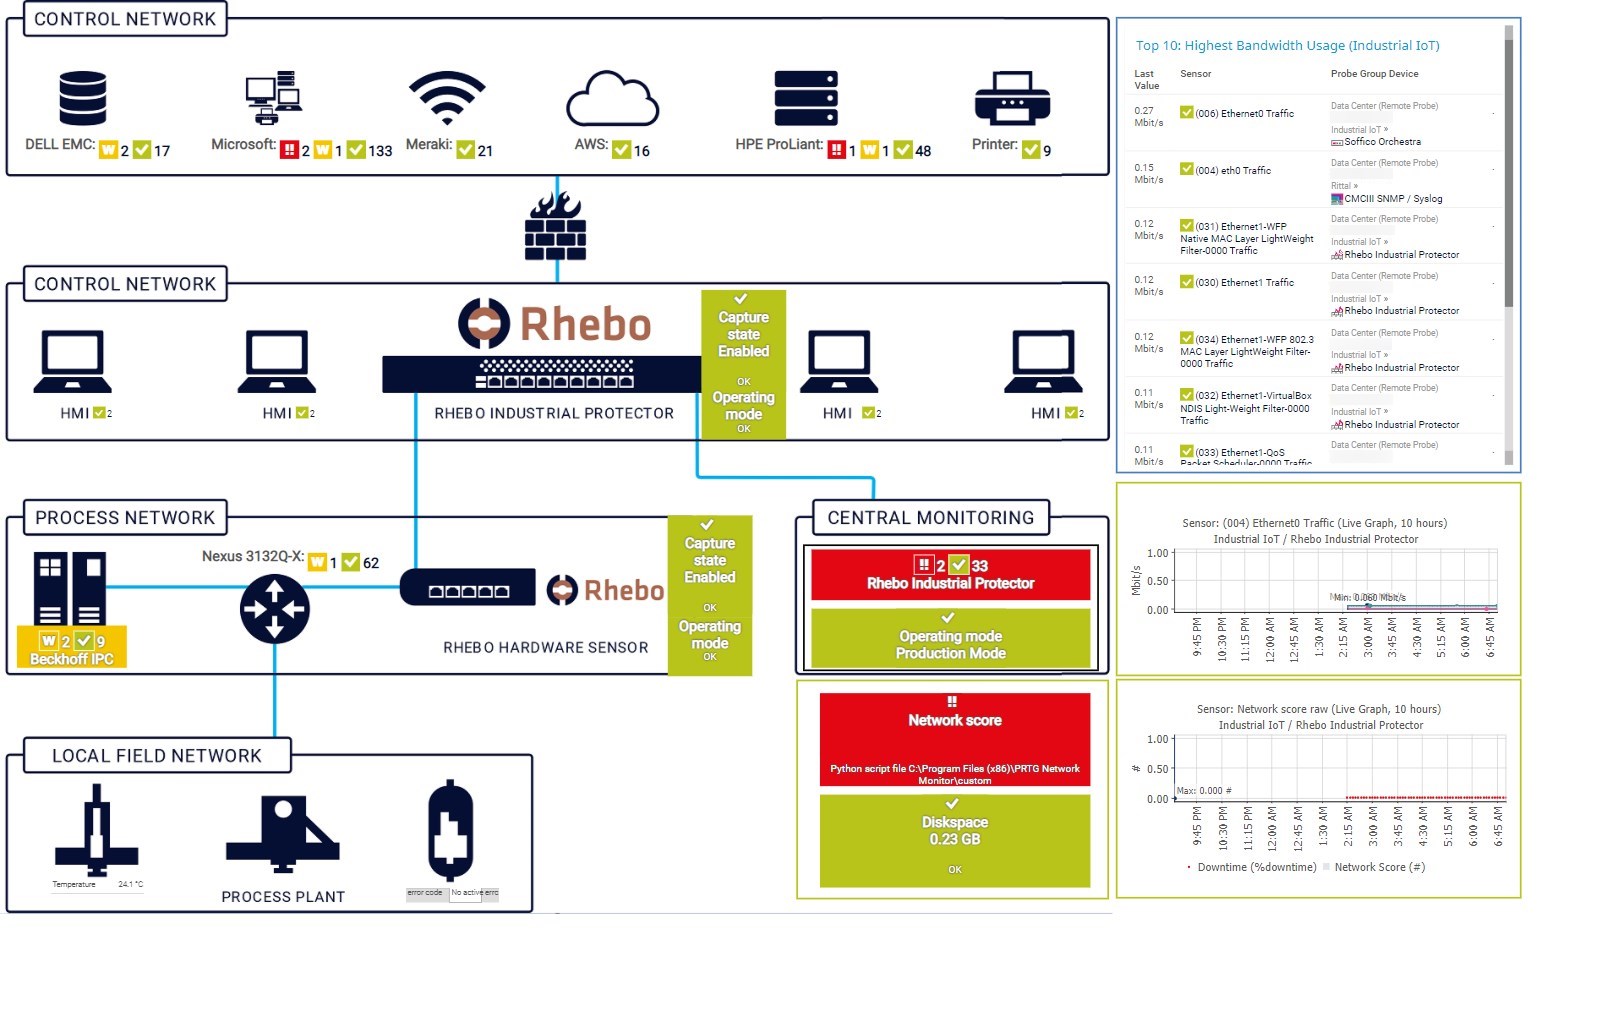
Custom PRTG map of Rhebo
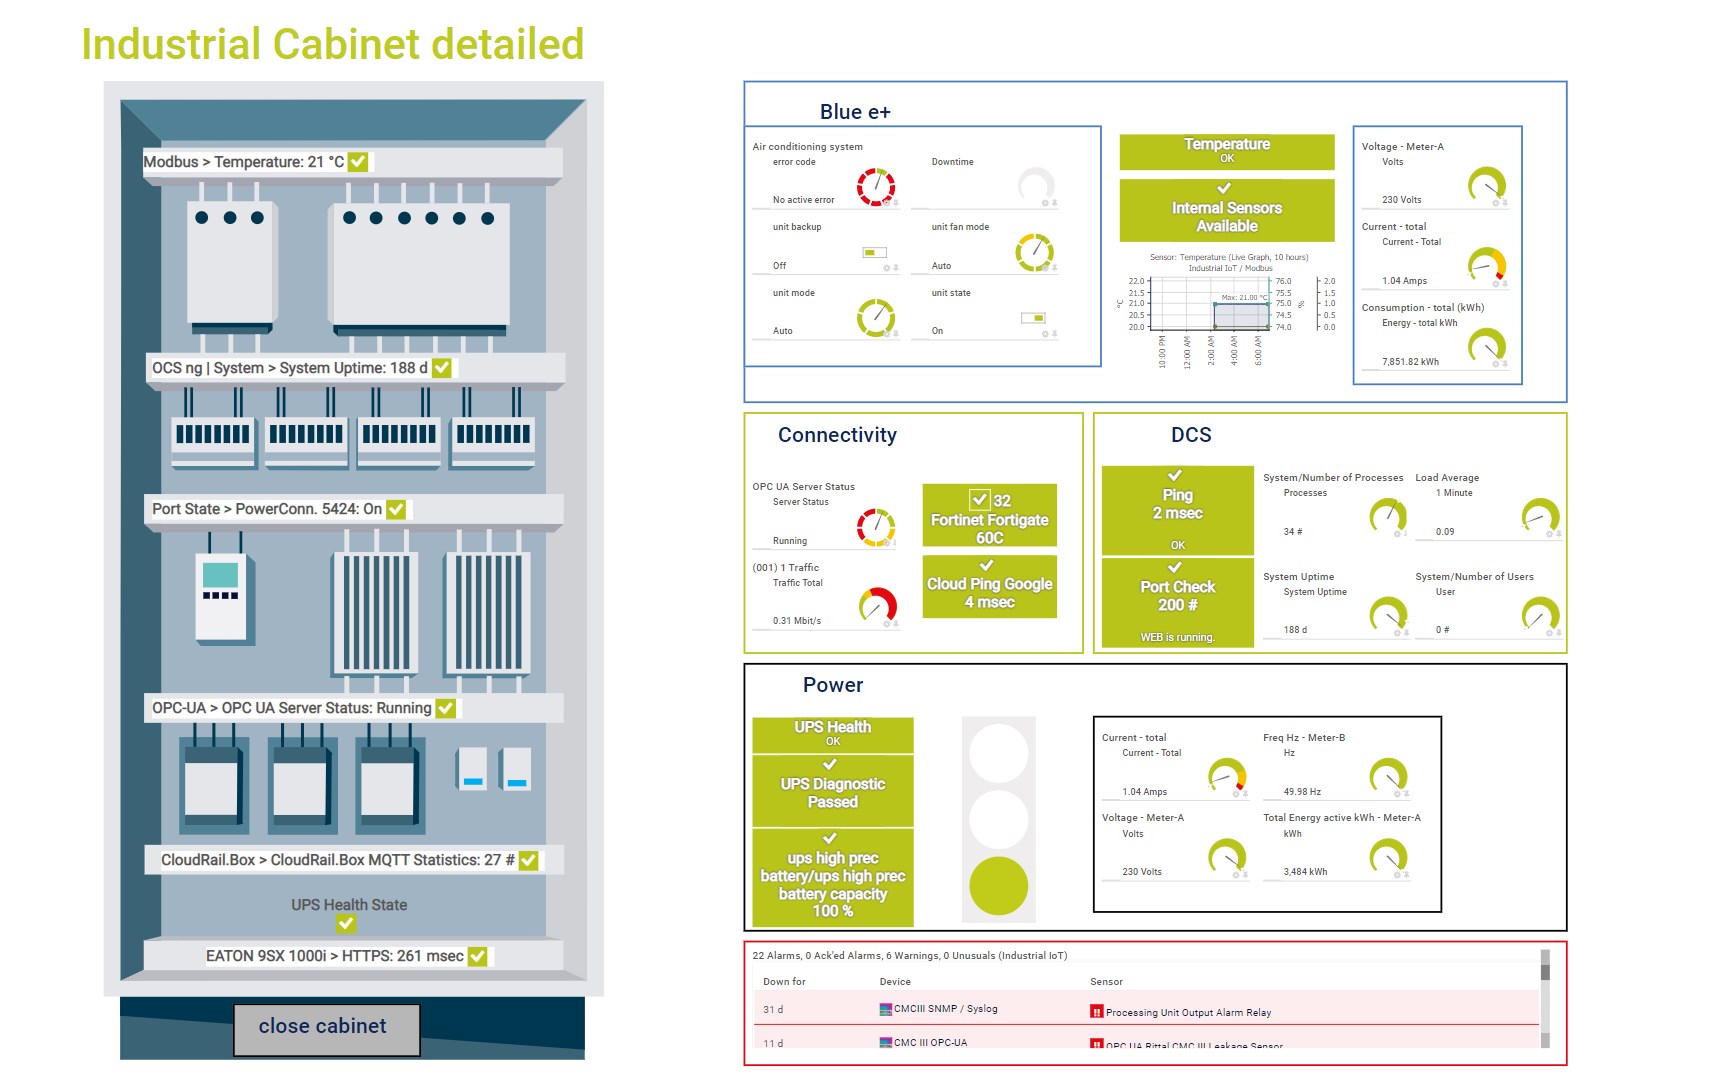
Map of an industrial cabinet (open) in PRTG
Awarded 3rd place in the
Software & IT category
Winner in the Software &
Computers category
With Redfish, you get all the advantages of IPMI such as the remote monitoring of powered-off servers. In addition, Redfish lets you optimize the scalability of your monitoring thanks to its improved performance.
Updates are no longer available for the IPMI protocol. If you’ve been using IPMI to manage and monitor your servers, Redfish is a modern and secure alternative that will continue to be updated and improved.
And of course, our all-in-one network monitoring tool also comes with preconfigured Redfish sensors out of the box, which you can add to your monitoring setup with just a few clicks.
Redfish is a clearly defined standard that uses the common protocols, structures, and security models of internet and web service environments.
By using Redfish to monitor your physical servers with PRTG, you'll benefit from a secure and powerful interface that can be deployed for many years to come.
With PRTG’s preconfigured Redfish sensors, it’s easy to monitor the status of your server hardware and components such as PCIe devices and temperature. Or track the power supply status, power efficiency, and voltage of Redfish-compatible systems.
Need insights into the status of the virtual disks on your servers? No problem – PRTG also keeps an eye on physical and virtual disk health alike.
PRTG comes with more than 250 native sensor types for monitoring your entire on-premises, cloud, and hybrid cloud environment out of the box. Check out some examples below!
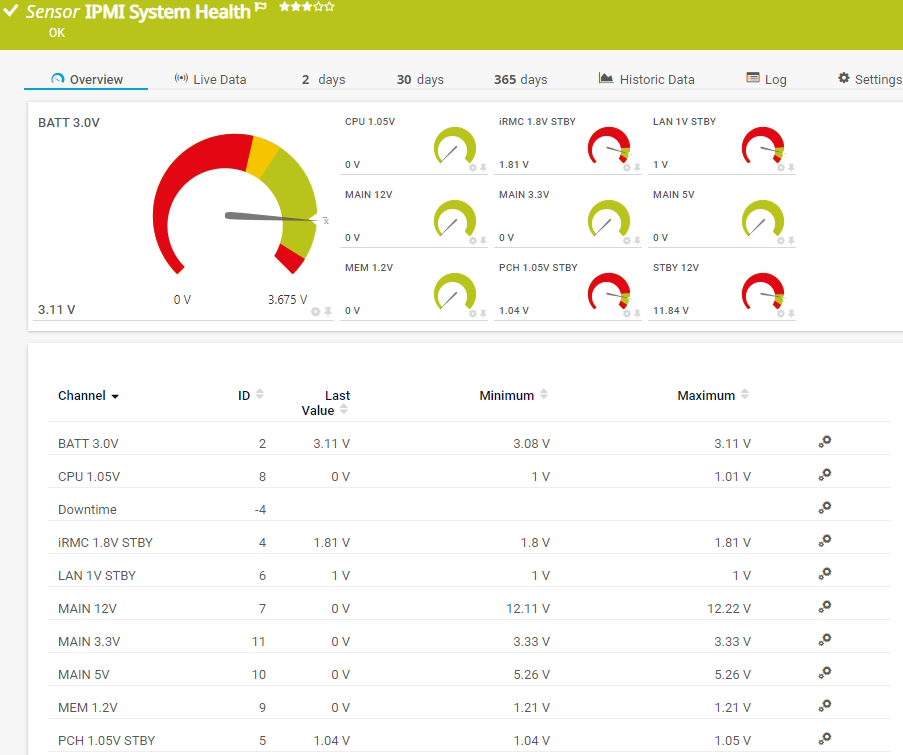
The IPMI System Health sensor monitors the status of a system via the Intelligent Platform Management Interface (IPMI). It can show the following:
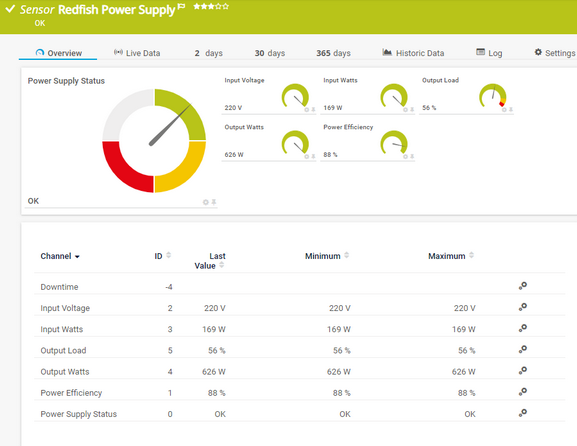
The Redfish Power Supply sensor monitors the power supply of a Redfish Scalable Platforms Management API (Redfish)-capable server. It can show the following:
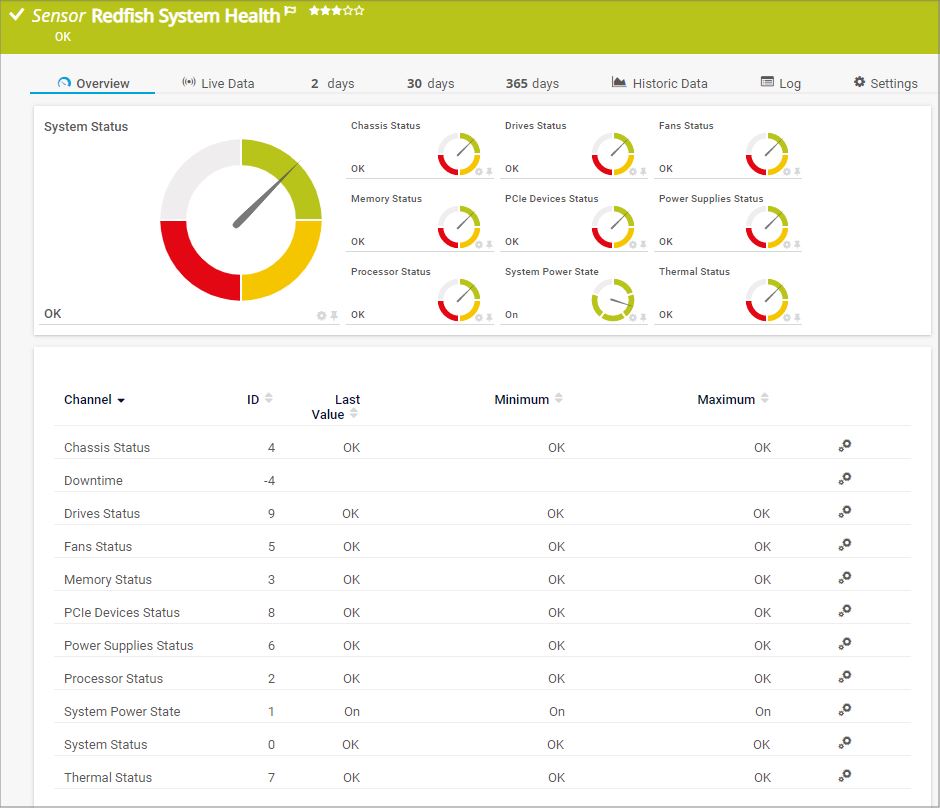
The Redfish System Health sensor monitors the system health of a Redfish Scalable Platforms Management API (Redfish)-capable server. It can show the following:
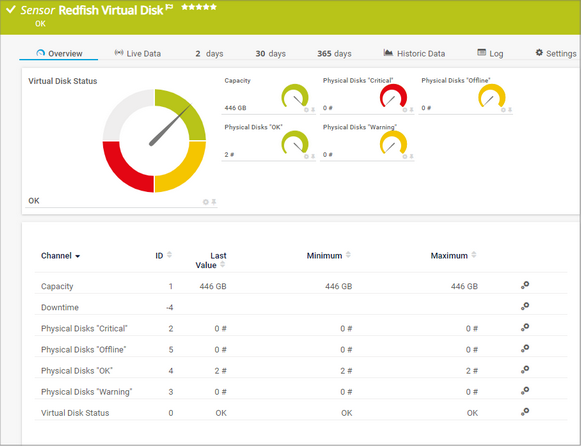
The Redfish Virtual Disk sensor monitors the virtual disk of a Redfish Scalable Platforms Management API (Redfish)-capable server. It can show the following:
See the PRTG Manual for a list of all available sensor types.

Custom alerts and data visualization let you quickly identify and prevent issues with servers that have become unresponsive or are experiencing hardware malfunctions.
PRTG is set up in a matter of minutes and can be used on a wide variety of mobile devices.


“Excellent tool for detailed monitoring. Alarms and notifications work greatly. Equipment addition is straight forward and server initial setup is very easy. ...feel safe to purchase it if you intend to monitor a large networking landscape.”
Partnering with innovative IT vendors, Paessler unleashes synergies to create
new and additional benefits for joined customers.
Axis offers one of the most complete and reliable product portfolios, an expanded professional network, and comprehensive integration support for video management software.
Paessler and Plixer provide a complete solution adding flow and metadata analysis to a powerful network monitoring tool.
With ScriptRunner Paessler integrates a powerful event automation platform into PRTG Network Monitor.
Real-time notifications mean faster troubleshooting so that you can act before more serious issues occur.
Network Monitoring Software – Version 25.3.110.1313 (August 27, 2025)
Download for Windows and cloud-based version PRTG Hosted Monitor available
English, German, Spanish, French, Portuguese, Dutch, Russian, Japanese, and Simplified Chinese
Network devices, bandwidth, servers, applications, virtual environments, remote systems, IoT, and more
Choose the PRTG Network Monitor subscription that's best for you


IPMI (Intelligent Platform Management Interface) is a standardized protocol used to manage and monitor the hardware of a server or a computer system independently of the operating system or even when the system is powered off. Developed by Intel, Dell, Hewlett Packard, and NEC in the late 1990s, IPMI is designed for remote management of servers, providing administrators with a way to monitor, troubleshoot, and perform system maintenance, especially in data centers.
IPMI is widely used but is gradually being supplemented or replaced by more secure and modern protocols such as Redfish, which offers similar functionalities with improved security and more flexible features.
Redfish is a modern, RESTful (Representational State Transfer) interface designed for managing and interacting with servers, storage, and networking hardware in data centers. It was developed by the Distributed Management Task Force (DMTF) as a replacement for the older, more complex IPMI protocol.
Redfish is widely seen as the future of hardware management in data centers, offering a more secure, flexible, and scalable alternative to IPMI:
IPMI monitoring refers to the use of the Intelligent Platform Management Interface (IPMI) protocol to track and manage the health and performance of a server's hardware components. By leveraging IPMI's out-of-band management capabilities, administrators can monitor key hardware metrics such as temperature, fan speed, voltage, power consumption, and more, even when the server's operating system is down or the machine is powered off.
With the System Event Log (SEL) functionality, IPMI can log critical hardware events such as component failures, power state changes, thermal events (overheating), and more. These logs help administrators understand when hardware issues occurred and provide information for troubleshooting.
Of course it does. The network monitoring tool natively supports common IT protocols such as SNMP, WMI and Windows performance counters for Microsoft Windows environments, SSH for Linux environments, SSL, FTP, HTTP and HTTPS, packet sniffing, or flow (NetFlow, jFlow, sFlow, IPFIX). For data centers and industrial IT/OT monitoring, it also supports technologies such as OPC UA, MQTT, and Modbus.
In PRTG, “sensors” are the basic monitoring elements. One sensor usually monitors one measured value in your network, for example the traffic of a switch port, the CPU load of a server, or the free space on a disk drive. On average, you need about 5-10 sensors per device or one sensor per switch port.
Paessler conducted trials in over 600 IT departments worldwide to tune its network monitoring software closer to the needs of sysadmins. The result of the survey: over 95% of the participants would recommend PRTG – or already have.

Paessler PRTG is used by companies of all sizes. Sysadmins love PRTG because it makes their job a whole lot easier.
Bandwidth, servers, virtual environments, websites, VoIP services – PRTG keeps an eye on your entire network.
Everyone has different monitoring needs. That’s why we let you try PRTG for free.