• Company
    • About Us
    • Case Studies
    • Press Center
    • Events
    • Careers
    • Blog
    • Contact us
  • Contact us
  • Login
 
  • English
    • Deutsch
    • Español
    • Français
    • Italiano
    • Português
Paessler
                    - The Monitoring Experts
  • Products
    • Paessler PRTG
      Paessler PRTGMonitor your whole IT infrastructure
      • PRTG Network Monitor
      • PRTG Enterprise Monitor
      • PRTG Hosted Monitor
      • PRTG extensionsExtensions for Paessler PRTGExtend your monitoring to a new level
    • Icon Features
      FeaturesExplore all monitoring features
      • Maps & dashboards
      • Alerts & notifications
      • Multiple user interfaces
      • Distributed monitoring
      • Customizable reporting
  • Solutions
    • Industries
      IndustriesMonitor various industry sectors
      • Industrial
      • Healthcare
      • Data Center
      • Education
      • Finance
      • Government
    • IT Topics
      IT TopicsMonitor all areas of IT
      • Network Monitoring
      • Bandwidth Monitoring
      • SNMP Monitor
      • Network Mapping
      • WiFi Monitoring
      • Server Monitoring
  • Pricing
  • Resources
    • Getting Started
      Getting StartedModules for self-paced learning
    • How-to Guides
      How-to GuidesGet the most out of PRTG
    • Videos & Webinars
      Videos & WebinarsLearn from Paessler experts
    • IT  Knowledge
      IT KnowledgeExpand your IT knowledge
    • PRTG Manual
      PRTG ManualFull documentation
    • Knowledge Base
      Knowledge BaseShare community knowledge
    • PRTG Sensor Hub
      PRTG Sensor HubGet sensors, scripts & templates
    • Trainings
      PRTG TrainingLearn how to work with PRTG
  • Partners
    • icon star
      New Partners and MSPBecome a new partner or MSP
    • icon partner
      Partner PortalLog in to your partner account
    • icon search
      Find a PartnerFind partners selling Paessler products
    • icon technology
      Technology AlliancesSee Paessler technology partnerships
  • Company
    • About Us
    • Case Studies
    • Press Center
    • Events
    • Careers
    • Blog
    • Contact us
  • Contact us
  • Login
  • English
    • Deutsch
    • Español
    • Français
    • Italiano
    • Português
  • Get a quote
  • Free trial
  1. Home>
  2. IT Topics>
  3. Hardware>
  4. Fan Monitoring
PRTG Logo

Fan Monitoring with PRTG

Continuously check fan health and performance in IT devices

  • Monitor fan temperature and optimize fans for efficiency
  • Prevent hardware damage and data loss
  • Secure the productivity and operations of your business
Free download
product overview

Our users give top ratings for monitoring with Paessler PRTG

Gartner peer insights
spiceworks
Capterra
G2
Trustpilot

PRTG fan monitoring: What you will find on this page

Table of content
  • 3 good reasons to monitor your fans with PRTG
  • What fan monitoring looks like in PRTG
  • Make automated fan control easy with PRTG
  • Explore our preconfigured PRTG sensors for fan monitoring
  • Fan Monitoring: FAQ

PRTG makes fan monitoring as easy as it gets

Custom alerts and data visualization let you quickly identify and prevent potential fan failures and overheating issues.

Free download
PRODUCT OVERVIEW

3 good reasons to monitor your fans with PRTG

With Paessler PRTG as your fan monitoring tool, you can avoid fluctuations in voltage and overheating as it helps you control the speed and temperature of your fans. Plus, PRTG is an all-in-one network monitoring software that integrates monitoring of your fan with monitoring your entire IT infrastructure.

Icon Ventilation

More reliable IT systems

Properly working fans are crucial to your IT system’s reliability. Because if data cannot be retrieved from overheated servers and other network devices, this will certainly hamper business processes and productivity. PRTG helps you avoid costly downtime with easy fan health monitoring.

Icon Harddrive

Reduced hardware costs

You’ll save money with PRTG since you will not have to replace equipment as frequently. PRTG helps your hardware run smoothly by ensuring its surroundings are well-ventilated and free of excessive heat, since systems last longer when they stay cool.

Icon Boost

Optimal resource usage

PRTG helps you save on energy costs by ensuring your IT systems are energy-efficient. It keeps a 24/7 eye on temperature, power distribution units, and even air conditioners in your data centers and server rooms to help prevent systems from overheating.

What fan monitoring looks like in PRTG

Diagnose network issues by continuously tracking the availability, health, and performance of your fans. Show fan rotation per minute (RPM), the overall fan status, the number of failed fans, airflow, and other key metrics in real time. Visualize monitoring data in clear graphs and dashboards to identify problems more easily. Gain the overview you need to troubleshoot overheating fans and other fan failures.

PRTG Screenshot device tree view

Device tree view of the complete monitoring setup

PRTG screenshot map entire it infrastructure

Custom PRTG dashboard for keeping an eye on the entire IT infrastructure

PRTG screenshot graph live data traffic

Live traffic data graph in PRTG

Start monitoring fans with PRTG and see how it can make your network more reliable and your job easier.

Free download
PRODUCT OVERVIEW

IT experts agree: Paessler PRTG is a great solution for IT infrastructure monitoring

PCMag

“All-around winning
 network monitor”

IT Brief

“The real beauty of PRTG is the endless possibilities it offers”

ITPro

“PRTG Network Monitor 
is very hard to beat”

Make automated fan control easy with PRTG

Icon Centralized Monitoring

All-in-one network monitoring

PRTG fan monitoring software includes preconfigured sensors to monitor temperature, voltage, and data of built-in fans. Plus, it’s also an IT monitoring tool that keeps an eye on network traffic, system status, bandwidth, and more. This makes PRTG better at ensuring your hardware is being sufficiently cooled and your Microsoft Windows or Linux or mac OS systems operate at peak performance.

Icon Maps

Custom dashboards and maps

You don’t need to juggle multiple monitoring tools, as PRTG comes with preconfigured sensors that monitor the status and performance of all system fans. Plus, our user-friendly, easy-to-read dashboards display all the data from your IT system on a single pane of glass. You can even create your own dashboards that exactly suit your requirements.

Icon Values

Compatible with top manufacturers

Our software is designed with general system status and hardware monitoring sensors that use protocols like SNMP, WMI, IPMI, Redfish, MQTT, or Modbus, as well as sensors for specific manufacturers (NetApp, HPE, Lenovo, Dell, Cisco, Synology, Fujitsu, etc.), to collect and display all parameters you can think of – well, mostly.

Explore our preconfigured PRTG sensors for fan monitoring

PRTG comes with more than 250 native sensor types for monitoring your entire on-premises, cloud, and hybrid cloud environment out of the box. Check out some examples below!

SNMP Fujitsu System Health v2

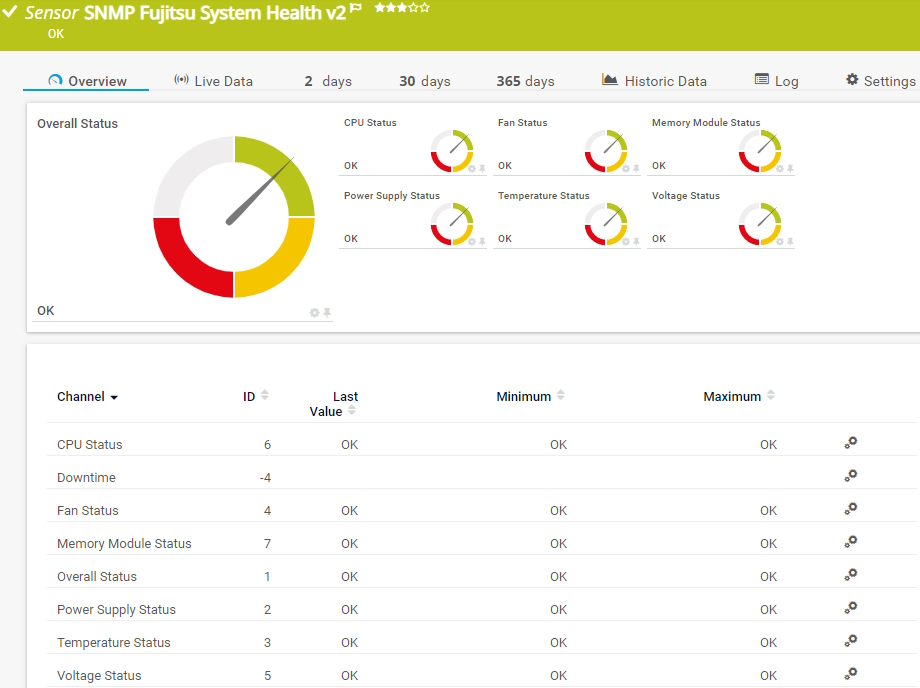
The SNMP Fujitsu System Health v2 sensor monitors the status of a Fujitsu PRIMERGY server via the integrated Remote Management Controller (iRMC) The sensor might also work on other Fujitsu devices that have an iRMC available like PRIMEQUEST servers, some storage systems of the ETERNUS product line, and CELSIUS workstations in racks. It can show the following:

  • Overall status
  • Temperature and voltage status
  • CPU and memory module status
  • Fan and power supply status
SNMP Fujitsu System Health v2

SNMP HPE ProLiant System Health

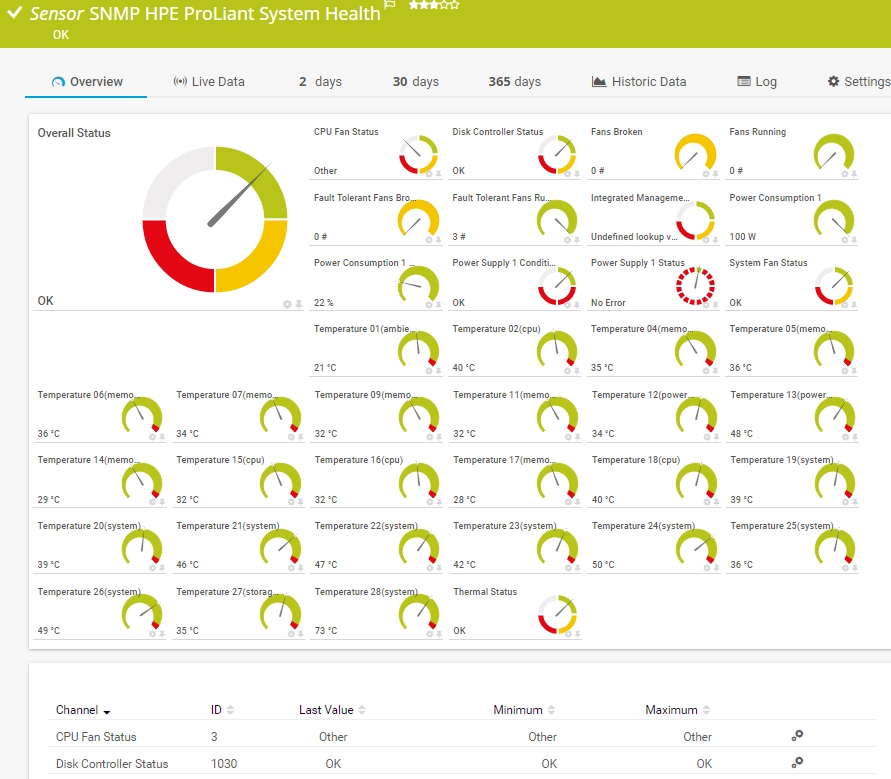
The SNMP HPE ProLiant System Health sensor monitors the system health of an HPE ProLiant server. It can show the following:

• Overall, CPU fan, system fan, thermal, and disk controller status

  • Number of (fault-tolerant) broken and running fans
  • Power consumption
  • Power supply condition and status
  • Temperature of the component
SNMP HPE ProLiant System Health

SNMP LenovoEMC System Health

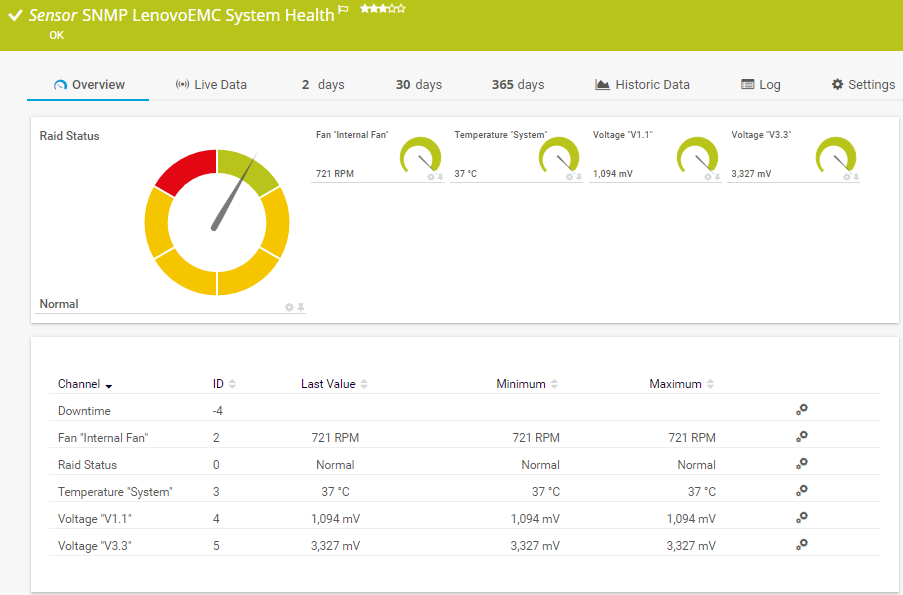
The SNMP LenovoEMC System Health sensor monitors the system health of a LenovoEMC network-attached storage (NAS). It can show the following:

  • Fan RPM
  • RAID status
  • CPU, drive, and system temperature
  • System voltage
  • 1.1V and 3.3V-battery status
SNMP LenovoEMC System Health

SNMP NetApp Enclosure

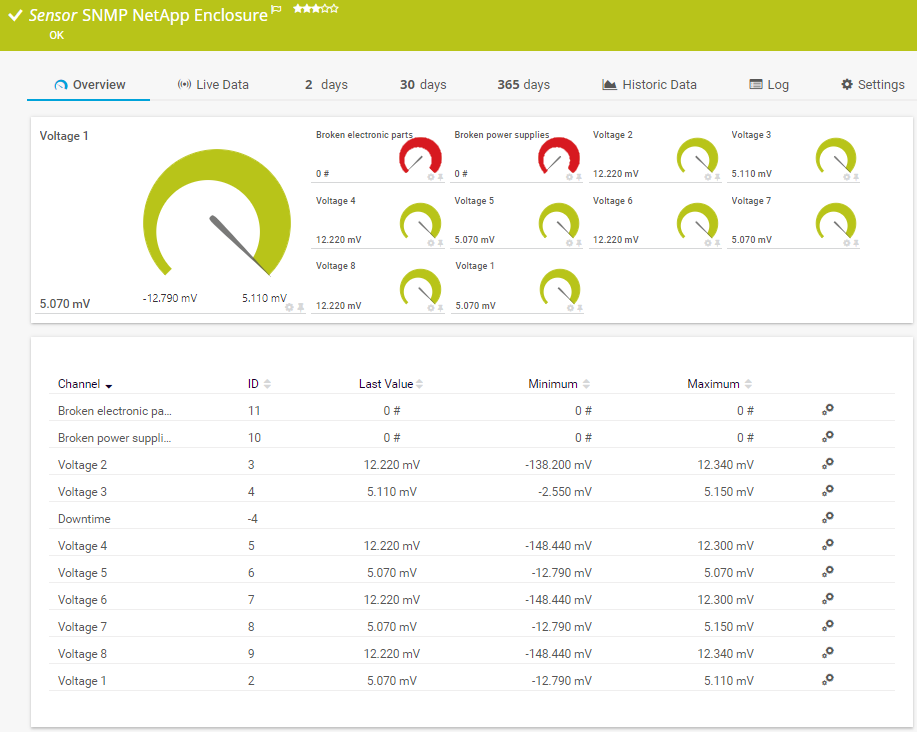
The SNMP NetApp Enclosure sensor monitors the power supply and cooling of an enclosure that is part of a NetApp storage system. It can show the following:

  • Number of broken electronic parts and power supplies
  • Current
  • Fan RPM
  • Number of failed fans
  • Voltage
SNMP NetApp Enclosure

See the PRTG Manual for a list of all available sensor types.

PRTG is compatible with all major vendors, products, and systems

compatible with all major vendors, products, and systems

PRTG makes fan monitoring as easy as it gets

Custom alerts and data visualization let you quickly identify and prevent potential fan failures and overheating issues.

Free download
PRODUCT OVERVIEW

“From a server perspective, we're monitoring all of the key components of our service such as CPU usage, RAM disk space, the Windows services that it's running, and network connectivity of that server. In terms of networks, we’re monitoring all of our switches, firewalls, and access points. It’s really useful to be able to easily pull performance metrics from the PRTG dashboard.”

Ollie Kerslake, Infrastructure Lead
Riverford Organic Farmers

“The tool has given us greater control over all types of devices connected to the network (switches, IP telephony, security cameras, IoT, WiFi) that previously remained opaque when dealing with service incidents. This has improved our ability to diagnose and resolve problems, which has translated into greater efficiency and a better user experience in both internal and public services.”

Jordi Tolosà Bel, New Technologies Technician
Vinaroz City Council

“Our objective was to be able to monitor the health of our most critical servers containing data and applications, but also the flows and bandwidth between headquarters, our 50 servers in the cloud and the 15 servers at our production sites. For us, it is essential to have a proactive approach to understand where the weaknesses of the IT system are to be able to improve them.”

Marc Boullier, CIO
Carambar & Co

Your fan monitor at a glance – even on the go

PRTG is set up in a matter of minutes and can be used on a wide variety of mobile devices.

device overview
Dell

We are a Dell Technologies Partner  

As one of the leading players in the IT monitoring industry, Paessler has also become an authorized Dell partner for building integrated solutions around the Dell technology ecosystem.

What does this mean for you?

  • Easy integration of Dell hardware and software with PRTG
  • State-of-the-art features for monitoring your Dell environment
  • Expert technical support around your Dell monitoring setup

Create innovative solutions with Paessler’s IT partners

Partnering with innovative IT vendors, Paessler unleashes synergies to create
new and additional benefits for joined customers.

baramundi

baramundi

baramundi and PRTG create a secure, reliable and powerful IT infrastructure where you have everything under control - from the traffic in your firewall to the configuration of your clients.

Read more
INSYS icom

INSYS icom

With the combination of PRTG and Insys, the monitoring specialist Paessler and the industrial gateway manufacturer INSYS icom offer a practical possibility to merge IT and OT.

Read more
Siemon

Siemon

Siemon and Paessler bring together intelligent building technology and advanced monitoring and make your vision of intelligent buildings and data centers become reality.

Read more

Find the root cause of the problem with our PRTG fan monitoring solution

Real-time notifications mean faster troubleshooting so that you can act before more serious issues occur.

Free download
PRODUCT OVERVIEW
Paessler PRTG

Paessler PRTG

Network Monitoring Software – Version 24.4.102.1351 (November 12th, 2024)

Hosting icon

Hosting

Download for Windows and cloud-based version PRTG Hosted Monitor available

Languages icon

Languages

English, German, Spanish, French, Portuguese, Dutch, Russian, Japanese, and Simplified Chinese

test

Monitor everything

Network devices, bandwidth, servers, applications, virtual environments, remote systems, IoT, and more

test

Pricing

Choose the PRTG Network Monitor subscription that's best for you

Discover more monitoring insights and stories

Resources Solution

Solutions for all your monitoring needs

  • The monitoring solution for all areas of IT!
  • CPU monitoring ✦ PRTG to the rescue
  • Data center temperature monitoring
Resources Content

Powerful stories from the monitoring world

  • Get more visibility of VMware ESXi: Metrics you should be monitoring
  • Monitor your server hardware (system health) with the Redfish protocol
  • Cooling an overheated server room...with fans: A true sysadmin story
Resources Solutions

Resources to master your monitoring challenges

  • Exporting CPU temp & Fan Speed from Windows 10 to PRTG?
  • How to monitor the status of the Cisco FRUs ( Modules / Fans / Power Supplies )
  • IPMI System Health with Datto Siris 3

Fan Monitoring: FAQ


How does a fan work?

The more heat that is generated by an IT system, the faster a fan must spin to dissipate the heat. Another observation: Fans get louder the faster they spin. A fan is powered by electricity. In a PC, the power supply is 12 volts. The power supply must be correct for the following reason: if the voltage drops, the fan will be less effective. When this happens, you can no longer ensure your laptop, server, or enclosure is being cooled or ventilated as needed. Consequently, the temperature of hardware components (motherboard, hard drives/HDD, SSDs, graphic cards, etc.) by vendors like Intel, AMD, Nvidia, and others can increase, and with it a risk of malfunctions and failures.

Why are fans vital to IT systems?

Like ventilators, fans swirl and circulate air. Fans perform three main tasks: cool, ventilate, and remove air from IT components. As a rule, all IT hardware comes equipped with a fan. For example, laptops and PCs have fans installed in their cases to keep CPU temperature and the temperature of their graphic and video card low. Servers and server racks  also need fans to function properly and not overheat.

What is a fan monitor?

A fan monitor is a system or device used to track the performance and status of cooling fans, typically in electronic equipment, server rooms, data centers, or industrial applications. Cooling fans are critical for maintaining optimal operating temperature ranges for equipment, and a fan monitor helps ensure they function correctly. Key aspects include:

  • Speed monitoring (RPM): Tracks the rotational speed of the fan in revolutions per minute (RPM) to ensure it operates within the desired range. Detects underperformance, which could indicate issues like wear, dust buildup, or mechanical failure.
  • Temperature monitoring: Some fan monitors like Paessler PRTG also track the temperature of the system or area being cooled to ensure fans are effectively maintaining the desired thermal conditions.
  • Operational status: Identifies whether the fan is on or off, including alerts for failures or malfunctions such as stalling or complete stoppage.
  • Alerts and notifications: Provides real-time alerts via sound, visual signals, or integrated management systems when the fan performance deviates from preset thresholds.
  • Power consumption tracking: In some advanced systems, monitors measure the power draw of the fan, helping assess efficiency and detect issues such as motor strain.
Why is monitoring fans in hardware important?

Why do IT systems, data storage devices, and server racks need to be ventilated in the first place? IT systems and servers always generate heat. However, when internal pieces become overheated, the performance of these systems and servers can drop considerably. In the worst case scenario, devices can crash or become damaged. For this reason, fans must be used to dissipate heat from servers, storage systems, computers, control units, switches, and other hardware components.

What is a sensor in PRTG?

In PRTG, “sensors” are the basic monitoring elements. One sensor usually monitors one measured value in your network, for example the traffic of a switch port, the CPU load of a server, or the free space on a disk drive. On average, you need about 5-10 sensors per device or one sensor per switch port.

We asked: would you recommend PRTG? Over 95% of our customers say yes!

Paessler conducted trials in over 600 IT departments worldwide to tune its network monitoring software closer to the needs of sysadmins. The result of the survey: over 95% of the participants would recommend PRTG – or already have.

recommendation

Still not convinced?

Love

More than 500,000 sysadmins love PRTG

Paessler PRTG is used by companies of all sizes. Sysadmins love PRTG because it makes their job a whole lot easier.

PRTG

Monitor your entire IT infrastructure

Bandwidth, servers, virtual environments, websites, VoIP services – PRTG keeps an eye on your entire network.

test

Try Paessler PRTG for free

Everyone has different monitoring needs. That’s why we let you try PRTG for free.

PRTG Logo

Start fan monitoring with PRTG and see how it can make your network more reliable and your job easier.

Free download
PRODUCT OVERVIEW

Products

  • Paessler PRTG
    Paessler PRTGMonitor your whole IT infrastructure
    • PRTG Network Monitor
    • PRTG Enterprise Monitor
    • PRTG Hosted Monitor
  • PRTG extensions
    Extensions for Paessler PRTGExtend your monitoring to a new level
  • Icon Features
    FeaturesExplore all monitoring features

Monitoring with PRTG

  • Network monitoring
  • Bandwidth monitoring
  • SNMP monitoring
  • Network mapping
  • Wi-Fi monitoring
  • Server monitoring
  • Network traffic analyzer
  • NetFlow monitoring
  • Syslog server

Useful Links

  • PRTG Manual
  • Knowledge Base
  • Customer Success Stories
  • About Paessler
  • Subscribe to newsletter
  • PRTG Support
  • PRTG Consulting

Contact

Paessler GmbH
Thurn-und-Taxis-Str. 14, 
90411 Nuremberg 
Germany

info@paessler.com

+49 911 93775-0

  • Contact us
©2025 Paessler GmbHTerms & ConditionsPrivacy PolicyImprintReport VulnerabilityDownload & InstallSitemap
404 - Page not found 404 - Page not found 404 - Page not found