Custom alerts and data visualization let you quickly identify and prevent host hardware and virtual server issues.
View all the important data of your Citrix virtualization on easy-to-read dashboards. With Paessler PRTG, you'll immediately see if your hardware, hypervisor, and virtual software are running smoothly or if any update or patch is available.
With PRTG Citrix monitoring, you'll keep a constant eye on key parameters and potential trouble spots.
In critical situations like server failure or resource overload, it’s vital to take action quickly. PRTG alerts you with custom notifications whenever your Citrix environment fails to run properly.
For example, if you set your CPU usage threshold value at 70% and the CPU load exceeds this level, you’ll automatically receive a notification by email, SMS, and more.
PRTG helps you intervene quickly to prevent issues from becoming emergencies. For example, if the host server reaches its load limit, your customers and coworkers would likely complain about a disruption.
With PRTG, you’ll be alerted before this happens so you can keep all virtual machines running smoothly and efficiently.
With PRTG’s Citrix server monitoring, you can quickly determine which host servers are under the greatest strain and which have unused capacity. This helps you distribute the load equally, so you optimize performance as well as save on hardware resources.
PRTG also helps you to properly size your Citrix virtual machines so you can assign more CPU and memory to individual VMs for peak performance.
Diagnose network issues by continuously tracking Citrix hosts, hypervisors, and virtual servers. Show bandwidth, latency, application performance, as well as the health and performance of your entire virtual Citrix environment in real time. Visualize monitoring data in clear graphs and dashboards to identify problems more easily. Gain the overview you need to troubleshoot load and other performance issues.

Device tree view of the complete monitoring setup

Custom PRTG dashboard for keeping an eye on the entire IT infrastructure

Live traffic data graph in PRTG
“All-around winning
network monitor”
“The real beauty of PRTG is the endless possibilities it offers”
“PRTG Network Monitor
is very hard to beat”
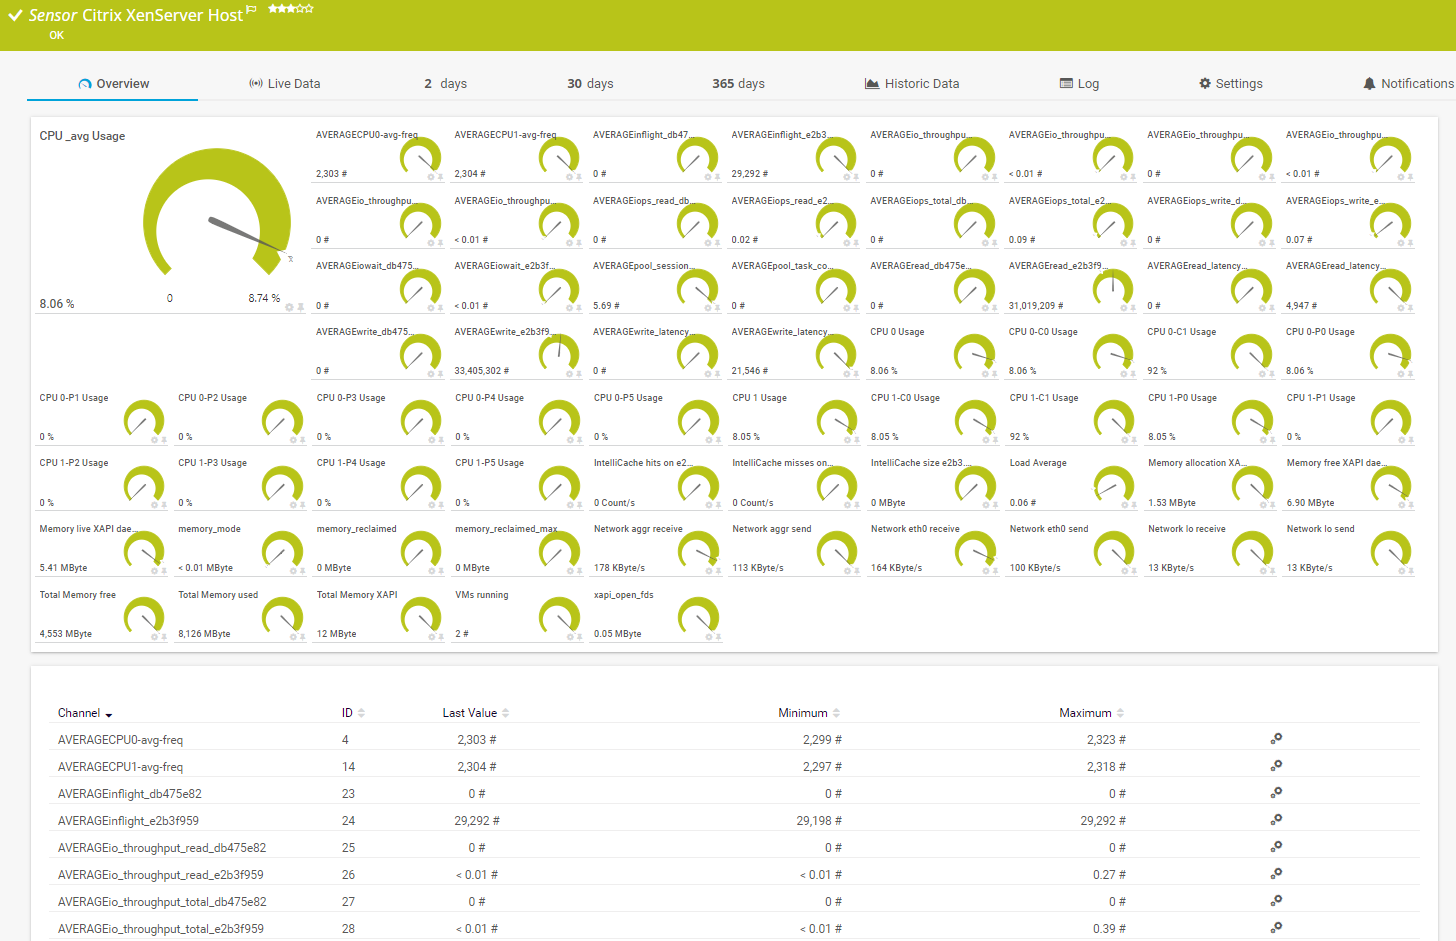
The preconfigured Citrix XenServer Host sensor lets you monitor all the important data and performance of your host. This is vital, since issues with virtual machines often lie in their underlying hardware.
For VMs to run trouble-free, metrics such as CPU load, hard disk usage, and memory or network utilization must be in the right range – and PRTG helps keep them there.
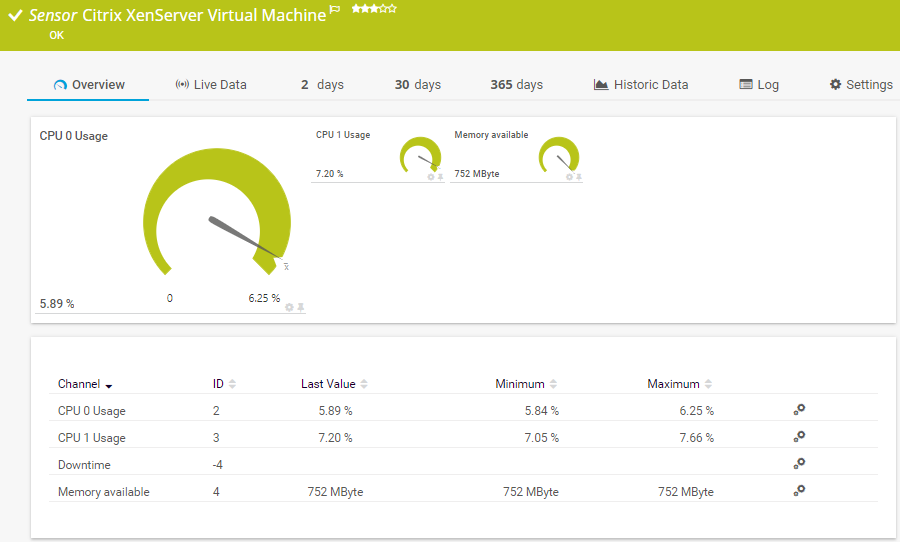
PRTG also monitors all the virtual machines running on your Citrix XenServer. With the preconfigured Citrix XenServer Virtual Machine sensor, you can keep an eye on all the relevant performance data of your VMs.
This includes CPU usage, read and write speed, available and used memory, and the balloon driver target size.
PRTG monitors the operating system and applications running on your Citrix VM, regardless of whether you are using Citrix XenDesktop, Citrix XenApp, or a different product.
For example, WMI is perfectly suited for monitoring your Windows operating system, while you can easily keep an eye on your Linux and macOS systems using SNMP and SSH.
It’s vital to closely monitor not only the host hardware, but also other hardware and servers in your network, virtual environments included.
Even the best virtualization software is useless if your network connection is shaky or down because of a faulty router in the network, an unavailable file server, or some other hardware error. PRTG is your all-in-one network monitoring software that caters to all your monitoring needs.
PRTG lets you create custom sensors in combination with PowerShell to personalize your integrations and make monitoring Citrix environments easy and comprehensible.
The Lockstep Technology Group provides a great guide on how to achieve Citrix monitoring. They point out what to monitor, as well as how it can be done with PRTG custom sensors.
In the first part of Lockstep’s monitoring Citrix series, they show the following custom PowerShell sensors:
Check out our Knowledge Base article on Citrix monitoring for instructions on how to create user-defined sensors with PowerShell to customize your Citrix environment monitoring.
PRTG comes with more than 250 native sensor types for monitoring your entire on-premises, cloud, and hybrid cloud environment out of the box. Check out some examples below!
The Citrix XenServer Host sensor monitors a Xen host server via HTTP. It can show the following:
The Citrix XenServer Virtual Machine sensor monitors a virtual machine (VM) on a XenServer via HTTP. It can show the following:
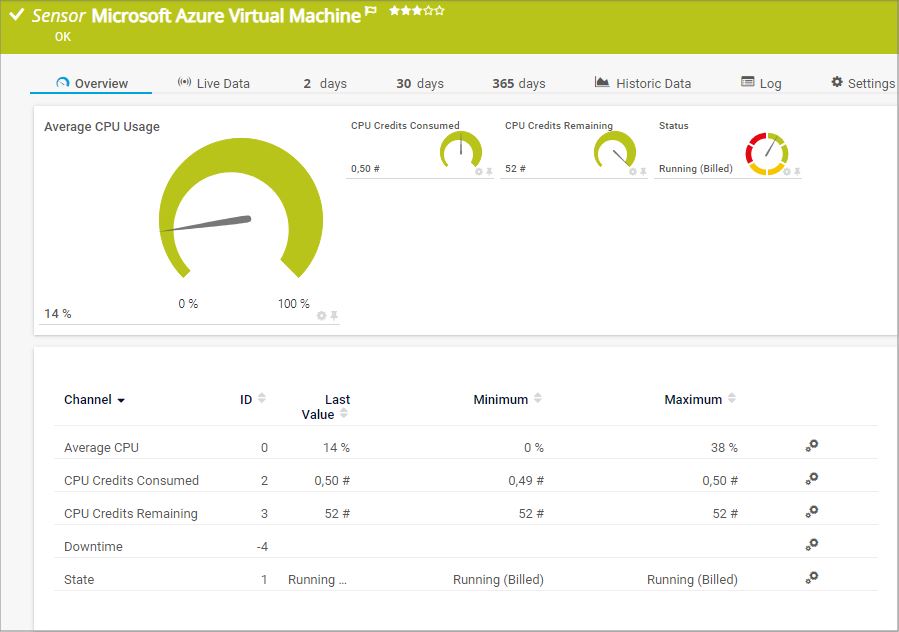
The Microsoft Azure Virtual Machine sensor monitors the status of a virtual machine (VM) in a Microsoft Azure subscription. It can show the following:
See the PRTG Manual for a list of all available sensor types.

Real-time notifications mean faster troubleshooting so that you can act before more serious issues occur.
PRTG is set up in a matter of minutes and can be used on a wide variety of mobile devices.


“Excellent tool for detailed monitoring. Alarms and notifications work greatly. Equipment addition is straight forward and server initial setup is very easy. ...feel safe to purchase it if you intend to monitor a large networking landscape.”
Partnering with innovative IT vendors, Paessler unleashes synergies to create
new and additional benefits for joined customers.
Paessler and Plixer provide a complete solution adding flow and metadata analysis to a powerful network monitoring tool.
Combining PRTG’s broad monitoring feature set with IP Fabric’s automated network assurance creates a new level of network visibility and reliability.
Siemon and Paessler bring together intelligent building technology and advanced monitoring and make your vision of intelligent buildings and data centers become reality.
Custom alerts and data visualization let you quickly identify and prevent host hardware and virtual server issues.
Network Monitoring Software – Version 25.3.110.1313 (August 27, 2025)
Download for Windows and cloud-based version PRTG Hosted Monitor available
English, German, Spanish, French, Portuguese, Dutch, Russian, Japanese, and Simplified Chinese
Network devices, bandwidth, servers, applications, virtual environments, remote systems, IoT, and more
Choose the PRTG Network Monitor subscription that's best for you


Virtualization is the process of creating a virtual version of something like computer hardware. It involves using specialized software to create a virtual or software-created version of a computing resource rather than the actual version of the same resource.
Citrix offers high-performance virtualization – a crucial component of many firms’ IT environments. Citrix XenServer is a professional virtualization platform that boasts an extremely high level of performance.
Citrix XenApp and XenDesktop provide these virtual servers with Windows apps and desktops for a variety of end devices. With PRTG’s Citrix performance monitoring, you’ll not only ensure the performance of your virtual machines always remains high, but you’ll also avoid downtime.
Citrix monitoring involves continuously tracking the performance, availability, and security of Citrix environments, including servers, Citrix virtual apps and desktops, and various other endpoints, on-premises and in the cloud. It includes collecting and analyzing data on resource utilization, user activity, session performance, and system health to ensure optimal operation.
Citrix monitoring tools like Paessler PRTG offer real-time insights, alerts, and reports to help administrators identify issues, troubleshoot problems, optimize performance, and maintain compliance with security and regulatory requirements. Effective Citrix monitoring enhances end-user experience, mitigates risks, and supports efficient IT management within organizations.
Monitoring Citrix is crucial for several reasons:
No, it doesn’t. PRTG is not just the perfect tool for monitoring your Citrix environment. It is also entirely compatible with the virtualization software of other manufacturers. Whether VMware, Microsoft Hyper-V, or HP Enterprise Virtual Array – PRTG comes with predefined sensors which make the monitoring of virtual servers nothing short of child’s play. We work hard on creating a solution with great user experience as well as the possibility to customize the software exactly to your needs.
In PRTG, “sensors” are the basic monitoring elements. One sensor usually monitors one measured value in your network, for example the traffic of a switch port, the CPU load of a server, or the free space on a disk drive. On average, you need about 5-10 sensors per device or one sensor per switch port.
Paessler conducted trials in over 600 IT departments worldwide to tune its network monitoring software closer to the needs of sysadmins. The result of the survey: over 95% of the participants would recommend PRTG – or already have.

Paessler PRTG is used by companies of all sizes. Sysadmins love PRTG because it makes their job a whole lot easier.
Bandwidth, servers, virtual environments, websites, VoIP services – PRTG keeps an eye on your entire network.
Everyone has different monitoring needs. That’s why we let you try PRTG for free.