• Company
    • About Us
    • Case Studies
    • Press Center
    • Events
    • Careers
    • Blog
    • Contact us
  • Contact us
  • Login
 
  • English
    • Deutsch
    • Español
    • Français
    • Italiano
    • Português
Paessler
                    - The Monitoring Experts
  • Products
    • Paessler PRTG
      Paessler PRTGMonitor your whole IT infrastructure
      • PRTG Network Monitor
      • PRTG Enterprise Monitor
      • PRTG Hosted Monitor
      • PRTG extensionsExtensions for Paessler PRTGExtend your monitoring to a new level
    • Icon Features
      FeaturesExplore all monitoring features
      • Maps & dashboards
      • Alerts & notifications
      • Multiple user interfaces
      • Distributed monitoring
      • Customizable reporting
  • Solutions
    • Industries
      IndustriesMonitor various industry sectors
      • Industrial
      • Healthcare
      • Data Center
      • Education
      • Finance
      • Government
    • IT Topics
      IT TopicsMonitor all areas of IT
      • Network Monitoring
      • Bandwidth Monitoring
      • SNMP Monitor
      • Network Mapping
      • WiFi Monitoring
      • Server Monitoring
  • Pricing
  • Resources
    • Getting Started
      Getting StartedModules for self-paced learning
    • How-to Guides
      How-to GuidesGet the most out of PRTG
    • Videos & Webinars
      Videos & WebinarsLearn from Paessler experts
    • IT  Knowledge
      IT KnowledgeExpand your IT knowledge
    • PRTG Manual
      PRTG ManualFull documentation
    • Knowledge Base
      Knowledge BaseShare community knowledge
    • PRTG Sensor Hub
      PRTG Sensor HubGet sensors, scripts & templates
    • Trainings
      PRTG TrainingLearn how to work with PRTG
  • Partners
    • icon star
      New Partners and MSPBecome a new partner or MSP
    • icon partner
      Partner PortalLog in to your partner account
    • icon search
      Find a PartnerFind partners selling Paessler products
    • icon technology
      Technology AlliancesSee Paessler technology partnerships
  • Company
    • About Us
    • Case Studies
    • Press Center
    • Events
    • Careers
    • Blog
    • Contact us
  • Contact us
  • Login
  • English
    • Deutsch
    • Español
    • Français
    • Italiano
    • Português
  • Get a quote
  • Free trial
  1. Home>
  2. IT Topics>
  3. Security>
  4. Fortinet Analyzer
PRTG Logo

Fortinet Analyzer with PRTG

Easily integrate Fortinet security solutions into your network monitoring

  • A unified monitoring solution to keep an eye on all your Fortinet products
  • Out-of-the-box insights into the health and security of your FortiGate firewalls
  • Instant alerts to avoid performance bottlenecks and network security issues
Free download
product overview

Our users give top ratings for monitoring with Paessler PRTG

Gartner peer insights
spiceworks
Capterra
G2
Trustpilot

PRTG Fortinet analyzer: What you will find on this page

Table of content
  • Get the most out of your Fortinet solutions with PRTG
  • 3 benefits of integrating Fortinet into PRTG
  • What Fortinet analysis looks like in PRTG
  • Explore our preconfigured PRTG sensors for FortiGate monitoring
  • Fortinet Analyzer: FAQ

PRTG makes Fortinet infrastructure monitoring as easy as it gets

Custom alerts and data visualization let you quickly identify and prevent performance and security issues in your Fortinet environment.

Free download
PRODUCT OVERVIEW

Get the most out of your Fortinet solutions with PRTG

Benefit most from Fortinet’s security services by using an automated network monitoring tool like Paessler PRTG that ensures that everything is working perfectly.

When something goes wrong, PRTG will quickly alert you so you can take care of the problem and avoid cybersecurity risks or performance bottlenecks. PRTG helps guarantee you are enjoying all the benefits of Fortinet while delivering the best ROI possible.

Table of content

3 benefits of integrating Fortinet into PRTG

Icon centralized monitoring

Multi-protocol integration


Fortinet supports various technologies such as SNMP, NetFlow, SNMP traps, and syslog on their network devices so that it’s easy to integrate them into your monitoring environment.

  • SNMP enables you to get information about availability, performance, and network traffic of your devices, plus the status and performance of your servers.
  • NetFlow lets you analyze bandwidth consumption in detail.
  • SNMP traps keep you informed about critical aspects of the device or service, such as internal high temperatures.
  • Syslog helps you stay up to date on critical events that the device detects, like changes on the configuration of the device.
Icon sensor

Built-in FortiGate sensors


PRTG comes with sensors for out-of-the-box monitoring of your FortiGate firewalls to keep track of  system health metrics and VPN connections:

  • The FortiGate System Statistics sensor monitors CPU and memory usage, sessions, uptime, as well as the conserver mode of a FortiGate device.
  • The FortiGate VPN Overview sensor monitors VPN connections of the FortiGate system such as the number of connected SSL clients.

You can also easily create custom sensors to monitor your Fortinet devices the way you want, since Fortinet has excellent documentation of their MIB files.

Icon alarm bell

Custom alerting and reports


With PRTG, you can see the status of all your Fortinet devices at a glance, in a single pane of glass. Receive instant alerts via SMS, email, push notification, and more about any availability or security issue detected by the Fortinet solutions.

Plus, you can take granular control of Fortinet traffic to avoid performance bottlenecks, and you’ll always know how the Fortinet solution interacts with other network components.

What’s more: PRTG’s customizable report templates allow you to generate reports at different levels of detail. Build, for example, a time frame report containing analytic information to observe behavior patterns, detect unusual behavior, and predict any resource saturation.

What Fortinet analysis looks like in PRTG

Diagnose network issues by continuously tracking the health, performance, and security of your Fortinet devices and other endpoints. Show high availability, data traffic, hardware parameters, critical events, and other key performance metrics in real time. Visualize network performance monitoring data in clear topology maps and dashboards to identify problems more easily. Gain the overview you need to troubleshoot all kinds of issues in your Fortinet ecosystem.

PRTG screenshot graph live data traffic

Live traffic data graph in PRTG

PRTG Screenshot device tree view

Device tree view of the complete monitoring setup

PRTG screenshot map entire it infrastructure

Custom PRTG dashboard for keeping an eye on the entire IT infrastructure

PRTG screenshot graph live data traffic

Live traffic data graph in PRTG

PRTG Screenshot device tree view

Device tree view of the complete monitoring setup

Start analyzing Fortinet devices with PRTG and see how it can make your network more reliable and your job easier.

Free download
PRODUCT OVERVIEW

IT experts agree: Paessler PRTG is a great solution for IT infrastructure monitoring

PCMag

“All-around winning
 network monitor”

IT Brief

“The real beauty of PRTG is the endless possibilities it offers”

ITPro

“PRTG Network Monitor 
is very hard to beat”

Explore our preconfigured PRTG sensors for FortiGate monitoring

PRTG comes with more than 250 native sensor types for monitoring your entire on-premises, cloud, and hybrid cloud environment out of the box. Check out some examples below!

FortiGate System Statistics

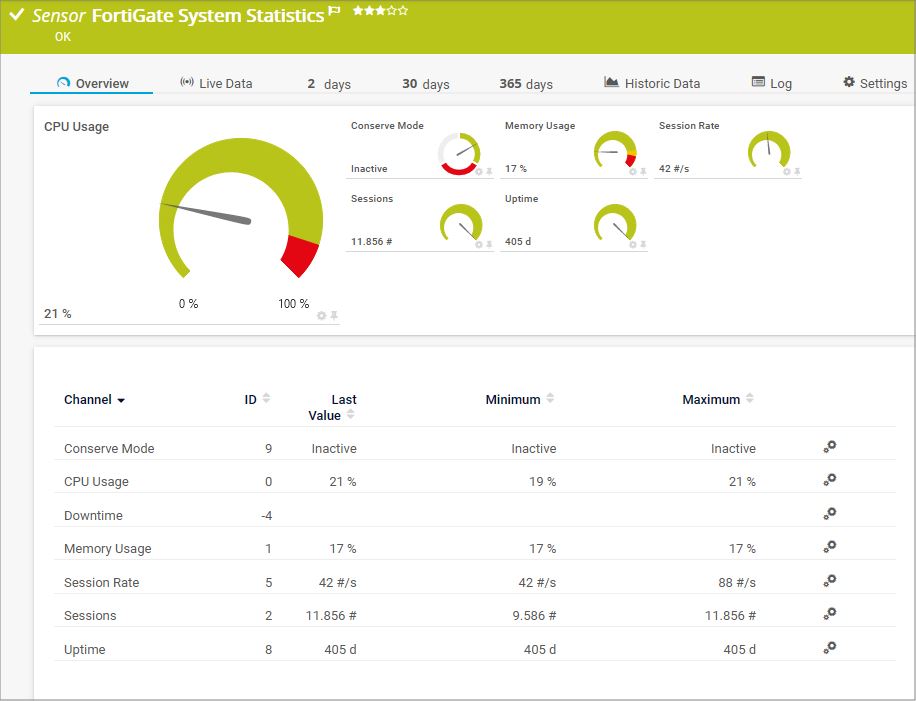
The FortiGate System Statistics sensor monitors the system health of a Fortinet FortiGate firewall. It can show the following:

  • Conserve mode status
  • CPU usage
  • Memory usage
  • (Total) number of sessions
  • Uptime
FortiGate System Statistics

FortiGate VPN Overview

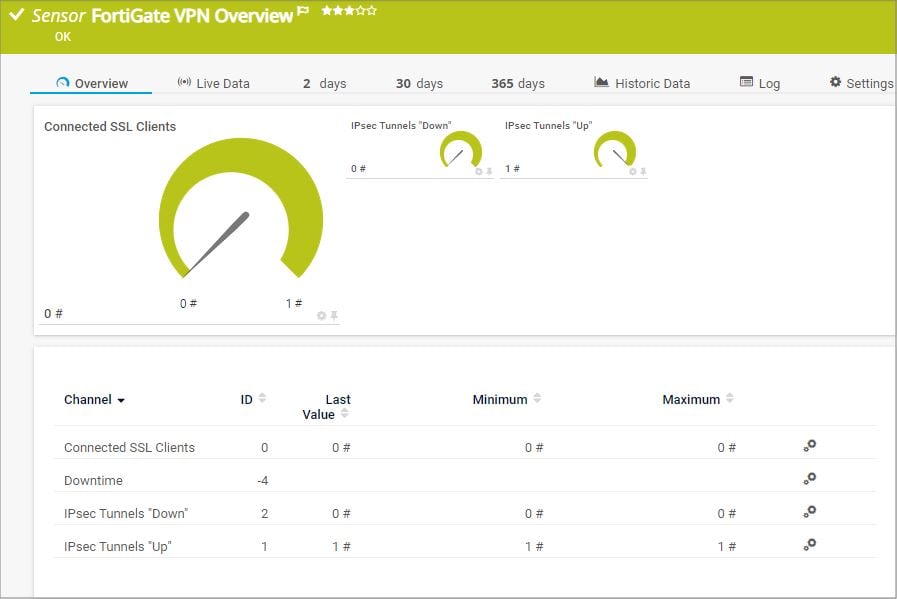
The FortiGate VPN Overview sensor monitors the virtual private network (VPN) connections of a Fortinet FortiGate system. It can show the following:

  • Number of SSL clients that are connected
  • Number of IPsec tunnels that are down
  • Number of IPsec tunnels that are up
FortiGate VPN Overview

Syslog Receiver

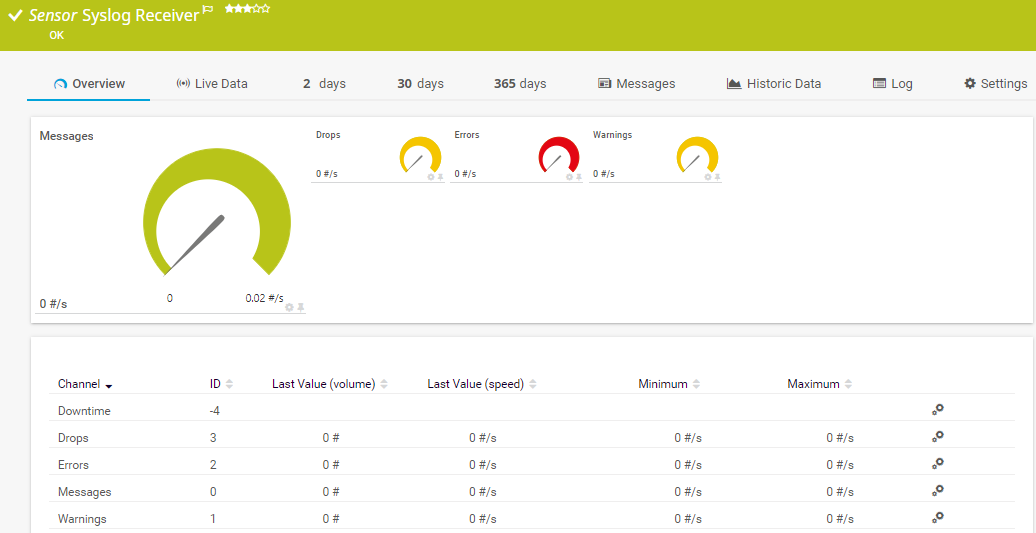
The Syslog Receiver sensor receives and analyzes Syslog messages. It can show the following:

  • Number of dropped packets on the syslog port
  • Number of messages categorized as "error" and “warning”
  • Number of received Syslog messages
Syslog Receiver
Syslog Receiver

NetFlow v9

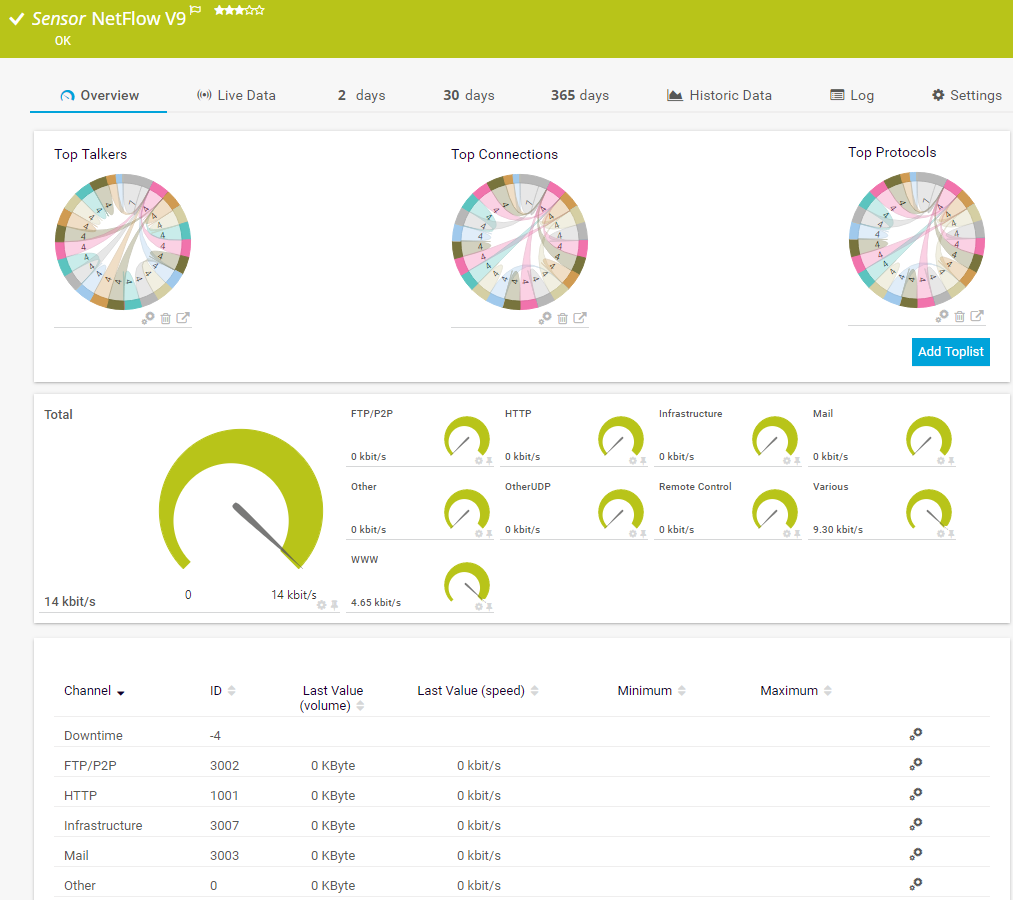
The NetFlow v9 sensor receives traffic data from a NetFlow v9-compatible device and shows the traffic by type. This sensor has several filter options to divide traffic into different channels. It can show the following and more:

  • Traffic from Citrix applications
  • Traffic from file transfer (FTP/P2P) and various other protocols (UDP, TCP)
  • Traffic from network services (DHCP, DNS, Ident, ICMP, SNMP)
  • Internet mail traffic (IMAP, POP3, SMTP)
  • Traffic from remote control applications (RDP, SSH, Telnet, Virtual Network Computing (VNC))
NetFlow v9
NetFlow v9

See the PRTG Manual for a list of all available sensor types.

PRTG is compatible with all major vendors, products, and systems

compatible with all major vendors, products, and systems

PRTG makes Fortinet infrastructure monitoring as easy as it gets

Custom alerts and data visualization let you quickly identify and prevent performance and security issues in your Fortinet environment.

Free download
PRODUCT OVERVIEW

“The best thing about PRTG is that it provides for simple and effective monitoring, all the while respecting the security requirements of manufacturers. PRTG is so easy to use, that many of our monitoring tasks are now handled by our interns. We will definitely expand our use of the software in the future.”

Karsten Boettger, Head of IT
LAKUMED Clinics

”PRTG helps us monitor critical security systems to give customers the peace of mind that their devices are operational and protecting their valuable assets.”

Rob Jackson, President
Integrated Precision Systems

“When it comes to security, we do of course use classic tools such as firewalls, virus scanners, and intrusion detection systems. However, these are no longer enough today. PRTG provides for additional security by detecting unusual behavior which may be a sign that a hacker has outsmarted our security systems.”

Damir Karacic, IT Administrator
Noris Inklusion

“Monitoring with PRTG is crucial for security. Today’s threats can move low and slow, so in addition to looking at the usual suspects, you also need to keep tabs on other indicators. For example, if a server is running a peak capacity for no apparent reason, you want to know so you can take a look and see what’s up – for example an open connection that is being used to extract data in a ransomware attack.”

Jon Larsen, CIO
Richweb

“The best thing about PRTG is that it provides for simple and effective monitoring, all the while respecting the security requirements of manufacturers. PRTG is so easy to use, that many of our monitoring tasks are now handled by our interns. We will definitely expand our use of the software in the future.”

Karsten Boettger, Head of IT
LAKUMED Clinics

”PRTG helps us monitor critical security systems to give customers the peace of mind that their devices are operational and protecting their valuable assets.”

Rob Jackson, President
Integrated Precision Systems

Your Fortinet monitor at a glance – even on the go

PRTG is set up in a matter of minutes and can be used on a wide variety of mobile devices.

device overview
Gartner peer insights

“Excellent tool for detailed monitoring. Alarms and notifications work greatly. Equipment addition is straight forward and server initial setup is very easy. ...feel safe to purchase it if you intend to monitor a large networking landscape.”

Read the complete review at Gartner Peer Insights

Create innovative solutions with Paessler’s IT partners

Partnering with innovative IT vendors, Paessler unleashes synergies to create
new and additional benefits for joined customers.

baramundi

baramundi

baramundi and PRTG create a secure, reliable and powerful IT infrastructure where you have everything under control - from the traffic in your firewall to the configuration of your clients.

Read more
INSYS icom

INSYS icom

With the combination of PRTG and Insys, the monitoring specialist Paessler and the industrial gateway manufacturer INSYS icom offer a practical possibility to merge IT and OT.

Read more
Siemon

Siemon

Siemon and Paessler bring together intelligent building technology and advanced monitoring and make your vision of intelligent buildings and data centers become reality.

Read more

Find the root cause of the problem with our PRTG Fortinet analyzer solution

Real-time notifications mean faster troubleshooting so that you can act before more serious issues occur.

Free download
PRODUCT OVERVIEW
Paessler PRTG

Paessler PRTG

Network Monitoring Software – Version 25.2.106.1114 (May 05th, 2025)

Hosting icon

Hosting

Download for Windows and cloud-based version PRTG Hosted Monitor available

Languages icon

Languages

English, German, Spanish, French, Portuguese, Dutch, Russian, Japanese, and Simplified Chinese

test

Monitor everything

Network devices, bandwidth, servers, applications, virtual environments, remote systems, IoT, and more

test

Pricing

Choose the PRTG Network Monitor subscription that's best for you

Discover more monitoring insights and stories

Resources Solution

Solutions for all your monitoring needs

  • Firewall analysis
  • Import MIB files into PRTG Network Monitor
  • Round-the-clock NAS system monitoring
Resources Content

Powerful stories from the monitoring world

  • Monitoring FortiGate Firewalls with Paessler PRTG
  • Using a Fortinet FortiGate as Reverse Proxy for PRTG: All the Config You Need
  • How to Securely Monitor a FortiGate Firewall with Paessler PRTG Network Monitor
Resources Solutions

Resources to master your monitoring challenges

  • Can't poll Fortigate with SNMP.
  • Unable to discover interfaces for Fortigate firewall
  • How to configure Fortigate SNMP traffic in PRTG ?

Fortinet Analyzer: FAQ


How can PRTG help with Fortinet monitoring?

As a Fortinet analyzer tool, PRTG integrates seamlessly with Fortinet devices to provide comprehensive insights into their performance, security, and functionality. For example, it monitors key metrics of Fortinet devices such as CPU usage, memory utilization, disk health, and uptime; tracks bandwidth usage, session counts, and traffic patterns across Fortinet firewalls and routers; and analyzes logs for intrusion attempts, failed logins, and other security-related events.

PRTG also supports Fortinet’s REST API for advanced data collection and interaction with Fortinet Security Fabric.

What are the benefits of monitoring Fortinet?

Monitoring Fortinet devices and solutions offers numerous benefits, especially in enhancing the security, performance, and operational efficiency of an organization's IT infrastructure:

  • Threat detection: Proactively identifies malicious activities, vulnerabilities, and anomalies across the network.
  • Real-time alerts: Provides instant notifications about security incidents, allowing for swift action to mitigate risks.
  • Correlation and analysis: Helps in correlating events across Fortinet devices to detect sophisticated attacks or unusual patterns.
  • Unified monitoring: Consolidates data from multiple Fortinet devices (firewalls, switches, access points) into a single dashboard for better visibility.
  • Simplified operations: Reduces the complexity of managing and monitoring multiple devices across different locations.
  • Network health monitoring: Tracks device performance metrics like CPU usage, bandwidth consumption, and session counts to ensure optimal operation.
  • Proactive issue resolution: Identifies potential performance bottlenecks or hardware issues before they escalate.
What is Fortinet?

Fortinet is a multinational corporation that provides cybersecurity solutions, including hardware, software, and services. The company’s portfolio includes:

  • FortiGate firewalls: Provides advanced threat protection through features like intrusion prevention systems (IPS), VPN, antivirus, and application control.
  • Security Fabric: Fortinet's integrated platform, called the Fortinet Security Fabric, connects various security components to provide a unified and automated defense across an organization.
  • Network security: Products include switches, access points, and secure SD-WAN solutions, enabling secure and efficient networking.
  • Cloud security: Solutions designed to protect cloud-based applications and environments, including SaaS, public, private, and hybrid clouds.
  • Endpoint and device security: Endpoint detection and response (EDR) tools for safeguarding devices against advanced threats.
  • Threat intelligence: FortiGuard Labs provides real-time threat intelligence to help its security solutions adapt to emerging cyber threats.
What is a sensor in PRTG?

In PRTG, “sensors” are the basic monitoring elements. One sensor usually monitors one measured value in your network, for example the traffic of a switch port, the CPU load of a server, or the free space on a disk drive. On average, you need about 5-10 sensors per device or one sensor per switch port.

We asked: would you recommend PRTG? Over 95% of our customers say yes!

Paessler conducted trials in over 600 IT departments worldwide to tune its network monitoring software closer to the needs of sysadmins. The result of the survey: over 95% of the participants would recommend PRTG – or already have.

recommendation

Still not convinced?

Love

More than 500,000 sysadmins love PRTG

Paessler PRTG is used by companies of all sizes. Sysadmins love PRTG because it makes their job a whole lot easier.

PRTG

Monitor your entire IT infrastructure

Bandwidth, servers, virtual environments, websites, VoIP services – PRTG keeps an eye on your entire network.

test

Try Paessler PRTG for free

Everyone has different monitoring needs. That’s why we let you try PRTG for free.

PRTG Logo

Start analyzing Fortinet devices with PRTG and see how it can make your network more reliable and your job easier.

Free download
PRODUCT OVERVIEW

Products

  • Paessler PRTG
    Paessler PRTGMonitor your whole IT infrastructure
    • PRTG Network Monitor
    • PRTG Enterprise Monitor
    • PRTG Hosted Monitor
    • PRTG extensions
      Extensions for Paessler PRTGExtend your monitoring to a new level
  • Icon Features
    FeaturesExplore all monitoring features

Monitoring with PRTG

  • Network monitoring
  • Bandwidth monitoring
  • SNMP monitoring
  • Network mapping
  • Wi-Fi monitoring
  • Server monitoring
  • Network traffic analyzer
  • NetFlow monitoring
  • Syslog server

Useful Links

  • PRTG Manual
  • Knowledge Base
  • Customer Success Stories
  • About Paessler
  • Subscribe to newsletter
  • PRTG Support
  • PRTG Consulting

Contact

Paessler GmbH
Thurn-und-Taxis-Str. 14, 
90411 Nuremberg 
Germany

info@paessler.com

+49 911 93775-0

  • Contact us
©2025 Paessler GmbHTerms & ConditionsPrivacy PolicyImprintReport VulnerabilityDownload & InstallSitemap
404 - Page not found 404 - Page not found 404 - Page not found