Custom alerts and data visualization let you quickly identify and prevent performance issues.
Human-Machine Interfaces (HMIs) are the gateway to your production environment. Whether they are web-based HMI screens or more advanced HMI touchscreens, operators can lose visibility and control over critical production processes if they are unavailable. HMI monitoring with Paessler PRTG helps keep your operations running efficiently:
Continuous monitoring of your HMIs gives you real-time insight into their status, helping you keep them operational. Not only that, but monitoring can help you proactively detect and address potential HMI issues before they cause downtime.
PRTG notifies you immediately when HMI issues occur and provides detailed diagnostics to help you find the root cause of problems quicker. This helps you reduce downtime and restore your systems faster.
Don't just monitor your HMIs in isolation. Understand how your HMIs are performing in the context of your entire infrastructure. PRTG gives you the capability to monitor your OT and IT environments and provides a holistic view of everything.
Monitor HMIs across different locations and production lines with a central solution, simplifying management of all your HMI systems. And the solution is scalable, letting you expand your HMI monitoring capabilities as your industrial operations grow.
Diagnose network issues by continuously tracking your HMIs. Show HMI status and other key metrics in real time. Visualize monitoring data in clear graphs and dashboards to identify problems more easily. Gain the overview you need to troubleshoot HMIs.

Device tree view of the complete monitoring setup

Custom PRTG dashboard for keeping an eye on the entire IT infrastructure

Live traffic data graph in PRTG
Awarded 3rd place in the
Software & IT category
Winner in the Software &
Computers category
PRTG provides a comprehensive set of features for HMI monitoring in industrial settings:
Track the response times, resource usage, and overall health of your HMIs. Create custom thresholds and alerts to detect performance issues proactively. Ensure that your operators always have access to critical control interfaces, even if a web panel fails.
Get instant notifications via email, SMS, or push notifications for critical HMI issues. Set up escalation procedures to ensure the right people are notified fast. Adjust alert thresholds to get notifications even before problems have occurred.
Build custom dashboards to visualize all essential aspects of your HMI systems from a central location. Identify trends and patterns in HMI performance over time. User-friendly dashboards make it easy to share real-time insights between different teams.
With OPC UA support, you can get monitoring data from industrial equipment like PLCs, SCADA systems, control systems, and more. Modbus TCP lets you monitor hardware like cooling units, power supplies and generators. MQTT gives you access to industrial IoT sensors on your plant floor.
PRTG comes with more than 250 native sensor types for monitoring your entire on-premises, cloud, and hybrid cloud environment out of the box. Check out some examples below!
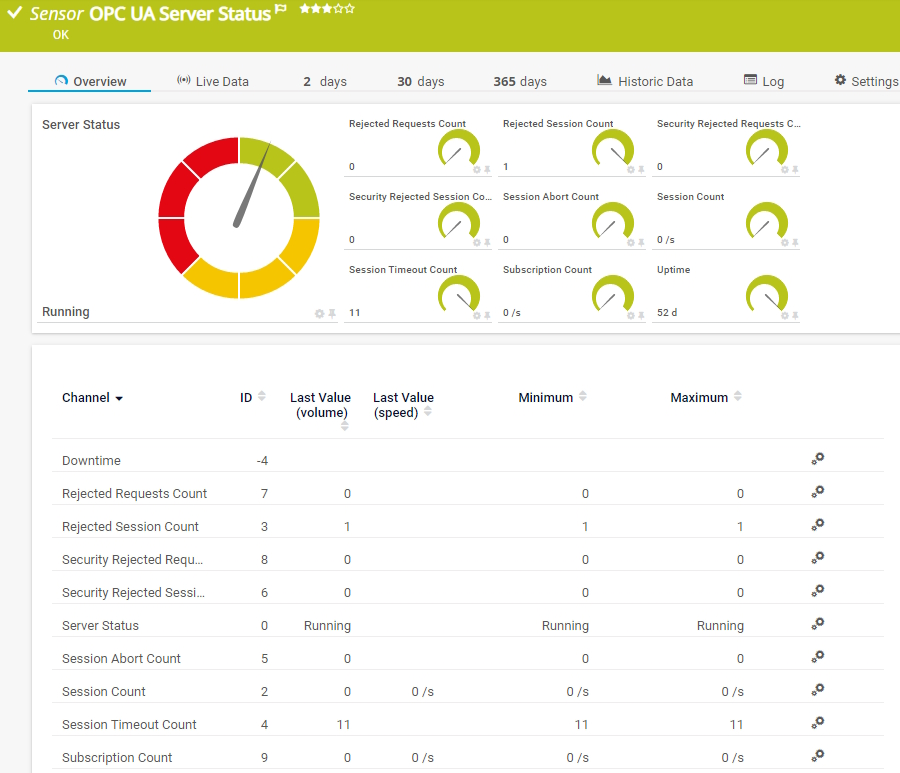
The OPC UA Server Status sensor monitors the server status, uptime, and diagnostic information of an OPC Unified Architecture (OPC UA) server. It can show the following:
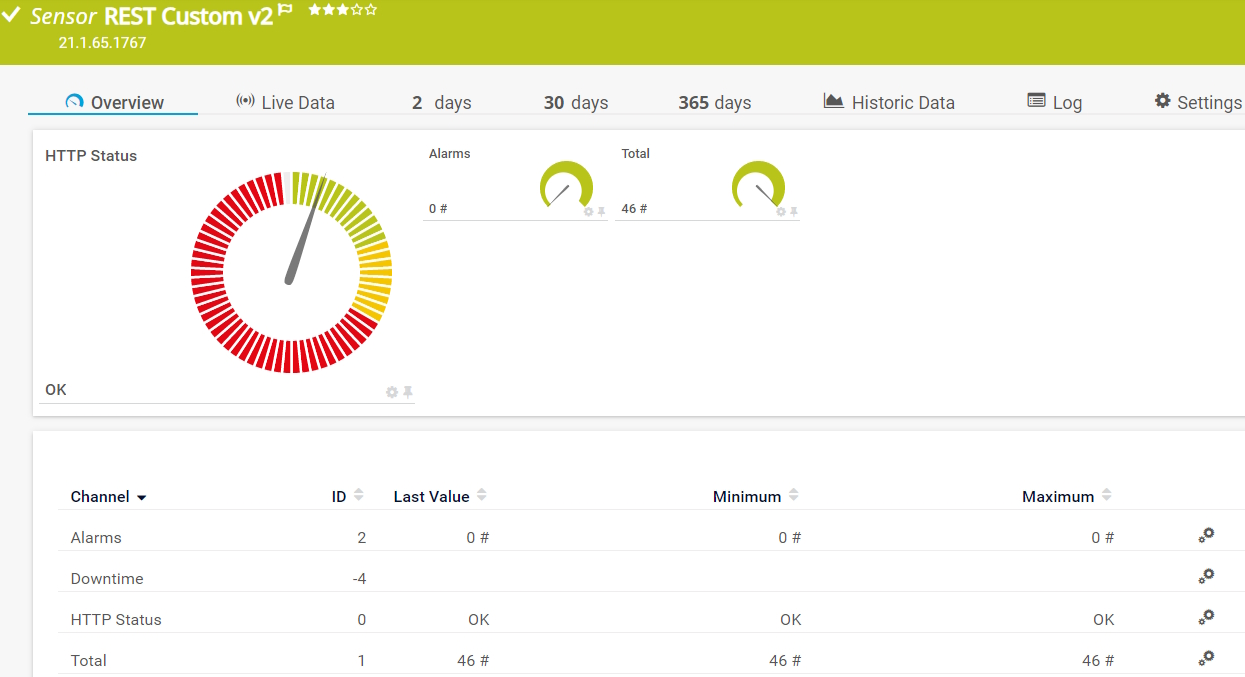
The REST Custom v2 sensor queries a REST API endpoint and maps the JSON or XML result to sensor values. It can show the following:
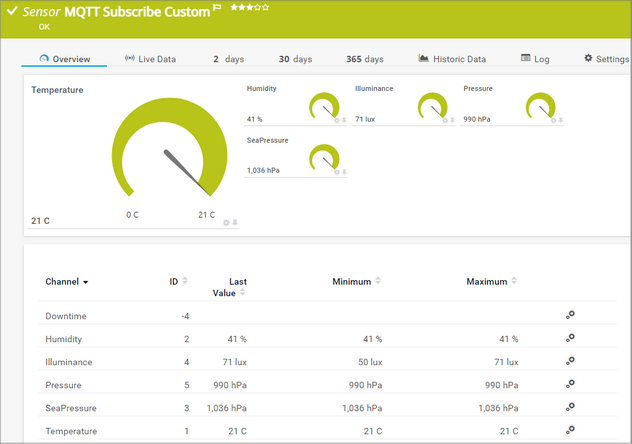
The MQTT Subscribe Custom sensor subscribes to a Message Queue Telemetry Transport (MQTT) topic and monitors up to ten numeric values from the received JSON data. It can show the following:
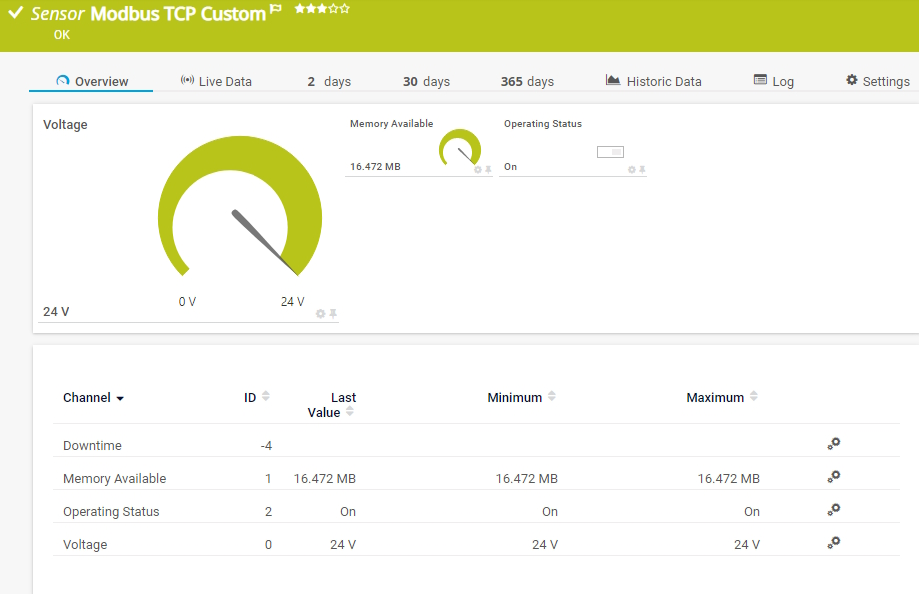
The Modbus TCP Custom sensor connects to a Modbus Transmission Control Protocol (TCP) server and monitors up to ten returned numeric values. It can show the following:
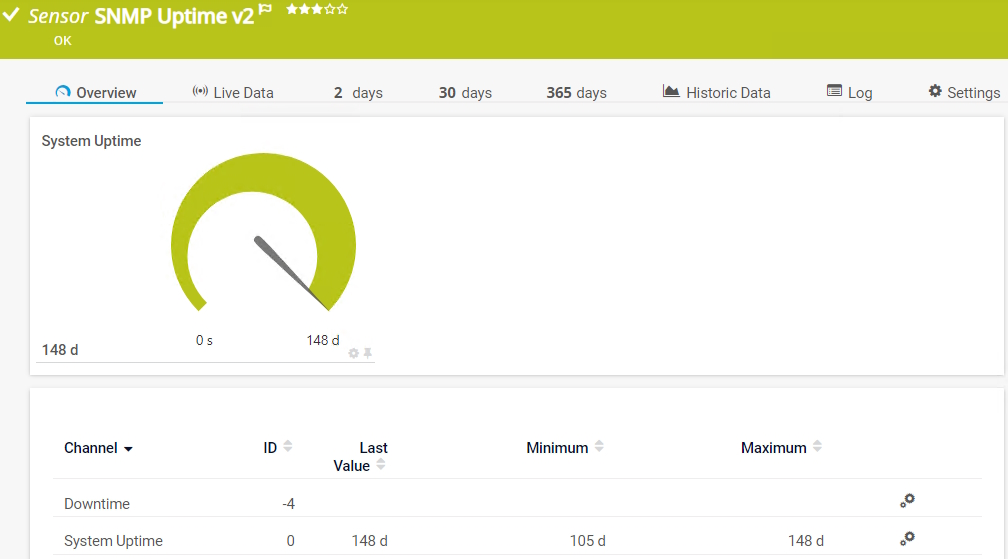
The SNMP Uptime v2 sensor monitors the uptime of a device. It can show the following:
See the PRTG Manual for a list of all available sensor types.
Real-time notifications mean faster troubleshooting so that you can act before more serious issues occur.

PRTG is a high-performance monitoring solution that can handle more than just the HMIs on your factory floor.
Collect real-time data from your entire industrial network, including ethernet network devices, industrial IoT sensors, SCADA systems, control systems, and more to get instant insights into operational performance.
Monitor across IT and operational technology, helping you maintain consistent output and quality across your industrial processes.
Bridge the gap between information technology and operational technology by monitoring both traditional network infrastructure and industrial control systems through a single platform.
Connect directly to OPC UA-enabled devices without additional software, making it easy to monitor industrial equipment from various manufacturers in your control systems.
Custom alerts and data visualization let you quickly identify and prevent performance issues.
PRTG is set up in a matter of minutes and can be used on a wide variety of mobile devices.

Partnering with innovative IT vendors, Paessler unleashes synergies to create
new and additional benefits for joined customers.
Integrating monitoring results from PRTG into NetBrain maps makes the foundation for network automation.
With the combination of PRTG and Insys, the monitoring specialist Paessler and the industrial gateway manufacturer INSYS icom offer a practical possibility to merge IT and OT.
With ScriptRunner Paessler integrates a powerful event automation platform into PRTG Network Monitor.
Real-time notifications mean faster troubleshooting so that you can act before more serious issues occur.
Network Monitoring Software – Version 25.3.110.1313 (August 27, 2025)
Download for Windows and cloud-based version PRTG Hosted Monitor available
English, German, Spanish, French, Portuguese, Dutch, Russian, Japanese, and Simplified Chinese
Network devices, bandwidth, servers, applications, virtual environments, remote systems, IoT, and more
Choose the PRTG Network Monitor subscription that's best for you
A Human-Machine Interface (HMI) is where operators interact with complex industrial systems. HMIs convert data from Programmable Logic Controllers (PLCs) and other control systems into visual displays, usually with a graphical user interface, making it easier to manage manufacturing and control processes. The HMI software can reside either on the HMI panel itself, or as a web-based solution.
HMIs are crucial for modern manufacturing because they:
PRTG constantly monitors HMI performance and alerts you to potential issues before they cause system failures. This allows for proactive maintenance and reduces unexpected downtime.
Yes, PRTG's design allows you to monitor HMIs across various sites and production facilities from a single, central dashboard. It’s also suitable for remote monitoring.
Yes, PRTG offers broad compatibility with a wide range of industrial automation tools. Here are some examples:
By integrating PRTG with your existing industrial automation tools, you gain a centralized monitoring solution that provides comprehensive visibility into your entire industrial IT infrastructure. This enables you to proactively identify potential issues, optimize performance, and ensure the smooth operation of your production processes.
In PRTG, “sensors” are the basic monitoring elements. One sensor usually monitors one measured value in your network, for example the traffic of a switch port, the CPU load of a server, or the free space on a disk drive. On average, you need about 5-10 sensors per device or one sensor per switch port.
Paessler conducted trials in over 600 IT departments worldwide to tune its network monitoring software closer to the needs of sysadmins. The result of the survey: over 95% of the participants would recommend PRTG – or already have.

Paessler PRTG is used by companies of all sizes. Sysadmins love PRTG because it makes their job a whole lot easier.
Bandwidth, servers, virtual environments, websites, VoIP services – PRTG keeps an eye on your entire network.
Everyone has different monitoring needs. That’s why we let you try PRTG for free.