• Company
    • About Us
    • Case Studies
    • Press Center
    • Events
    • Careers
    • Blog
    • Contact us
  • Contact us
  • Login
 
  • English
    • Deutsch
    • Español
    • Français
    • Italiano
    • Português
Paessler
                    - The Monitoring Experts
  • Products
    • Paessler PRTG
      Paessler PRTGMonitor your whole IT infrastructure
      • PRTG Network Monitor
      • PRTG Enterprise Monitor
      • PRTG Hosted Monitor
      • PRTG extensionsExtensions for Paessler PRTGExtend your monitoring to a new level
    • Icon Features
      FeaturesExplore all monitoring features
      • Maps & dashboards
      • Alerts & notifications
      • Multiple user interfaces
      • Distributed monitoring
      • Customizable reporting
  • Solutions
    • Industries
      IndustriesMonitor various industry sectors
      • Industrial
      • Healthcare
      • Data Center
      • Education
      • Finance
      • Government
    • IT Topics
      IT TopicsMonitor all areas of IT
      • Network Monitoring
      • Bandwidth Monitoring
      • SNMP Monitor
      • Network Mapping
      • WiFi Monitoring
      • Server Monitoring
  • Pricing
  • Resources
    • Getting Started
      Getting StartedModules for self-paced learning
    • How-to Guides
      How-to GuidesGet the most out of PRTG
    • Videos & Webinars
      Videos & WebinarsLearn from Paessler experts
    • IT  Knowledge
      IT KnowledgeExpand your IT knowledge
    • PRTG Manual
      PRTG ManualFull documentation
    • Knowledge Base
      Knowledge BaseShare community knowledge
    • PRTG Sensor Hub
      PRTG Sensor HubGet sensors, scripts & templates
    • Trainings
      PRTG TrainingLearn how to work with PRTG
  • Partners
    • icon star
      New Partners and MSPBecome a new partner or MSP
    • icon partner
      Partner PortalLog in to your partner account
    • icon search
      Find a PartnerFind partners selling Paessler products
    • icon technology
      Technology AlliancesSee Paessler technology partnerships
  • Company
    • About Us
    • Case Studies
    • Press Center
    • Events
    • Careers
    • Blog
    • Contact us
  • Contact us
  • Login
  • English
    • Deutsch
    • Español
    • Français
    • Italiano
    • Português
  • Get a quote
  • Free trial
  1. Home>
  2. IT Topics>
  3. Hardware>
  4. Hardware Scanner
PRTG Logo

Hardware Scanner with PRTG

Leave heart-stopping hardware hiccups behind with regular hardware scans

  • Uncover potential hardware issues before they escalate
  • Gain insights into hardware status, health, and performance
  • Monitor hardware configurations and vulnerabilities for security
Free download
product overview

Our users give top ratings for monitoring with Paessler PRTG

Gartner peer insights
spiceworks
Capterra
G2
Trustpilot

PRTG hardware scanner: What you will find on this page

Table of content
  • Fortify and streamline your digital backbone with thorough hardware assessments
  • What hardware scanning looks like in PRTG
  • 5 reasons to choose PRTG as your hardware scanner
  • Preconfigured PRTG sensors for hardware scans
  • Hardware scanner: FAQ

PRTG makes hardware scans as easy as it gets

Custom alerts and data visualization let you quickly identify and prevent hardware and system health issues.

Free download
PRODUCT OVERVIEW

Fortify your digital backbone with thorough hardware assessments

Ensuring the smooth operation of your IT hardware is akin to keeping the gears oiled in a complex machine – it's essential for the seamless progress of your business. With the sheer complexity and variety of hardware devices that make up today's IT environments, from servers and switches to routers and firewalls, keeping everything running smoothly is no small feat. Enter Paessler PRTG's hardware scanning capabilities – your round-the-clock guard and optimizer for your entire IT infrastructure. 

Icon Search

Discover & diagnose devices with surgical precision

Take it easy and let our hardware scanner effortlessly zero in on and remedy issues across your assortment of hardware.

PRTG's hardware scanning shines by employing SNMP, WMI, SSH, and custom sensors to offer deep insights into the status and performance of your hardware.

Catch early warnings of trouble, from unexpected temperature shifts to components on the brink, enabling timely maintenance and minimizing operational pauses.

Icon Tools

Tailor monitoring to fit your unique infrastructure

PRTG's adaptable configuration empowers you to tailor monitoring to exactly suit your operational needs – for that perfect fit.

Fine-tune the warning and error thresholds of hardware sensors with simplicity to monitor the vitals critical to your enterprise.

Whether adapting to peak usage periods or specific device types, PRTG hands you the reins to focus on the most crucial facets of your network.

Icon Lock

Simplify management and lock down security

Streamline your IT operations and bolster your security posture with PRTG’s sensor-driven scanning.

By consolidating your monitoring efforts under one roof, you eliminate the hassle of juggling multiple tools and reduce potential security gaps.

PRTG's secure architecture and encrypted communications ensure your monitoring activities are shielded from prying eyes.

Icon Alarm

Anticipate nerve-wracking issues with real-time alerts

Minimize heart-stopping disruptions with PRTG's predictive alerting system.

Set up customized notifications to alert you to potential hardware issues before they balloon into critical challenges – and rest assured that if there’s no alert, everything’s running as expected.

Whether through email, SMS, push notifications, or other methods, stay informed and ready to act, no matter where you are.

What hardware diagnostics looks like in PRTG

Diagnose network issues by continuously tracking your hardware devices and components such as routers, switches, printers, workstations, motherboards, or PC hardware. Show hardware scan results and system information in real time. Visualize monitoring data in clear graphs and dashboards to identify problems more easily. Gain the overview you need to troubleshoot the health of your systems and devices.

PRTG Screenshot device tree view

Device tree view of the complete monitoring setup

PRTG screenshot map entire it infrastructure

Custom PRTG dashboard for keeping an eye on the entire IT infrastructure

PRTG screenshot graph live data traffic

Live traffic data graph in PRTG

Map hardware monitoring

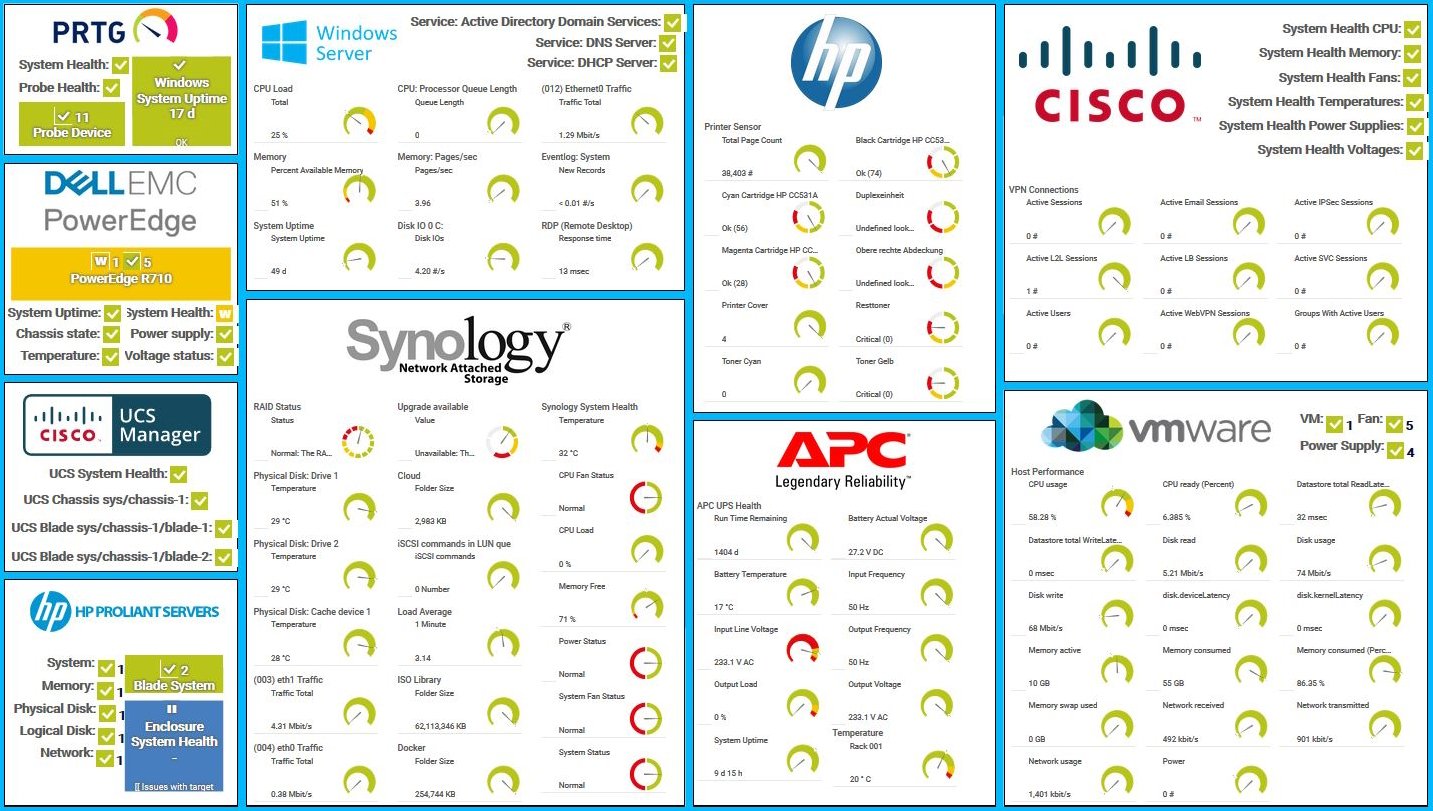
Custom PRTG dashboard for hardware devices


Start scanning your system and hardware health with PRTG and see how it can make your network more reliable and your job easier

Free download
PRODUCT OVERVIEW

IT experts agree: Paessler PRTG is a great solution for IT infrastructure monitoring

PCMag

“All-around winning
 network monitor”

IT Brief

“The real beauty of PRTG is the endless possibilities it offers”

ITPro

“PRTG Network Monitor 
is very hard to beat”

5 reasons to choose PRTG as your hardware scanner

Comprehensive scope

Covering everything from servers to networking gear, PRTG offers an all-encompassing snapshot of your hardware's health and performance, leaving no stone unturned – including inventory management.

Immediate insights

Gain on-the-spot updates on your hardware's condition with real-time data and dynamic visuals, enabling quick action on emerging issues.

Tailored monitoring

Shape PRTG to fit the exact requirements of your infrastructure, with a wide range of sensor and alert customization possibilities.

Hassle-free setup

PRTG is crafted for swift deployment and user-friendliness, allowing for immediate monitoring start-up without the typical setup headaches.

Proactive alerting

With PRTG's advanced alerting features, stay ahead of potential problems and tackle them before they affect your workflow. 

Explore our preconfigured PRTG sensors for hardware scans

PRTG comes with more than 250 native sensor types for monitoring your entire on-premises, cloud, and hybrid cloud environment out of the box. Check out some examples below!

SNMP Hardware Status

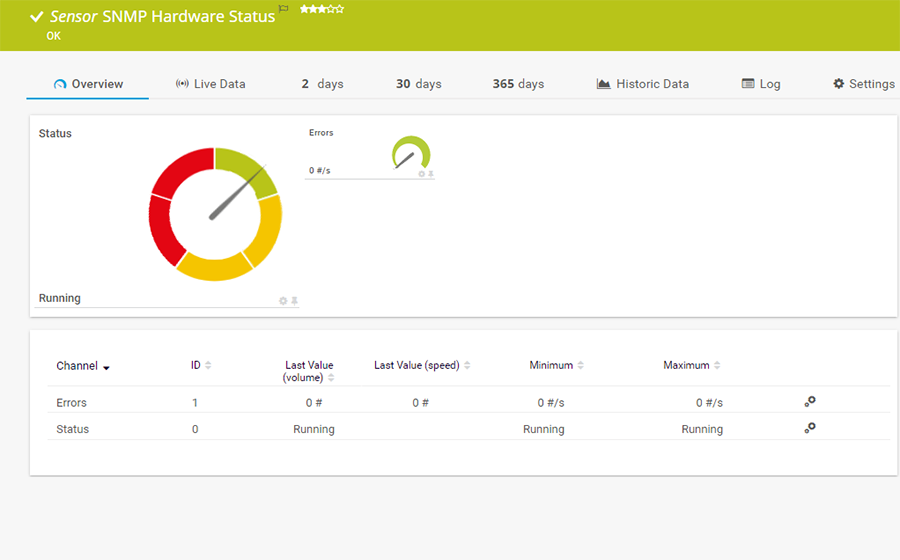
The SNMP Hardware Status sensor monitors the status of a server's hardware component. It can show the following:

  • Number of errors
  • Hardware component status
SNMP Hardware Status

SNMP APC Hardware

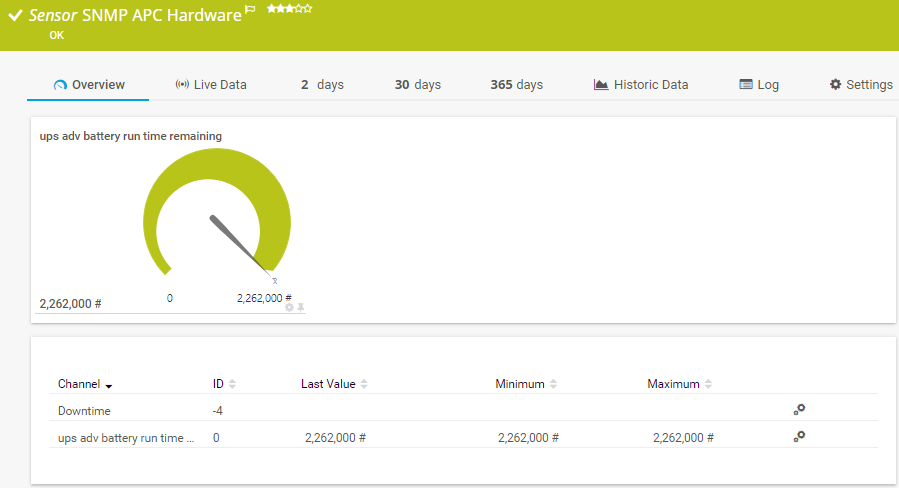
The SNMP APC Hardware sensor monitors performance counters on an APC UPS device. It can show the following:

  • Performance counters on an APC UPS device
  • Actual voltage and temperature of battery
  • Capacity and remaining runtime of battery
  • Input and output frequency and voltage
  • Output load
SNMP APC Hardware
SNMP APC Hardware

SNMP Dell Hardware

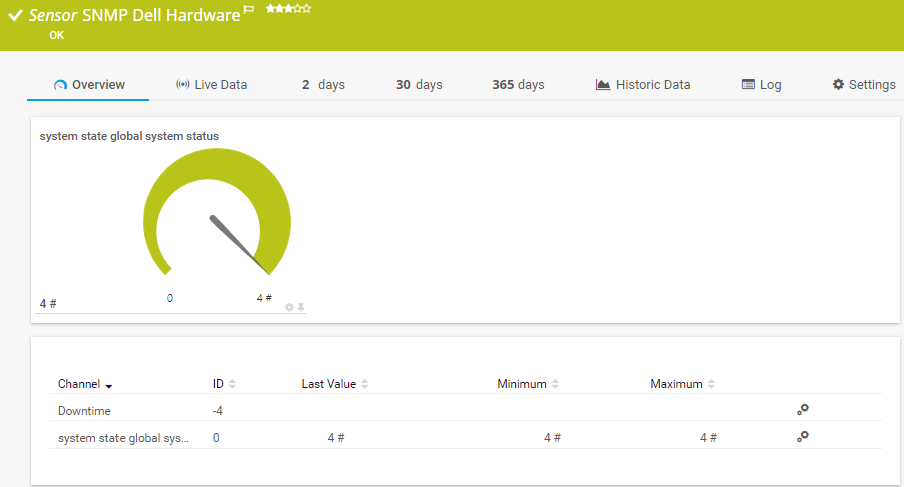
The SNMP Dell Hardware sensor monitors performance counters on a Dell hardware device. It can show the following:

  • Value returned by a specific Dell hardware OID, for example
  • Data about the system management software
  • System status
  • Information about chassis and BIOS
  • Various hardware parameters
SNMP Dell Hardware
SNMP Dell Hardware

VMware Host Hardware (WBEM)

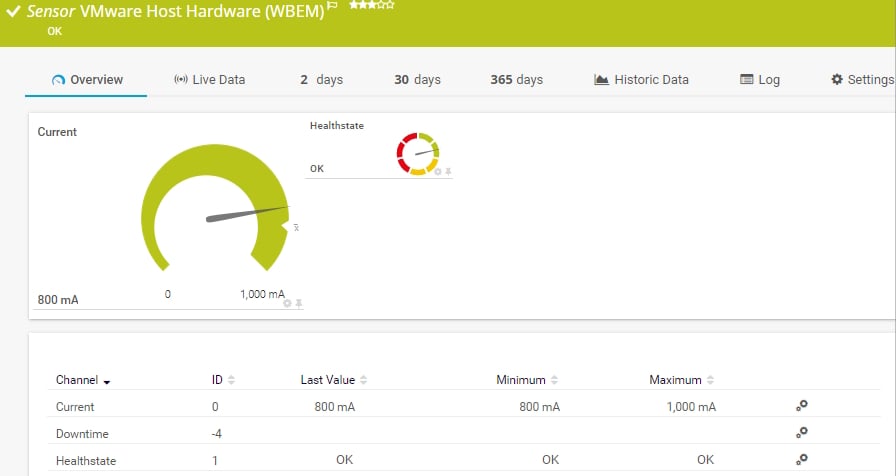
The VMware Host Hardware (WBEM) sensor monitors information about the hardware of an ESXi server using Web-based Enterprise Management (WBEM). It can show the following:

  • The current
  • Health status
  • Average host power status
  • Fan RPM
  • Temperature
Mware Host Hardware (WBEM

See the PRTG Manual for a list of all available sensor types.

Find the root cause of the problem with our PRTG hardware scanner tool

Real-time notifications mean faster troubleshooting so that you can act before more serious issues occur.

Free download
PRODUCT OVERVIEW

PRTG is compatible with all major vendors, products, and systems

compatible with all major vendors, products, and systems

How hardware scans with PRTG work

PRTG uses diagnostic tools to scan or poll your hardware devices via specific protocols to gather the relevant data. Get preconfigured, vendor-specific hardware sensors out of the box, or choose more generic or even custom sensors for all types of hardware from all kinds of manufacturers, keeping an eye on many different hardware parameters.


Hardware components
  • Servers
  • Routers
  • Switches
  • Firewalls
  • Workstations
  • Enclosures
  • And more
Vendors & manufacturers
  • Dell
  • HPE
  • Cisco
  • NetApp
  • SonicWall
  • Microsoft
  • Fortinet
  • And more
Hardware parameters
  • CPU load
  • Temperature
  • Power supply
  • Battery status
  • Disk space
  • Fan rotation
  • And more

Start scanning your system and hardware health with PRTG and see how it can make your network more reliable and your job easier.

Free download
PRODUCT OVERVIEW

“From a server perspective, we're monitoring all of the key components of our service such as CPU usage, RAM disk space, the Windows services that it's running, and network connectivity of that server. In terms of networks, we’re monitoring all of our switches, firewalls, and access points. It’s really useful to be able to easily pull performance metrics from the PRTG dashboard.”

Ollie Kerslake, Infrastructure Lead
Riverford Organic Farmers

“The tool has given us greater control over all types of devices connected to the network (switches, IP telephony, security cameras, IoT, WiFi) that previously remained opaque when dealing with service incidents. This has improved our ability to diagnose and resolve problems, which has translated into greater efficiency and a better user experience in both internal and public services.”

Jordi Tolosà Bel, New Technologies Technician
Vinaroz City Council

“Our objective was to be able to monitor the health of our most critical servers containing data and applications, but also the flows and bandwidth between headquarters, our 50 servers in the cloud and the 15 servers at our production sites. For us, it is essential to have a proactive approach to understand where the weaknesses of the IT system are to be able to improve them.”

Marc Boullier, CIO
Carambar & Co

Your hardware scanner at a glance – even on the go

PRTG is set up in a matter of minutes and can be used on a wide variety of mobile devices.

device overview
HPE

We are an HPE Technology Partner

Hewlett Packard Enterprises and Paessler are collaborating in a fresh new way to bring increased value to you as our customer.

What does this mean for you?

  • Easy integration of HPE hardware and software with PRTG
  • State-of-the-art features for monitoring your HPE environment
  • Expert technical support around your HPE monitoring setup

Create innovative solutions with Paessler’s IT partners

Partnering with innovative IT vendors, Paessler unleashes synergies to create
new and additional benefits for joined customers.

Plixer

Plixer

Paessler and Plixer provide a complete solution adding flow and metadata analysis to a powerful network monitoring tool.

Read more
Osirium

Osirium

Osirium’s experienced management team has an outstanding track record in cybersecurity and automation, establishing its headquarters near Reading, UK.

Read more
NetBrain

NetBrain

Integrating monitoring results from PRTG into NetBrain maps makes the foundation for network automation.

Read more

PRTG makes hardware scans as easy as it gets

Custom alerts and data visualization let you quickly identify and prevent hardware and system health issues.

Free download
PRODUCT OVERVIEW
Paessler PRTG

Paessler PRTG

Network Monitoring Software – Version 24.4.102.1351 (November 12th, 2024)

Hosting icon

Hosting

Download for Windows and cloud-based version PRTG Hosted Monitor available

Languages icon

Languages

English, German, Spanish, French, Portuguese, Dutch, Russian, Japanese, and Simplified Chinese

test

Monitor everything

Network devices, bandwidth, servers, applications, virtual environments, remote systems, IoT, and more

test

Pricing

Choose the PRTG Network Monitor subscription that's best for you

Discover more monitoring insights and stories

Resources Solution

Solutions for all your monitoring needs

  • The monitoring solution for all areas of IT!
  • Port scanner PRTG
  • IP scanner
Resources Content

Powerful stories from the monitoring world

  • Get more visibility of VMware ESXi: Metrics you should be monitoring
  • Monitor Dell PowerEdge servers
  • The ultimate guide to boosting your PRTG performance
Resources Solutions

Resources to master your monitoring challenges

  • System Information
  • Available Sensor Types
  • System Information

Hardware Scanner: FAQ


What is hardware scanning?

Hardware scanning is crucial to your infrastructure organization – it’s knowing what hardware you have and if it is functioning correctly. A hardware scanning tool will also tell you when your hardware has failed or is about to fail.

Why do I need a hardware scanner software?

Hardware is the first layer in an infrastructure – if it fails, everything else, from the operating systems to the services to the applications and processes will fail, too. Your hardware has multiple possible points of failure, and it is too important to rely on a person to check it. Using hardware scanner tools like Paessler PRTG that scan your hardware at regular intervals 24 hours, 7 days a week are crucial to keeping your business running.

Can PRTG scan and monitor all types of hardware?

Yes, PRTG's broad compatibility ensures you can monitor a wide range of hardware types across different manufacturers and protocols.

How do PRTG hardware scanning capabilities help to prevent hardware failures?

By providing early warnings and detailed diagnostics, PRTG enables you to take preemptive action to mitigate or entirely avoid hardware failures.

What is a sensor in PRTG?

In PRTG, “sensors” are the basic monitoring elements. One sensor usually monitors one measured value in your network, for example the traffic of a switch port, the CPU load of a server, or the free space on a disk drive. On average, you need about 5-10 sensors per device or one sensor per switch port.

We asked: would you recommend PRTG? Over 95% of our customers say yes!

Paessler conducted trials in over 600 IT departments worldwide to tune its network monitoring software closer to the needs of sysadmins. The result of the survey: over 95% of the participants would recommend PRTG – or already have.

recommendation

Still not convinced?

Love

More than 500,000 sysadmins love PRTG

Paessler PRTG is used by companies of all sizes. Sysadmins love PRTG because it makes their job a whole lot easier.

PRTG

Monitor your entire IT infrastructure

Bandwidth, servers, virtual environments, websites, VoIP services – PRTG keeps an eye on your entire network.

test

Try Paessler PRTG for free

Everyone has different monitoring needs. That’s why we let you try PRTG for free.

PRTG Logo

Start scanning your system and hardware health with PRTG and see how it can make your network more reliable and your job easier

Free download
PRODUCT OVERVIEW

Products

  • Paessler PRTG
    Paessler PRTGMonitor your whole IT infrastructure
    • PRTG Network Monitor
    • PRTG Enterprise Monitor
    • PRTG Hosted Monitor
  • PRTG extensions
    Extensions for Paessler PRTGExtend your monitoring to a new level
  • Icon Features
    FeaturesExplore all monitoring features

Monitoring with PRTG

  • Network monitoring
  • Bandwidth monitoring
  • SNMP monitoring
  • Network mapping
  • Wi-Fi monitoring
  • Server monitoring
  • Network traffic analyzer
  • NetFlow monitoring
  • Syslog server

Useful Links

  • PRTG Manual
  • Knowledge Base
  • Customer Success Stories
  • About Paessler
  • Subscribe to newsletter
  • PRTG Support
  • PRTG Consulting

Contact

Paessler GmbH
Thurn-und-Taxis-Str. 14, 
90411 Nuremberg 
Germany

info@paessler.com

+49 911 93775-0

  • Contact us
©2025 Paessler GmbHTerms & ConditionsPrivacy PolicyImprintReport VulnerabilityDownload & InstallSitemap
404 - Page not found 404 - Page not found 404 - Page not found