• Company
    • About Us
    • Case Studies
    • Press Center
    • Events
    • Careers
    • Blog
    • Contact us
  • Contact us
  • Login
 
  • English
    • Deutsch
    • Español
    • Français
    • Italiano
    • Português
Paessler
                    - The Monitoring Experts
  • Products
    • Paessler PRTG
      Paessler PRTGMonitor your whole IT infrastructure
      • PRTG Network Monitor
      • PRTG Enterprise Monitor
      • PRTG Hosted Monitor
      • PRTG extensionsExtensions for Paessler PRTGExtend your monitoring to a new level
    • Icon Features
      FeaturesExplore all monitoring features
      • Maps & dashboards
      • Alerts & notifications
      • Multiple user interfaces
      • Distributed monitoring
      • Customizable reporting
  • Solutions
    • Industries
      IndustriesMonitor various industry sectors
      • Industrial
      • Healthcare
      • Data Center
      • Education
      • Finance
      • Government
    • IT Topics
      IT TopicsMonitor all areas of IT
      • Network Monitoring
      • Bandwidth Monitoring
      • SNMP Monitor
      • Network Mapping
      • WiFi Monitoring
      • Server Monitoring
  • Pricing
  • Resources
    • Getting Started
      Getting StartedModules for self-paced learning
    • How-to Guides
      How-to GuidesGet the most out of PRTG
    • Videos & Webinars
      Videos & WebinarsLearn from Paessler experts
    • IT  Knowledge
      IT KnowledgeExpand your IT knowledge
    • PRTG Manual
      PRTG ManualFull documentation
    • Knowledge Base
      Knowledge BaseShare community knowledge
    • PRTG Sensor Hub
      PRTG Sensor HubGet sensors, scripts & templates
    • Trainings
      PRTG TrainingLearn how to work with PRTG
  • Partners
    • icon star
      New Partners and MSPBecome a new partner or MSP
    • icon partner
      Partner PortalLog in to your partner account
    • icon search
      Find a PartnerFind partners selling Paessler products
    • icon technology
      Technology AlliancesSee Paessler technology partnerships
  • Company
    • About Us
    • Case Studies
    • Press Center
    • Events
    • Careers
    • Blog
    • Contact us
  • Contact us
  • Login
  • English
    • Deutsch
    • Español
    • Français
    • Italiano
    • Português
  • Get a quote
  • Free trial
  1. Home>
  2. IT Topics>
  3. Hardware>
  4. CPU Temperature Monitoring
PRTG Logo

CPU Temperature Monitoring with PRTG

Keep it cool in your hardware and its surroundings

  • Check CPU temperature, servers, routers, switches, and other hardware
  • Get automatically alerted when there's risk of overheating
  • Compatible with Cisco, Dell, HPE, and other major hardware manufacturers
Free download
product overview

Our users give top ratings for monitoring with Paessler PRTG

Gartner peer insights
spiceworks
Capterra
G2
Trustpilot

PRTG CPU temperature monitoring: What you will find on this page

Table of content
  • Are your CPUs too hot to handle?
  • 4 reasons why to choose PRTG as your CPU temperature monitoring tool
  • What CPU temperature monitoring looks like in PRTG
  • Explore our preconfigured PRTG sensors for CPU temperature monitoring
  • CPU Temperature Monitoring: FAQ

PRTG makes CPU temperature monitoring as easy as it gets

Custom alerts and data visualization let you quickly identify and prevent high CPU loads and processor temperatures, cooling system failures, and other causes of overheating.

Free download
PRODUCT OVERVIEW

Are your CPUs too hot to handle?

CPU core temperatures fluctuate. That's normal.

It's when they start spiking regularly that they can cause serious issues. Making your network less stable, inflating your organization's utility bills (cue grumpy accountants calling you to complain), and, worst of all, potentially becoming a fire risk.

With Paessler PRTG, it won't have to come to that.

Our more than 250 preconfigured sensor types watch your computer's CPU temperature, other environmental values, and key network health and performance benchmarks, enabling you to run a more efficient IT infrastructure, extend your hardware's lifespan, and keep your components cool.

Table of content

4 reasons why to choose PRTG as your CPU temperature monitoring tool

If you can't stand the heat… turn it down. But to do this, you first need to know that it’s getting hot. PRTG keeps an eye on the temperature readings of your CPUs, hard drives, servers, as well as your entire server room 24/7, giving you the peace of mind to know that everything’s just fine.

Icon Maps

Intuitive interface

PRTG's interface feels instantly familiar. That's by design. We've worked hard on functionality so you can get up and running and find your way around our dashboard in no time. But you also have the option to tailor your monitoring program exactly the way you want it.

Icon Alarm

Automatic alerts

Pick your parameters and let PRTG do the work. Once you've set your preferred CPU temperature limits and other system monitoring thresholds, you'll get alerted via SMS, email, or push notification (with our smart apps for iOS or Android) when a device is at risk of breaching them, so you can fix the issues pronto.

Icon Sensor

Wide compatibility

Cisco. Dell. HPE. Juniper. Netgear… With preconfigured sensors for most major hardware manufacturers, you can easily keep track of every single device on your network, including single workstations, whole servers, switches and routers – no matter how complex your setup is.

Icon Temperature

All-in-one monitoring

It's not just for tracking CPU temperatures. PRTG also keeps an eye on humidity levels, voltage, CPU usage, fan speed, the availability and status of your power supplies, and much more. Keep your infrastructure stable and secure (and your colleagues and higher-ups happy) with a fraction of the effort.

What CPU temperature monitoring looks like in PRTG

Diagnose network issues by continuously monitoring the current and maximum temperature of CPUs, routers, switches, and other hardware components. Show system workloads, CPU cooler status, memory usage, and other key metrics in real time and visualize data in graphic maps & dashboards to identify problems more easily. Gain the visibility you need to troubleshoot the causes of overheating.

PRTG Screenshot device tree view

Device tree view of the complete monitoring setup

PRTG screenshot map entire it infrastructure

Custom PRTG dashboard for keeping an eye on the entire IT infrastructure

PRTG screenshot graph live data traffic

Live traffic data graph in PRTG

Start monitoring high CPU temperatures with PRTG and see how it can make your network more reliable and your job easier.

Free download
PRODUCT OVERVIEW

IT experts agree: Paessler PRTG is a great solution for IT infrastructure monitoring

PCMag

“All-around winning
 network monitor”

IT Brief

“The real beauty of PRTG is the endless possibilities it offers”

ITPro

“PRTG Network Monitor 
is very hard to beat”

Explore our preconfigured PRTG sensors for CPU temperature monitoring

PRTG comes with more than 250 native sensor types for monitoring your entire on-premises, cloud, and hybrid cloud environment out of the box. Check out some examples below!

SNMP IBM System X System Health

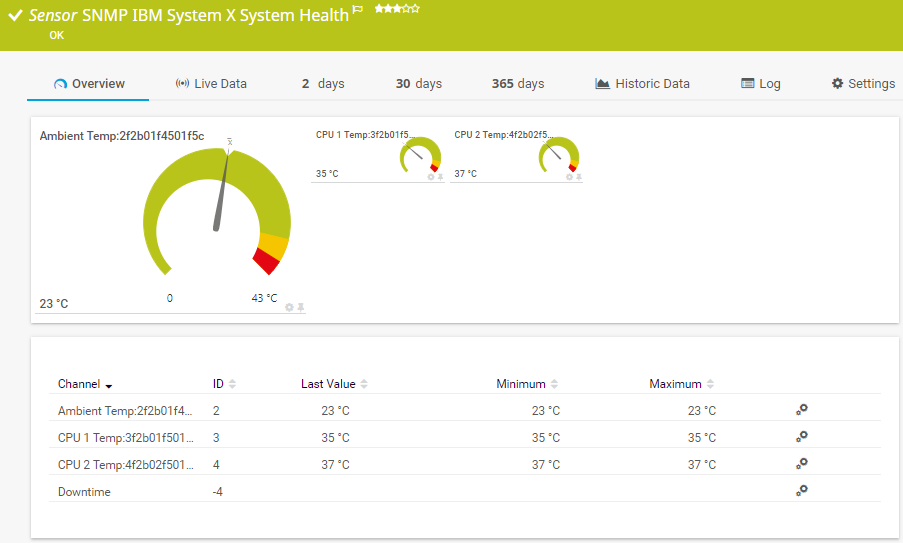
The SNMP IBM System X System Health sensor monitors the system health of an IBM device. It can show the following:

  • Overall status
  • Ambient and CPU temperature
  • CMOS battery voltage
  • Fan RPM
  • 3.3V, 5V, and 12V-system board voltage
NMP IBM System X System Health

SNMP QNAP System Health

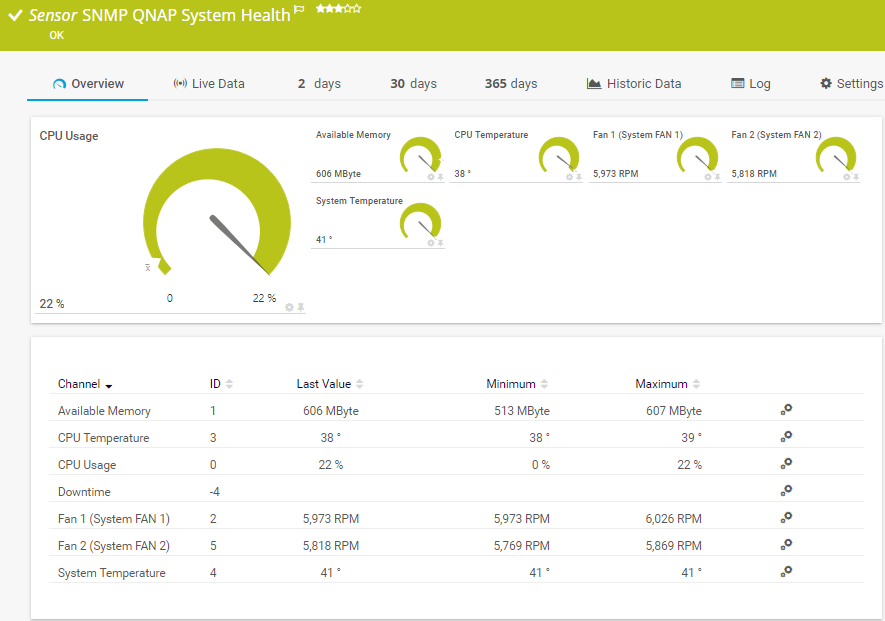
The SNMP QNAP System Health sensor monitors the system health of a Quality Network Appliance Provider (QNAP) network-attached storage (NAS) . It can show the following:

  • Available memory
  • CPU temperature
  • CPU usage
  • Fan RPM
  • System temperature
SNMP QNAP System Health

Beckhoff IPC System Health

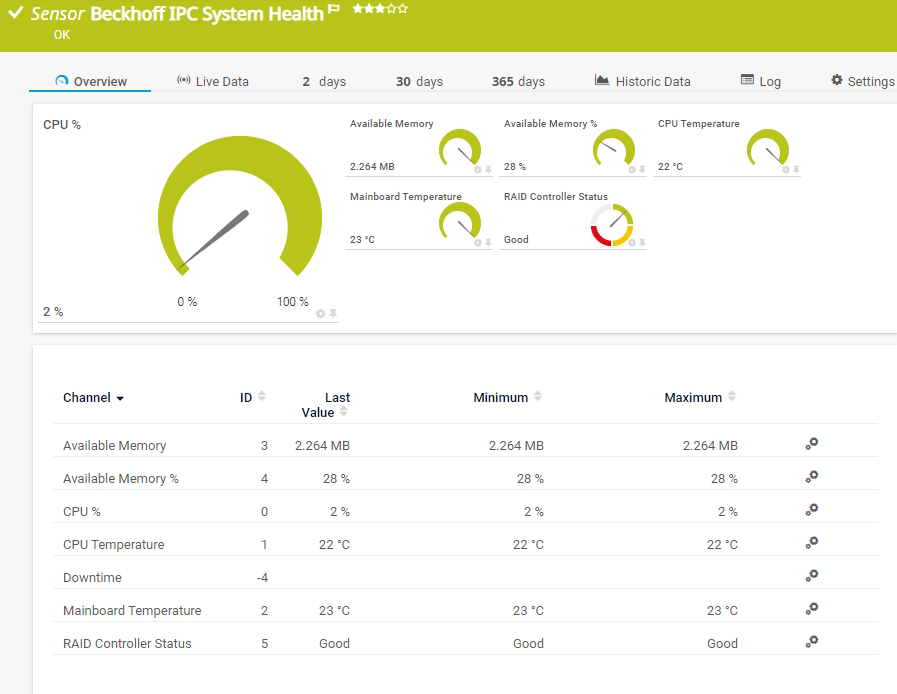
The Beckhoff IPC System Health sensor monitors the system health of a Beckhoff Industrial PC (IPC) via OPC Unified Architecture (OPC UA). It can show the following:

  • Available memory
  • CPU load
  • CPU and mainboard temperature
  • RAID controller status
Beckhoff IPC System Health

See the PRTG Manual for a list of all available sensor types.

PRTG is compatible with all major vendors, products, and systems

compatible with all major vendors, products, and systems

PRTG makes CPU temperature monitoring as easy as it gets

Custom alerts and data visualization let you quickly identify and prevent high CPU loads and processor temperatures, cooling system failures, and other causes of overheating.

Free download
PRODUCT OVERVIEW

“From a server perspective, we're monitoring all of the key components of our service such as CPU usage, RAM disk space, the Windows services that it's running, and network connectivity of that server. In terms of networks, we’re monitoring all of our switches, firewalls, and access points. It’s really useful to be able to easily pull performance metrics from the PRTG dashboard.”

Ollie Kerslake, Infrastructure Lead
Riverford Organic Farmers

“The tool has given us greater control over all types of devices connected to the network (switches, IP telephony, security cameras, IoT, WiFi) that previously remained opaque when dealing with service incidents. This has improved our ability to diagnose and resolve problems, which has translated into greater efficiency and a better user experience in both internal and public services.”

Jordi Tolosà Bel, New Technologies Technician
Vinaroz City Council

“Our objective was to be able to monitor the health of our most critical servers containing data and applications, but also the flows and bandwidth between headquarters, our 50 servers in the cloud and the 15 servers at our production sites. For us, it is essential to have a proactive approach to understand where the weaknesses of the IT system are to be able to improve them.”

Marc Boullier, CIO
Carambar & Co

Your CPU temperature monitor at a glance – even on the go

PRTG is set up in a matter of minutes and can be used on a wide variety of mobile devices.

device overview
HPE

We are an HPE Technology Partner

Hewlett Packard Enterprises and Paessler are collaborating in a fresh new way to bring increased value to you as our customer.

What does this mean for you?

  • Easy integration of HPE hardware and software with PRTG
  • State-of-the-art features for monitoring your HPE environment
  • Expert technical support around your HPE monitoring setup

Create innovative solutions with Paessler’s IT partners

Partnering with innovative IT vendors, Paessler unleashes synergies to create
new and additional benefits for joined customers.

baramundi

baramundi

baramundi and PRTG create a secure, reliable and powerful IT infrastructure where you have everything under control - from the traffic in your firewall to the configuration of your clients.

Read more
INSYS icom

INSYS icom

With the combination of PRTG and Insys, the monitoring specialist Paessler and the industrial gateway manufacturer INSYS icom offer a practical possibility to merge IT and OT.

Read more
Siemon

Siemon

Siemon and Paessler bring together intelligent building technology and advanced monitoring and make your vision of intelligent buildings and data centers become reality.

Read more

Find the root cause of the problem with our PRTG CPU core temp monitoring solution

Real-time notifications mean faster troubleshooting so that you can act before more serious issues occur.

Free download
PRODUCT OVERVIEW
Paessler PRTG

Paessler PRTG

Network Monitoring Software – Version 24.4.102.1351 (November 12th, 2024)

Hosting icon

Hosting

Download for Windows and cloud-based version PRTG Hosted Monitor available

Languages icon

Languages

English, German, Spanish, French, Portuguese, Dutch, Russian, Japanese, and Simplified Chinese

test

Monitor everything

Network devices, bandwidth, servers, applications, virtual environments, remote systems, IoT, and more

test

Pricing

Choose the PRTG Network Monitor subscription that's best for you

Discover more monitoring insights and stories

Resources Solution

Solutions for all your monitoring needs

  • CPU monitoring ✦ PRTG to the rescue
  • Data center temperature monitoring
  • VMware monitoring
Resources Content

Powerful stories from the monitoring world

  • Get more visibility of VMware ESXi: Metrics you should be monitoring
  • Why CPU monitoring matters (and what PRTG can do for you)
  • Check Your Check Points
Resources Solutions

Resources to master your monitoring challenges

  • Why does my Synology System Health sensor show incorrect CPU and memory values?
  • Knowledge Base overview
  • Knowledge Base overview

CPU Temperature Monitoring: FAQ


What is a CPU?

A CPU (Central Processing Unit) is the primary component of a computer responsible for interpreting and executing most of the commands from the computer's hardware and software. Often referred to as the "brain" of the computer, the CPU performs the essential operations that allow the computer to function. The CPU is a chip that sits in a specific socket on the motherboard, often beneath a heat sink or fan to manage the heat it generates.

Architecture of the CPU:

Clock Speed: Measured in gigahertz (GHz), it indicates how many cycles per second the CPU can execute, with higher clock speeds typically meaning faster processing.

Cores: Modern CPUs often have multiple cores, which are individual processing units within the CPU. Multi-core CPUs can handle multiple tasks simultaneously, improving performance.

Threads: A thread is a sequence of programmed instructions that the CPU can execute. CPUs with multiple threads can perform multiple tasks more efficiently by managing them concurrently.

Examples of CPUs:

Intel Core i7: A popular CPU series for desktops and laptops, known for high performance.

AMD Ryzen 5: Another widely used CPU series offering strong multi-core performance.

Apple M1: A CPU designed by Apple, used in its Mac computers and known for its efficiency and power.

Why do CPUs overheat?

CPUs overheat for all sorts of reasons. The most obvious causes are poor air flow, high ambient temperatures, and cooling system malfunctions. But technical issues such as resource-heavy processes, outdated firmware, and poorly optimized hardware or software can also cause overheating by making the CPU operate inefficiently or work too hard.

How hot is too hot for a processor?

A CPU is too hot if its temperature is higher than the maximum specified by the manufacturer. The limit varies depending on the make and model, but it's typically somewhere between 60°C to 90°C (if you're in the US, that's 140°F to 194°F). If a CPU goes over this limit for any sustained period of time, it can cause network disruptions and become a fire hazard. The device will also be less reliable and have a shorter lifespan.

Why use PRTG as CPU temperature monitoring software?

Because it makes it easier to spot and address the causes of overheating – including those that might not be immediately obvious – before your device becomes unstable or, worse, dangerous. Alongside CPU temperature, PRTG also monitors other key variables that might damage your hardware and make your network less safe and reliable, such as humidity levels and the status of power distribution units and uninterruptible power supplies.

I want to monitor a device's temperature, but it doesn't make the information available. Now what?

No temperature data? No problem. You can get around it by monitoring other key stats that might impact performance and cause your device to overheat. PRTG has sensors for every variable imaginable, including application performance, CPU load, memory, email, website, and even CCTV monitoring.

Which operating system does PRTG run on?

The PRTG core server runs on Microsoft Windows (Windows Server 2022, Windows Server 2019, Windows Server 2016, Windows 11, or Windows 10 are recommended). With the help of our built-in multi-platform probe, you can also run PRTG on Linux and other Unix-based systems.

What is a sensor in PRTG?

In PRTG, “sensors” are the basic monitoring elements. One sensor usually monitors one measured value in your network, for example the traffic of a switch port, the CPU load of a server, or the free space on a disk drive. On average, you need about 5-10 sensors per device or one sensor per switch port.

We asked: would you recommend PRTG? Over 95% of our customers say yes!

Paessler conducted trials in over 600 IT departments worldwide to tune its network monitoring software closer to the needs of sysadmins. The result of the survey: over 95% of the participants would recommend PRTG – or already have.

recommendation

Still not convinced?

Love

More than 500,000 sysadmins love PRTG

Paessler PRTG is used by companies of all sizes. Sysadmins love PRTG because it makes their job a whole lot easier.

PRTG

Monitor your entire IT infrastructure

Bandwidth, servers, virtual environments, websites, VoIP services – PRTG keeps an eye on your entire network.

test

Try Paessler PRTG for free

Everyone has different monitoring needs. That’s why we let you try PRTG for free.

PRTG Logo

Start monitoring high CPU temperatures with PRTG and see how it can make your network more reliable and your job easier.

Free download
PRODUCT OVERVIEW

Products

  • Paessler PRTG
    Paessler PRTGMonitor your whole IT infrastructure
    • PRTG Network Monitor
    • PRTG Enterprise Monitor
    • PRTG Hosted Monitor
  • PRTG extensions
    Extensions for Paessler PRTGExtend your monitoring to a new level
  • Icon Features
    FeaturesExplore all monitoring features

Monitoring with PRTG

  • Network monitoring
  • Bandwidth monitoring
  • SNMP monitoring
  • Network mapping
  • Wi-Fi monitoring
  • Server monitoring
  • Network traffic analyzer
  • NetFlow monitoring
  • Syslog server

Useful Links

  • PRTG Manual
  • Knowledge Base
  • Customer Success Stories
  • About Paessler
  • Subscribe to newsletter
  • PRTG Support
  • PRTG Consulting

Contact

Paessler GmbH
Thurn-und-Taxis-Str. 14, 
90411 Nuremberg 
Germany

info@paessler.com

+49 911 93775-0

  • Contact us
©2025 Paessler GmbHTerms & ConditionsPrivacy PolicyImprintReport VulnerabilityDownload & InstallSitemap
404 - Page not found 404 - Page not found 404 - Page not found