Custom alerts and data visualization let you quickly identify and prevent data center downtime, and optimize energy costs.
When data centers are a part of your network, monitoring your UPSs, PDUs, and other power-related systems is a critical IT function. A downed data center because of electrical power usage spikes or power failures can be disastrous. Data center power monitoring with Paessler PRTG raises the bar on your DCIM strategy and takes the worry out of managing power consumption across your facilities, helping you keep your network plugged in and powered up.
Diagnose network issues by continuously tracking your data center power. Show power capacity, power quality, voltage, environmental conditions, and other key metrics in real time. Visualize monitoring data in clear graphs and dashboards to identify problems more easily. Gain the overview you need to troubleshoot power consumption issues and inefficiencies.
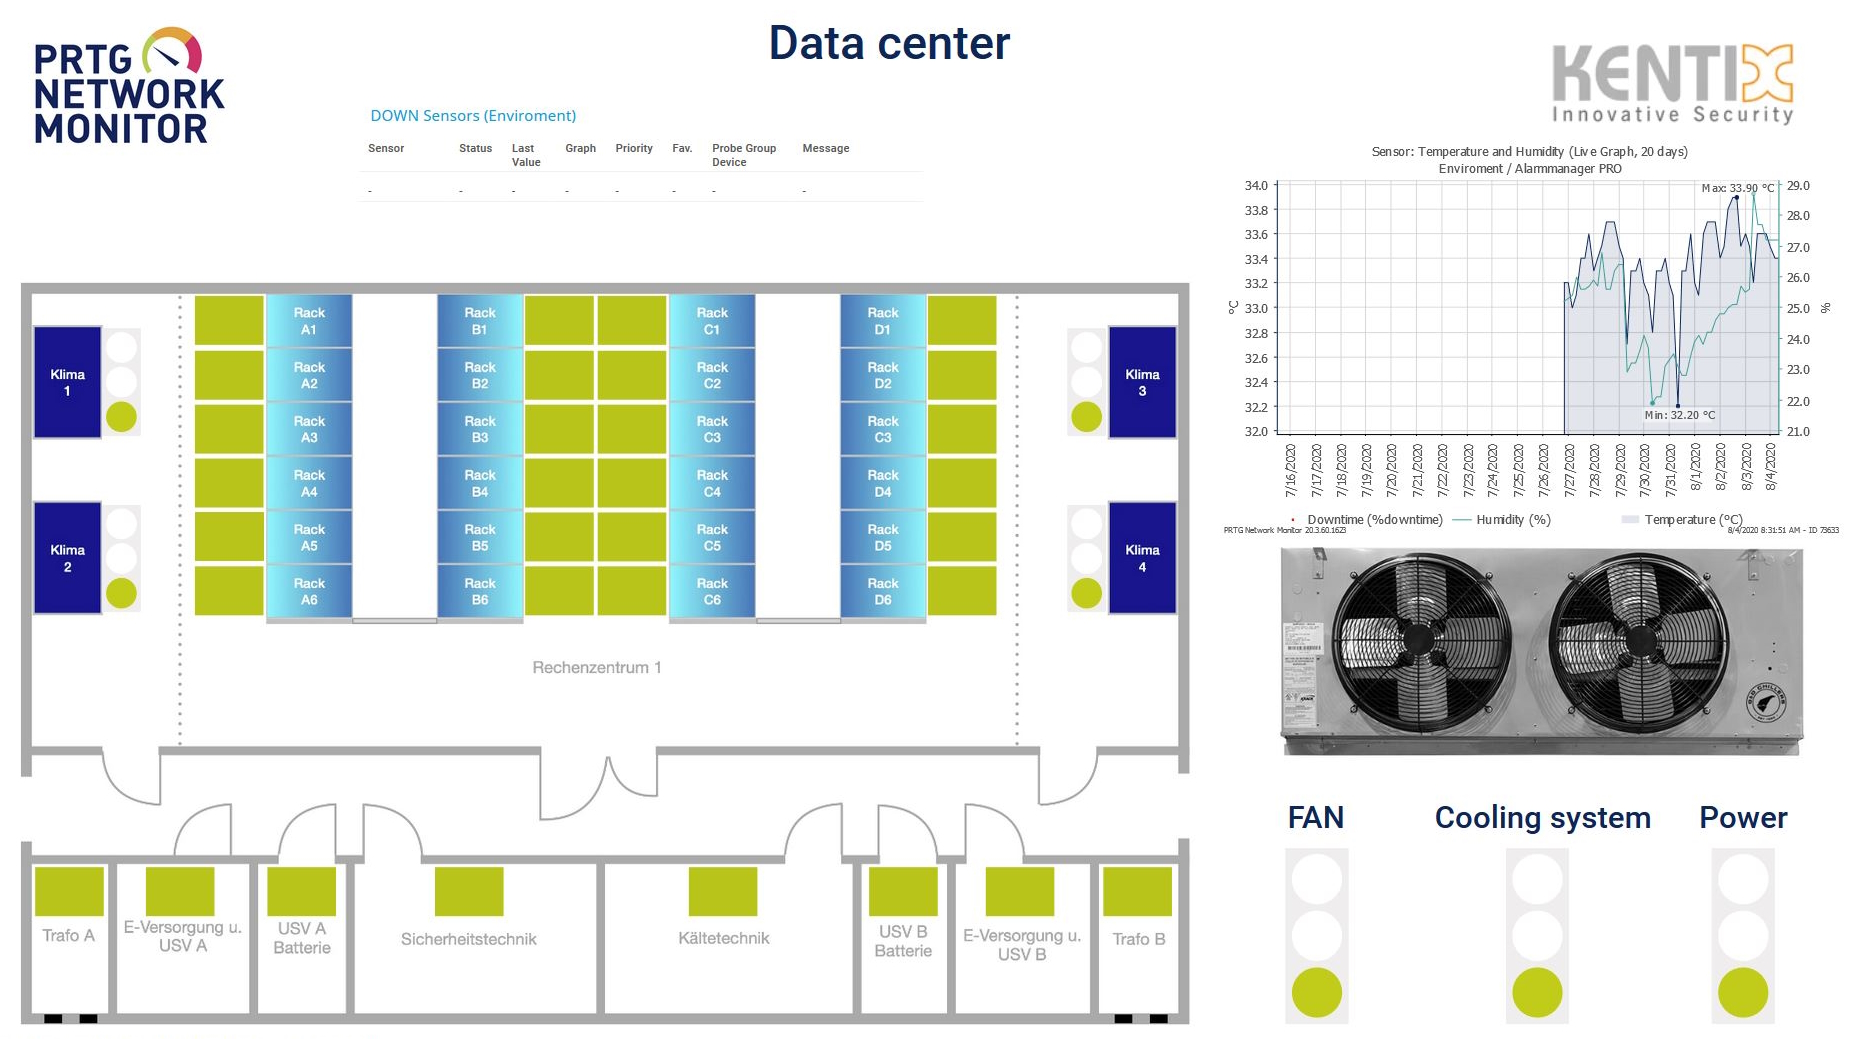
Overview map of a Kentix data center

Device tree view of the complete monitoring setup

Custom PRTG dashboard for keeping an eye on the entire IT infrastructure

Live traffic data graph in PRTG
“All-around winning
network monitor”
“The real beauty of PRTG is the endless possibilities it offers”
“PRTG Network Monitor
is very hard to beat”
PRTG is really invested in providing great data visualization. A single dashboard gives you immediate access to the state of all your power-related components with the ability to drill down.
No need to switch management systems or power infrastructure.
PRTG is friendly. Like... actually compatible with all kinds of hardware from different vendors, whether you’re using PDUs, UPS systems, or environmental sensors from various manufacturers.
So you can integrate PRTG into any data center setup without worrying about whether everyone will play well together.
Or maybe just tailor-made alerts for every situation, which is really all a good facility manager needs, right? With PRTG, you’re in control of your alerts.
Set custom notifications based on specific thresholds. You can even escalate alerts to different team members depending on the severity, making sure the right person is notified at the right time.
PRTG is For Your Eyes Only, offering granular permissions and access rights management, so you can decide who has access to certain areas of your data center monitoring.
It’s great for large teams where different people need access to different information without complicating things. So you can lock it down like Fort Knox or let it all out for anyone who wants to see.
PRTG comes with more than 250 native sensor types for monitoring your entire on-premises, cloud, and hybrid cloud environment out of the box. Check out some examples below!
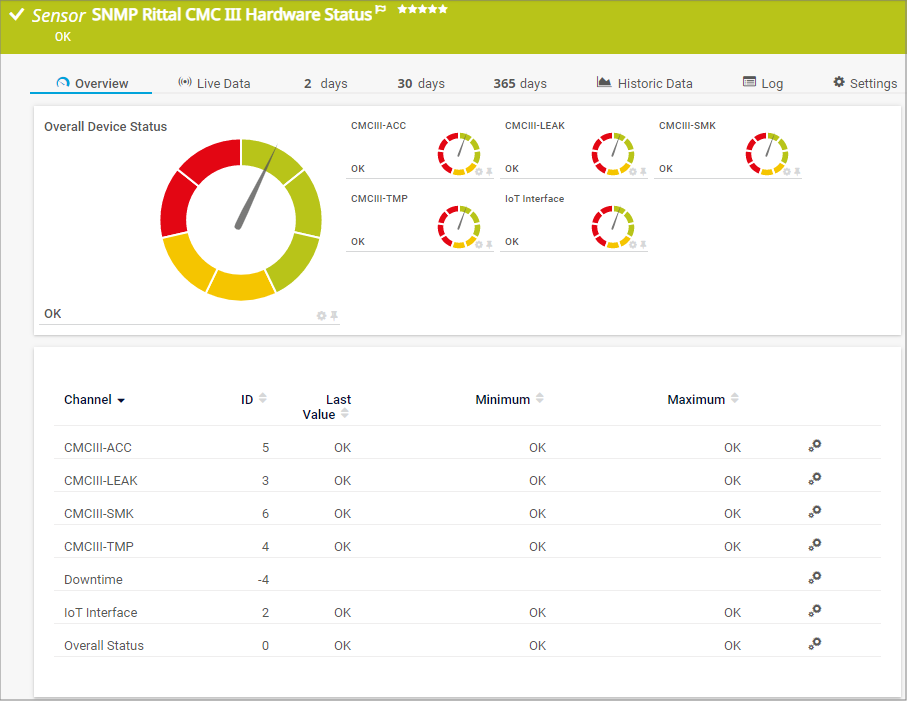
The SNMP Rittal CMC III Hardware Status sensor monitors the overall status of Rittal data center hardware, for example Rittal Computer Multi Control version 3 (CMC III) processing units, Rittal power distribution units (PDU), or Rittal IoT interfaces. It can show the following:
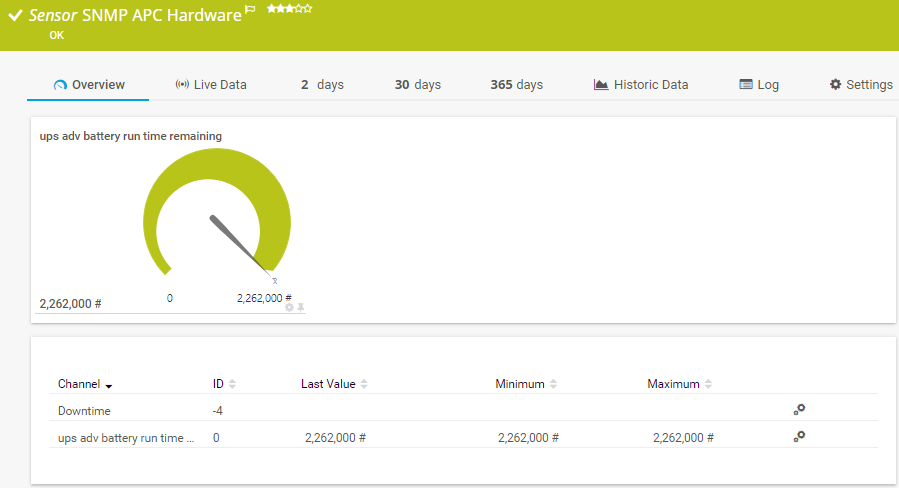
The SNMP APC Hardware sensor monitors performance counters on an APC UPS device. It can show the following:
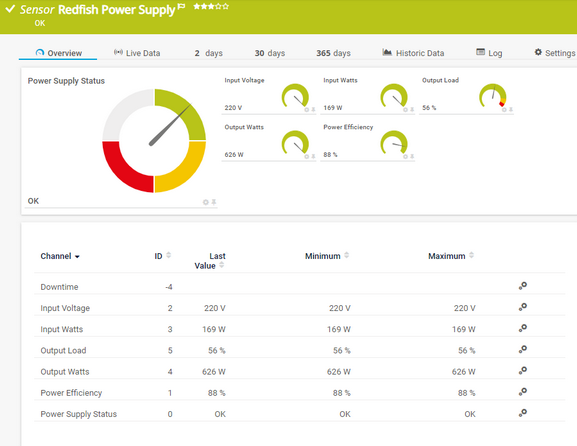
The Redfish Power Supply sensor monitors the power supply of a Redfish Scalable Platforms Management API (Redfish)-capable server. It can show the following:
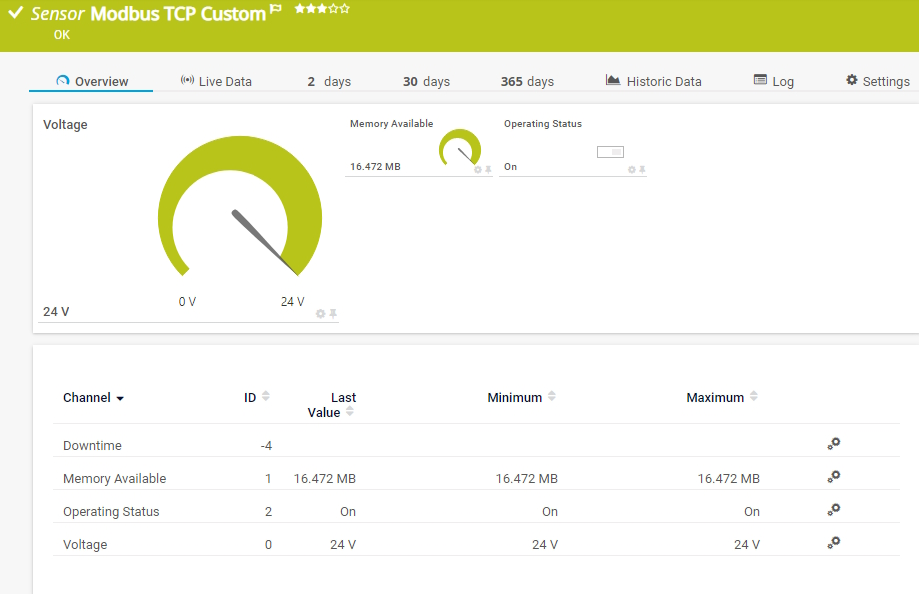
The Modbus TCP Custom sensor connects to a Modbus Transmission Control Protocol (TCP) server and monitors up to ten returned numeric values. It can show the following:
See the PRTG Manual for a list of all available sensor types.

Custom alerts and data visualization let you quickly identify and prevent data center downtime, and optimize energy costs.
PRTG is set up in a matter of minutes and can be used on a wide variety of mobile devices.


“Excellent tool for detailed monitoring. Alarms and notifications work greatly. Equipment addition is straight forward and server initial setup is very easy. ...feel safe to purchase it if you intend to monitor a large networking landscape.”
Partnering with innovative IT vendors, Paessler unleashes synergies to create
new and additional benefits for joined customers.
IT that works constitutes a business-critical basis for a company's success. Availability and security must be defined for the respective purpose and closely monitored – by OT and IT alike.
Combining their tools to a powerful solution for advanced analysis and automation, KnowledgeRiver and Paessler enable IT teams to ensure best performance for their infrastructure and networks.
Siemon and Paessler bring together intelligent building technology and advanced monitoring and make your vision of intelligent buildings and data centers become reality.
Real-time notifications mean faster troubleshooting so that you can act before more serious issues occur.
Network Monitoring Software – Version 25.3.110.1313 (August 27, 2025)
Download for Windows and cloud-based version PRTG Hosted Monitor available
English, German, Spanish, French, Portuguese, Dutch, Russian, Japanese, and Simplified Chinese
Network devices, bandwidth, servers, applications, virtual environments, remote systems, IoT, and more
Choose the PRTG Network Monitor subscription that's best for you


Data center monitoring can be broken down into three categories:
Even the slightest fluctuation in a power supply can cause damage to an IT system. Power failures and outages may be caused by many different things – some of which are not always avoidable. Power overloads (e.g., caused by lightning), vandalism, or cables gnawed by pets are all examples of issues that can’t be avoided. By monitoring power fluctuations and anomalies, you put the gift of immediate action into your team’s hands, shorten resolution times, and reduce the chances of equipment damage.
PRTG uses various sensors that use protocols such as SNMP, Modbus, or Redfish to monitor key metrics like UPS input/output voltage, battery status, remaining runtime, and system load. The data is processed in real time, and visualized through dashboards or reports.
PRTG provides real-time alerts in the event of power failures, high energy consumption, or voltage fluctuations, giving administrators the ability to respond quickly. It also allows custom notification settings for specific power thresholds.
In PRTG, “sensors” are the basic monitoring elements. One sensor usually monitors one measured value in your network, for example the traffic of a switch port, the CPU load of a server, or the free space on a disk drive. On average, you need about 5-10 sensors per device or one sensor per switch port.
Paessler conducted trials in over 600 IT departments worldwide to tune its network monitoring software closer to the needs of sysadmins. The result of the survey: over 95% of the participants would recommend PRTG – or already have.

Paessler PRTG is used by companies of all sizes. Sysadmins love PRTG because it makes their job a whole lot easier.
Bandwidth, servers, virtual environments, websites, VoIP services – PRTG keeps an eye on your entire network.
Everyone has different monitoring needs. That’s why we let you try PRTG for free.