Custom alerts and data visualization let you quickly identify and prevent Linux process failures and resource bottlenecks.
Linux process monitoring gives you visibility into the running processes on your Linux systems. With Paessler PRTG, you can track key metrics like CPU usage, memory consumption, and process status to ensure that critical services remain up. Whether you're running Ubuntu, CentOS, or other Linux distributions, PRTG helps you spot processes that are consuming excessive resources or have unexpectedly terminated on your Linux server.
Uncover greedy processes that eat up excessive CPU or memory resources on your Linux servers. PRTG allows you to monitor resource usage in real-time using command line tools, helping you identify bottlenecks that might affect system performance. By tracking metrics like CPU utilization and memory usage per process ID (PID), you can quickly pinpoint which processes are causing performance issues and take action before they cause problems for your operating system.
When critical processes fail on your Linux systems, you need to know immediately. PRTG continuously monitors process status and can notify you via email, push notification, or SMS when a process unexpectedly terminates. This proactive approach allows system administrators to restart failed processes or implement fixes before service outages occur, maintaining high availability for your Linux-based services and daemons.
PRTG provides consistent monitoring capabilities across various Linux distributions including Ubuntu, CentOS, Debian, and more. This unified approach simplifies monitoring for diverse environments, allowing you to use the same monitoring solution regardless of which Linux flavor you're running. Monitor all your Linux servers from a single dashboard and receive standardized alerts for any distribution, whether you're using SSH or other connection methods.
Analyze historical monitoring data to identify trends and plan capacity. PRTG stores monitoring data and provides detailed reports showing how process resource usage changes over time. This historical perspective helps you identify gradual performance degradation, plan for system upgrades, and make informed decisions about resource allocation for your Linux environments. Track metrics like load average and system performance to ensure optimal uptime for your critical services.
Diagnose network issues by continuously tracking process performance. Show CPU usage, memory consumption, process status and other key metrics in real time. Visualize monitoring data in clear graphs and dashboards to identify problems more easily. Gain the overview you need to troubleshoot Linux process issues.

Device tree view of the complete monitoring setup
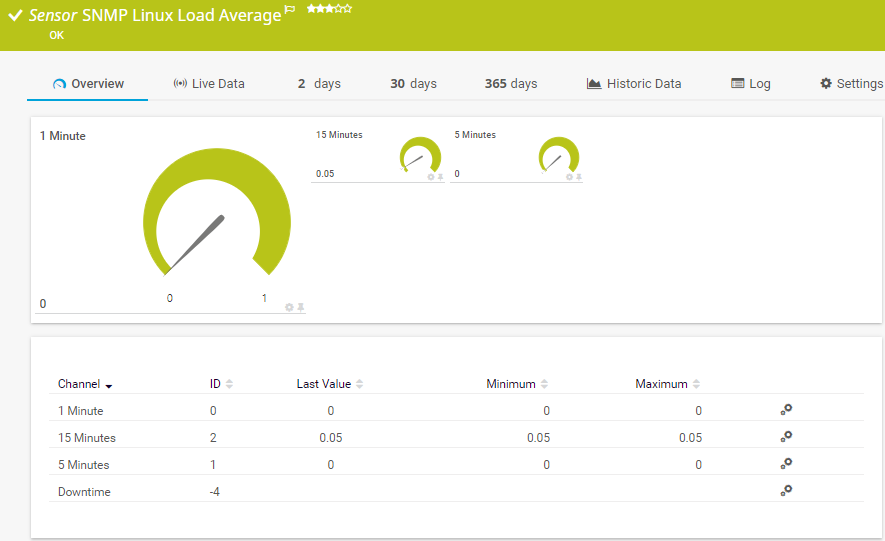
Linux Load Monitoring – SNMP Sensor shows stable load over time

Custom PRTG dashboard for keeping an eye on the entire IT infrastructure

Live traffic data graph in PRTG
“All-around winning
network monitor”
“The real beauty of PRTG is the endless possibilities it offers”
“PRTG Network Monitor
is very hard to beat”
Monitor Linux processes securely using SSH connections. PRTG executes commands on your Linux systems to gather process information without requiring dedicated agents. Just configure your SSH credentials in PRTG's device settings, and you can immediately start monitoring processes on any SSH-accessible Linux server across different distributions like Ubuntu, CentOS, or Debian. This works in the same way as running commands from the command line, but with automated monitoring.
Choose from specialized sensors for effective Linux monitoring. PRTG offers SSH Load Average sensors for system load and SSH Meminfo sensors for memory usage. For process-specific monitoring, SSH Script sensors let you implement custom monitoring logic with bash scripts that can track processes by name or PID. If your systems have SNMP enabled, you can also use SNMP-based Linux sensors as an alternative for monitoring system resources.
Transform monitoring data into real insights with PRTG's dashboard tools. The web interface displays key metrics in customizable graphs and charts, while the Maps feature lets you create dashboards that combine Linux process data with other infrastructure metrics. Historical data enables trend analysis and reporting, helping you identify patterns and anomalies for more efficient troubleshooting of resource usage and filesystem performance.
Stay informed about process issues through PRTG's notification system. Configure alerts based on thresholds for CPU or memory usage, or set up state triggers for process failures. Multiple notification methods include email, push notifications to the PRTG mobile app, SMS messages, and HTTP requests. Define escalation procedures with different schedules and recipient groups to ensure timely responses to Linux process problems.
PRTG comes with more than 250 native sensor types for monitoring your entire on-premises, cloud, and hybrid cloud environment out of the box. Check out some examples below!
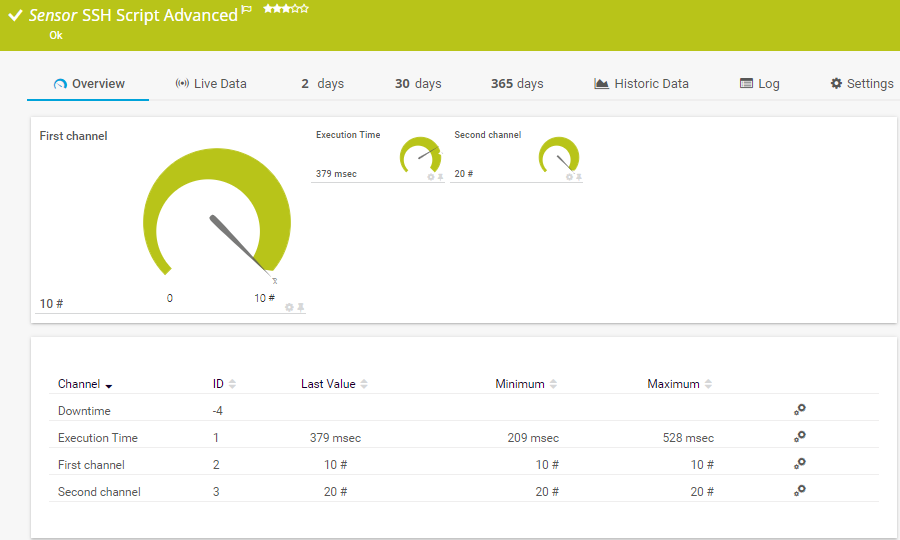
The SSH Script Advanced sensor connects to a Linux/Unix system via Secure Shell (SSH) and executes a script file that is located on the target system. This option is available as part of the PRTG API. It can show the following:
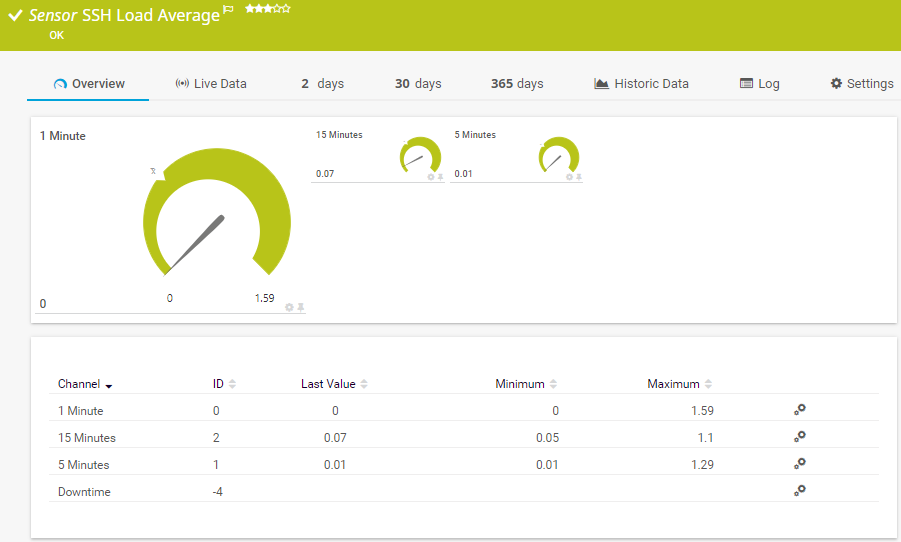
The SSH Load Average sensor monitors the load average of a Linux/Unix system using Secure Shell (SSH). It can show the following:
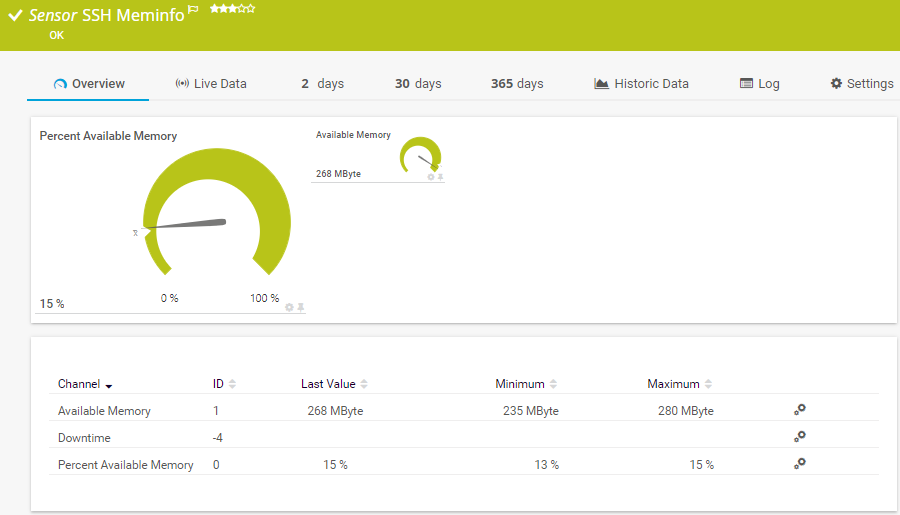
The SSH Meminfo sensor monitors the memory usage of a Linux/Unix system using Secure Shell (SSH). It can show the following:
The SNMP Linux Load Average sensor monitors the system load average of a Linux/Unix system. It can show the following:
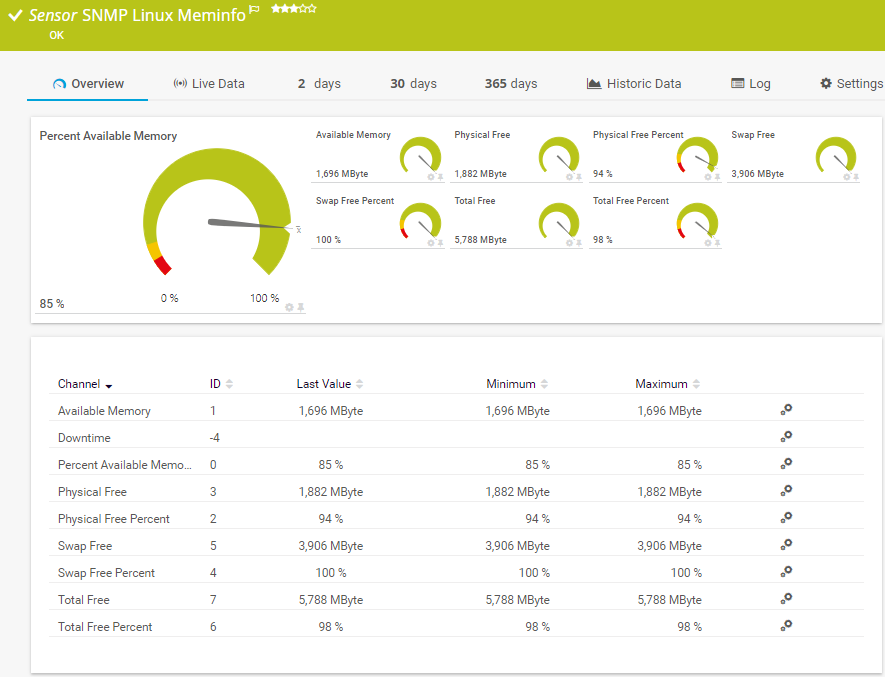
The SNMP Linux Meminfo sensor monitors the memory usage of a Linux/Unix system. It can show the following:
See the PRTG Manual for a list of all available sensor types.

Custom alerts and data visualization let you quickly identify and prevent Linux process failures and resource bottlenecks.
PRTG is set up in a matter of minutes and can be used on a wide variety of mobile devices.

Partnering with innovative IT vendors, Paessler unleashes synergies to create
new and additional benefits for joined customers.
PATLITE, as a manufacturer of visual and audible signaling devices, uses Paessler PRTG to ensure smooth plant operations.
By integrating PRTG with Martello iQ, you can add a fast analytics layer to improve uptime, visualize your IT environment, and integrate all of your IT systems into a single pane of glass.
Combine PRTG’s monitoring of everything with SQmediator’s deep insights into your communications infrastructure to ensure and improve your company’s communications plant and troubleshooting abilities.
Real-time notifications mean faster troubleshooting so that you can act before more serious issues occur.
Network Monitoring Software – Version 25.3.110.1313 (August 27, 2025)
Download for Windows and cloud-based version PRTG Hosted Monitor available
English, German, Spanish, French, Portuguese, Dutch, Russian, Japanese, and Simplified Chinese
Network devices, bandwidth, servers, applications, virtual environments, remote systems, IoT, and more
Choose the PRTG Network Monitor subscription that's best for you
A Linux process is an instance of a running program on a Linux operating system. Each process has a unique process ID (PID), consumes system resources like CPU and memory, and has a specific state (running, sleeping, stopped, etc.). Processes can be user applications, system services, or background daemons that perform specific functions on the Linux system. System administrators often use commands like top, htop, or ps aux to view active processes through the command line.
Monitoring Linux processes is essential for ensuring system stability and performance. By tracking process metrics, you can identify resource-intensive processes that might cause bottlenecks, detect when critical processes fail or crash, and understand how your system resources are being utilized. This visibility helps prevent outages, improve system performance, and provide better service to users. Monitoring solutions like PRTG give you detailed information about running processes without constantly using grep or other command line tools.
PRTG monitors Linux processes using secure SSH connections to execute commands on the Linux system and retrieve process information. It can track metrics like CPU usage, memory consumption, process status, and more. PRTG offers several sensor types for Linux monitoring, including SSH Script sensors for custom monitoring scenarios that can be configured to track specific processes by name or PID. These sensors can monitor both user processes and system processes across various Linux distributions.
Yes, PRTG can monitor processes on virtually any Linux distribution, including Ubuntu, CentOS, Debian, Red Hat, and others. The monitoring approach uses standard SSH connections and commands that work across different distributions, providing consistent monitoring capabilities regardless of which Linux flavor you're running. This makes it ideal for heterogeneous environments where you might be running multiple Linux distributions.
PRTG provides flexible notification options for process monitoring. You can configure alerts based on process status, resource usage thresholds, or custom conditions. When a critical process fails or meets alert conditions, PRTG can notify you through various channels including email, push notifications to the PRTG mobile app, SMS messages, or custom HTTP requests to integrate with other systems. This helps you respond quickly to issues before they cause system-wide problems.
In PRTG, “sensors” are the basic monitoring elements. One sensor usually monitors one measured value in your network, for example the traffic of a switch port, the CPU load of a server, or the free space on a disk drive. On average, you need about 5-10 sensors per device or one sensor per switch port.
Paessler conducted trials in over 600 IT departments worldwide to tune its network monitoring software closer to the needs of sysadmins. The result of the survey: over 95% of the participants would recommend PRTG – or already have.

Paessler PRTG is used by companies of all sizes. Sysadmins love PRTG because it makes their job a whole lot easier.
Bandwidth, servers, virtual environments, websites, VoIP services – PRTG keeps an eye on your entire network.
Everyone has different monitoring needs. That’s why we let you try PRTG for free.