


Custom alerts and data visualization let you quickly identify and prevent all kinds of network issues.
Network monitoring should be quick and easy. Configuring Cacti can be extremely complicated. If errors occur, you can spend hours troubleshooting and might even have to start over completely. The time you spend on setup and configuration can quickly make the actual cost of the open-source tool Cacti go through the roof.
PRTG makes monitoring as user-friendly as possible – no matter if you choose an on-prem installation or our cloud-based product.
Quick installation with automatic network discovery and smart setup for instant monitoring
Custom dashboard creation via drag & drop with easy-to-read visualized overviews
Different user interfaces for web, desktop, and mobile apps for monitoring on the go
Network of qualified implementation partners to support you with a smooth migration to PRTG
Diagnose network issues by continuously tracking the health, availability, and performance of your entire IT infrastructure. Show hardware parameters, application performance, network traffic, bandwidth usage, and other key metrics in real time. Visualize data in clear graphs and dashboards to identify problems more easily. Gain the overview you need to troubleshoot all kinds of issues in your network.

Device tree view of the complete monitoring setup

Custom PRTG dashboard for keeping an eye on the entire IT infrastructure

Live traffic data graph in PRTG
FEATURE | PRTG PRTG | Cacti Cacti |
|---|---|---|
One tool for your entire network | PRTG All monitoring features included | Cacti Complete network graphing solution based on RRDTool, but primarily focused on graphing and visualization rather than comprehensive monitoring |
Easy setup, intuitive monitoring | PRTG User-friendly interfaces for web, desktop, and mobile | Cacti Requires manual configuration and setup with a steep learning curve; configuration can be tedious and time-consuming |
Automatic network discover | PRTG Included | Cacti Available through automation features that allow scheduling of network scans to discover SNMP-enabled devices |
Real-time alerts & notifications | PRTG Advanced, highly customizable alerting via different notification methods | Cacti Supports alerting capabilities, but less robust than PRTG; can be extended with plugins like THold for threshold monitoring |
Custom maps & dashboards | PRTG Custom dashboard creation via drag & drop | Cacti Supports custom graph visualization and organization, but less intuitive than PRTG's drag-and-drop interface |
Agentless monitoring | PRTG No need to install agents on the monitored systems | Cacti Primarily uses SNMP for agentless monitoring of network devices |
On-premises or cloud-based | PRTG Flexible deployment options available | Cacti On-premises deployment, but no official cloud-based option; requires manual setup for cloud deployment |
Enterprise version | PRTG Available | Cacti No specific enterprise version, though it can be used in enterprise environments with proper configuration |
Freeware version | PRTG Available for up to 100 sensors, free for life | Cacti Free and open-source with no limitations |
Distributed network monitoring | PRTG Monitoring an unlimited number of remote locations included | Cacti Supports distributed monitoring through remote pollers, but requires additional configuration |
Server & application monitoring | PRTG Out-of-the-box integration, no extra cost | Cacti Supports server monitoring, but primarily focused on network metrics; application monitoring requires additional plugins and scripts |
Network performance monitoring | PRTG Out-of-the-box integration, no extra cost | Cacti Strong network performance monitoring capabilities, especially for long-term trend analysis |
Bandwidth monitoring | PRTG Out-of-the-box integration, no extra cost | Cacti Bandwidth monitoring and graphing capabilities, which is one of Cacti's core strengths |
Network traffic analyzer | PRTG Out-of-the-box integration, no extra costs | Cacti Provides traffic analysis through SNMP, but lacks the advanced flow analysis capabilities of PRTG without additional plugins |
Cloud services monitoring | PRTG Out-of-the-box integration, no extra cost | Cacti Limited native cloud monitoring capabilities; requires custom scripts or plugins for comprehensive cloud monitoring |
Virtual infrastructure monitoring | PRTG Out-of-the-box integration, no extra cost | Cacti Possible with proper templates and plugins, but not as comprehensive as PRTG's built-in capabilities |
Storage resource monitoring | PRTG Out-of-the-box integration, no extra cost | Cacti Supports storage monitoring via SNMP, but may require additional configuration for advanced features |
Database monitoring | PRTG Out-of-the-box integration, no extra cost | Cacti Supports database monitoring through plugins and custom scripts, but requires more setup than PRTG |
Web performance monitoring | PRTG Out-of-the-box integration, no extra cost | Cacti Available through plugins like WebSeer, but not included in the core functionality |
Supports leading technologies | PRTG SNMP, flow protocols, packet sniffing, WMI, HTTP, ping, SQL, and much more | Cacti Primarily SNMP-focused, with support for scripts and custom data collection methods; less comprehensive than PRTG without additional configuration |
Create your own scripts | PRTG Own PRTG API included for custom sensors and scripts | Cacti Extensible through custom scripts and plugins; strong support for custom data collection methods |
Includes technical support | PRTG Expert support included, no extra costs | Cacti Community-based support through forums and documentation; no official technical support |
“All-around winning
network monitor”
“The real beauty of PRTG is the endless possibilities it offers”
“PRTG Network Monitor
is very hard to beat”
Cacti mainly offers bandwidth and traffic monitoring via SNMP and displays data in charts. It may not be enough if you are hoping to analyze network bandwidth in detail or break bandwidth down by IP address or protocol, for example.
PRTG offers comprehensive bandwidth monitoring including a complete overview of the bandwidth usage in your network. Along with SNMP, PRTG supports various flow protocols (NetFlow, jFlow, sFlow, IPFIX) and WMI, as well as packet sniffing technology.
As a result, you can quickly identify potential disruptions, determine the causes of problems, and eliminate errors.
Cacti is an open-source network tool that regularly collects and displays network data. It can quickly fall short if you’re looking to set up comprehensive network management. However, PRTG is a powerful all-in-one network monitoring tool that is much more than just an alternative to Cacti.
PRTG not only monitors network traffic and bandwidth, but also provides an overview of your network hardware, virtual machines, servers, databases, applications, and much more.
By working with technologies such as SNMP, SSH, flow, WMI, ICMP (used by ping), as well as a powerful API, PRTG lets you monitor practically every component in your network.
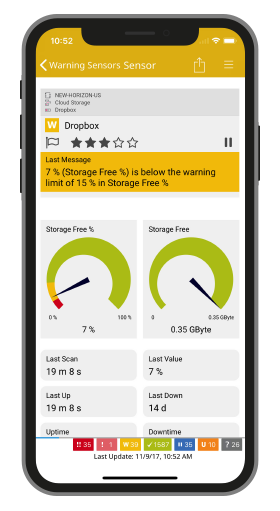
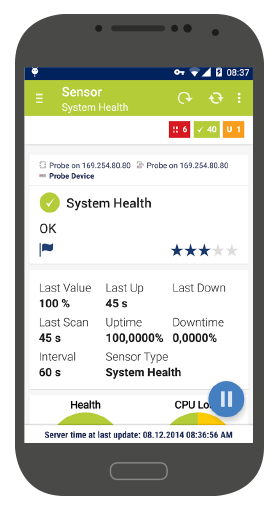
PRTG mobile apps let you monitor your network while on the go. With Cacti and many other monitoring tools, you can only monitor by way of the web interface. PRTG apps run on smartphones, tablets, and smartwatches with an iOS or Android operating system. Push notifications can be sent directly to your smartphone in the event of warning messages or errors in your network.
You are interested to know if PRTG could be an alternative to your Cacti implementation?

PRTG is set up in a matter of minutes and can be used on a wide variety of mobile devices.

We also compared PRTG with other monitoring tools:
The basic version of the open-source tool Nagios is free of charge. But most users spent many hours to set up and customize the tool. In case of problems, browsing through forums is often the only solution.
SolarWinds might be interesting for extremely complex network environments. But it also means you need to invest in higher costs for a platform made up of different modules and add-ons (that cost extra).
Zabbix is open-source software with a strong community support. But it requires lots of manual configuration work to install and set it up. You also need to install agents on the monitored systems.
Auvik is a cloud-based monitoring & mapping tool that is relatively easy to install and configure. However, many monitoring features need to be purchased as extra modules, which can quickly drive up costs.
Real-time notifications mean faster troubleshooting so that you can act before more serious issues occur.
Partnering with innovative IT vendors, Paessler unleashes synergies to create
new and additional benefits for joined customers.
Paessler and Plixer provide a complete solution adding flow and metadata analysis to a powerful network monitoring tool.
IT that works constitutes a business-critical basis for a company's success. Availability and security must be defined for the respective purpose and closely monitored – by OT and IT alike.
Siemon and Paessler bring together intelligent building technology and advanced monitoring and make your vision of intelligent buildings and data centers become reality.
Network Monitoring Software – Version 25.3.110.1313 (August 27, 2025)
Download for Windows and cloud-based version PRTG Hosted Monitor available
English, German, Spanish, French, Portuguese, Dutch, Russian, Japanese, and Simplified Chinese
Network devices, bandwidth, servers, applications, virtual environments, remote systems, IoT, and more
Choose the PRTG Network Monitor subscription that's best for you
Choosing between Paessler PRTG and Cacti depends on several factors, such as your specific network monitoring needs, budget, and technical resources available in your organization.
PRTG is ideal:
Cacti might be your choice:
PRTG is inexpensive for all-in-one network monitoring software. It will usually save you money in the long run even compared to free open source software. Many of our customers have enjoyed substantial savings by using PRTG over other monitoring tools like Cacti, and have found that PRTG usually pays for itself within months.
What’s more, you’ll save many hours of effort (and avoid headaches) with PRTG’s easy-to-use interface, expert tech support, and simplified operation. When you consider the “big picture,” PRTG saves you time and money with its superior usability and reliability.
In PRTG, “sensors” are the basic monitoring elements. One sensor usually monitors one measured value in your network, for example the traffic of a switch port, the CPU load of a server, or the free space on a disk drive. On average, you need about 5-10 sensors per device or one sensor per switch port.
Paessler conducted trials in over 600 IT departments worldwide to tune its network monitoring software closer to the needs of sysadmins. The result of the survey: over 95% of the participants would recommend PRTG – or already have.

You are interested to know if PRTG could be an alternative to your Cacti implementation?
