Custom alerts and data visualization let you quickly identify and prevent resource bottlenecks and other issues that slow down business operations.
Business processes are complex in itself – not to mention the processes that make up large enterprise networks.
Different business activities and requirements need to be aligned. Various teams and workgroups from several departments that work on different subprocesses need to be coordinated. Tools for business process monitoring and business process automation need to be integrated. And in all of this, you should have a central overview of everything that keeps the complete process running…
That’s where Paessler PRTG comes to the rescue. Our all-in-one business process monitoring tool helps you break down complex business operations while keeping an eye both on single workflows and the business process in its entirety – alerting you as soon as there’s an issue in the pipeline so you can step in and save the day.

You can usually view business processes from different perspectives: from the infrastructure level (Are hardware components like servers functional?), to the network level (Is network performance sufficient?), to the application level, to the end user (Is the user able to do everything they require?).
With our comprehensive business process monitoring software, you always have the status of all components on different levels – and from various perspectives – at your fingertips, in real time.
In a complex business process setting, not all stakeholders need the same amount of information. Management values the business activity impact, the service owner wants to know about service availability, and the engineer needs to be able to quickly identify the root cause of an error.
With PRTG’s drag-and-drop map editor, creating custom dashboards with different levels of detail is as easy as it gets – no matter if you visualize single components or end-to-end processes.
If you lack a comprehensive overview of your business processes, you will also lack the knowledge of how – or in which areas – to improve these processes.
PRTG business process monitoring provides you with a wealth of historical data that you can analyze to find out where there are bottlenecks or redundancies in your business operations that waste valuable resources. This lets you not only streamline workflows, but also cut unnecessary steps and reduce operating costs.
Diagnose network issues by continuously tracking the status of your core business processes. Show process efficiency, process health, service availability, and other key performance metrics in real time. Visualize business process monitoring data in clear graphs and dashboards to identify problems more easily. Gain the overview you need to troubleshoot end-to-end process execution, disruptions of your business operations, and other issues.

Device tree view of the complete monitoring setup

Custom PRTG dashboard for keeping an eye on the entire IT infrastructure

Live traffic data graph in PRTG
“All-around winning
network monitor”
“The real beauty of PRTG is the endless possibilities it offers”
“PRTG Network Monitor
is very hard to beat”
PRTG comes with more than 250 preconfigured sensor types for monitoring your entire network out of the box. One of these sensors is the Business Process sensor, a powerful tool with which you can create individual channels with data from any other sensor that keeps an eye on your infrastructure. In addition to the summarized, overall business process status. Here you can find 2 simple examples for monitoring business processes with PRTG.
Business service “remote access”
A business process that monitors the remote access for all the employees of a company can be categorized into different perspectives, for example:
All these single sensors can now be aggregated in one Business Process sensor for the overall status of the business service “remote access”, as well as the individual values of all other components that make up this process.
Business service “website”
A business process that monitors the entire website is of course much more complex than described here. You can see this as a starting point for your own ideas:
Again, all these single sensors can now be aggregated in one Business Process sensor for the overall status of the business service “website”, as well as the individual values of all other components that make up this process.
PRTG comes with more than 250 native sensor types for monitoring your entire on-premises, cloud, and hybrid cloud environment out of the box. Check out some examples below!
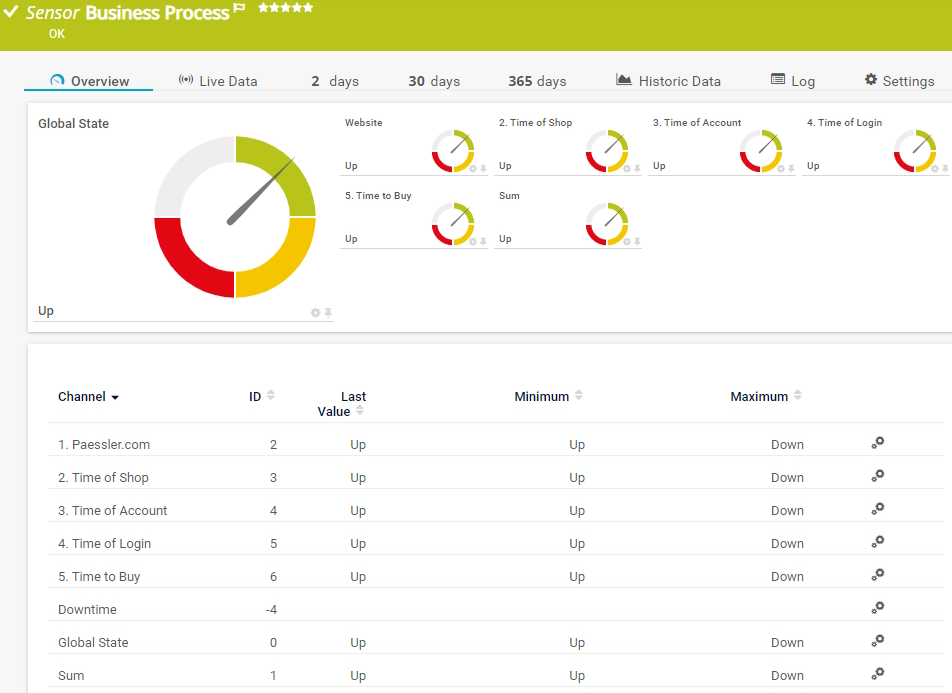
The Business Process sensor gives you a summarized status of entire business processes while monitoring several process components. This means that you can create a customized sensor with channels based on data from other source sensors. It can show the following:
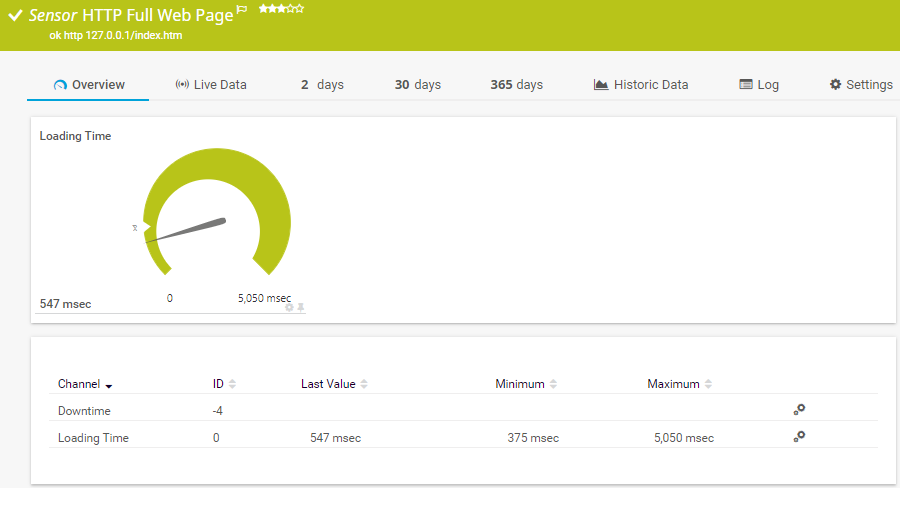
The HTTP Full Web Page sensor monitors the full download time of a web page including assets such as images. In the background, it opens the web page in a browser instance to perform the measurement. It can show the following:
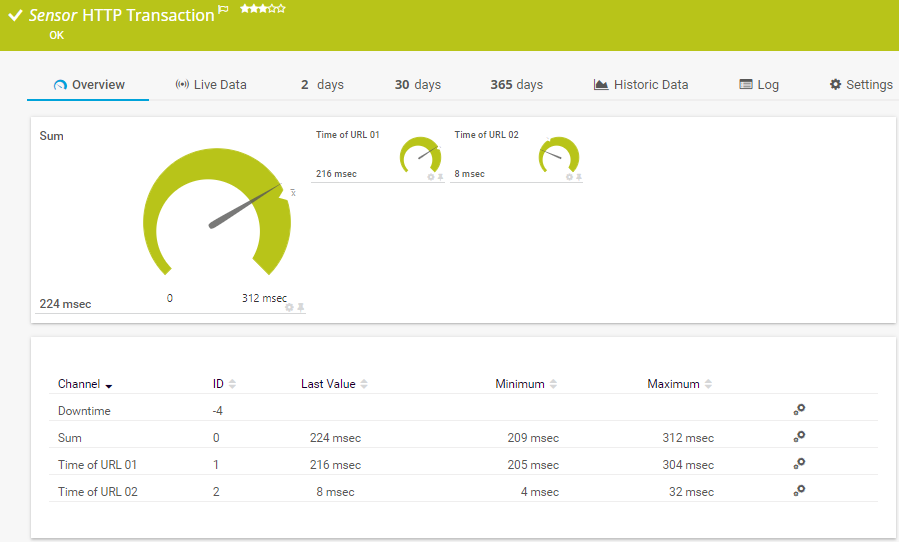
The HTTP Transaction sensor monitors an interactive website, such as a web shop, by performing a transaction using a set of HTTP URLs. The sensor monitors whether logins or shopping carts work properly. It can show the following:
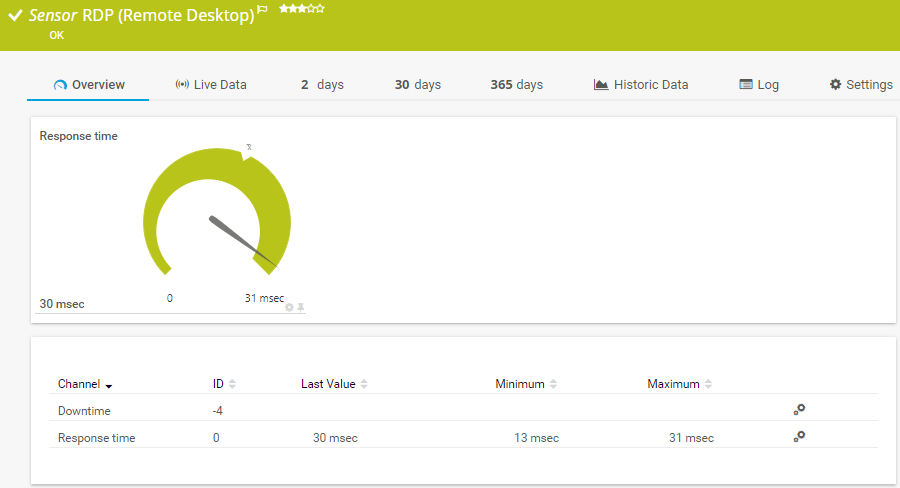
The RDP (Remote Desktop) sensor monitors remote desktop services such as Remote Desktop Protocol (RDP) or Terminal Services Client. It can show the following:
See the PRTG Manual for a list of all available sensor types.

Real-time notifications mean faster troubleshooting so that you can act before more serious issues occur.
PRTG is set up in a matter of minutes and can be used on a wide variety of mobile devices.

Paessler is a certified partner in the Amazon Web Services ecosystem, which includes a growing community of software vendors who are building solutions on cloud computing.
What does this mean for you?
Partnering with innovative IT vendors, Paessler unleashes synergies to create
new and additional benefits for joined customers.
Integrating monitoring results from PRTG into NetBrain maps makes the foundation for network automation.
IT that works constitutes a business-critical basis for a company's success. Availability and security must be defined for the respective purpose and closely monitored – by OT and IT alike.
With ScriptRunner Paessler integrates a powerful event automation platform into PRTG Network Monitor.
Custom alerts and data visualization let you quickly identify and prevent resource bottlenecks and other issues that slow down business operations.
Network Monitoring Software – Version 25.3.110.1313 (August 27, 2025)
Download for Windows and cloud-based version PRTG Hosted Monitor available
English, German, Spanish, French, Portuguese, Dutch, Russian, Japanese, and Simplified Chinese
Network devices, bandwidth, servers, applications, virtual environments, remote systems, IoT, and more
Choose the PRTG Network Monitor subscription that's best for you


A business process is a series of structured activities or tasks that an organization performs to achieve a specific goal or outcome. These processes are designed to deliver value to customers or stakeholders by optimizing the use of resources like people, technology, and information.
In practice, a business process might include actions such as taking an order, manufacturing a product, delivering a service, or processing a payment. Businesses often work to streamline and improve these processes to increase efficiency, reduce costs, and enhance customer satisfaction.
Business process monitoring (BPM) is the practice of tracking, analyzing, and managing the performance of business processes to ensure they run efficiently and effectively. It involves the continuous observation of key process metrics and performance indicators to detect issues, bottlenecks, or deviations from the expected workflow.
Key aspects of business process monitoring include:
Ensuring process compliance
Monitoring helps ensure that your processes adhere to internal standards, industry regulations, and legal requirements. This is critical for industries with strict compliance needs (for example finance, healthcare) to avoid penalties or reputational damage.
Enhancing customer satisfaction
Efficient and well-monitored processes lead to faster, more reliable service or product delivery. By detecting delays or quality issues early, you can ensure timely resolution, leading to improved customer experiences and satisfaction.
Real-time issue detection and troubleshooting
Process monitoring allows for the real-time identification of errors, failures, or deviations. Immediate alerts help you respond quickly, minimizing the impact of problems on operations and customer service.
Data-driven decision making
Monitoring provides valuable data about how your processes perform. This data gives management insights into areas needing improvement, investment, or restructuring. Data-driven decisions lead to more effective strategies and improvements.
Optimizing resource allocation
By monitoring resource usage (time, personnel, equipment, etc.), you can ensure that resources are allocated efficiently, avoiding overuse or underuse in certain areas and improving overall productivity.
“Business process management” refers to the workflows that are related to the identification, design, documentation, implementation, control, and subsequent optimization of business processes. Not only technical issues are examined but also organizational and strategic issues, for example. The word "process" simply refers to a recurring sequence of associated activities, that is, work steps that are always carried out in the same order.
“Business process monitoring”, on the other hand, is the task of reviewing and analyzing the execution of such processes to identify their successes and potential problems. Monitoring thus becomes an integral part of the business process management lifecycle and is usually performed using dedicated business process monitoring tools.
Enterprise business process monitoring provides several critical advantages including improved operational visibility, faster issue resolution, and enhanced compliance reporting. This enables organizations to identify bottlenecks before they impact productivity, ensuring seamless workflow continuity across departments and reducing operational costs through proactive management.
While traditional IT monitoring focuses on individual system components, business process monitoring takes a holistic approach by tracking end-to-end workflows that span multiple systems, applications, and departments. This comprehensive view allows organizations to understand how technical issues impact actual business operations and customer experiences.
Essential metrics for business process monitoring include process completion times, error rates, resource utilization, throughput volumes, and service level agreement compliance. These metrics provide insights into process efficiency, help identify improvement opportunities, and ensure that business operations meet established performance standards.
In PRTG, “sensors” are the basic monitoring elements. One sensor usually monitors one measured value in your network, for example the traffic of a switch port, the CPU load of a server, or the free space on a disk drive. On average, you need about 5-10 sensors per device or one sensor per switch port.
Paessler conducted trials in over 600 IT departments worldwide to tune its network monitoring software closer to the needs of sysadmins. The result of the survey: over 95% of the participants would recommend PRTG – or already have.

Paessler PRTG is used by companies of all sizes. Sysadmins love PRTG because it makes their job a whole lot easier.
Bandwidth, servers, virtual environments, websites, VoIP services – PRTG keeps an eye on your entire network.
Everyone has different monitoring needs. That’s why we let you try PRTG for free.